Market Overview
| Study Period | 2019 - 2031 |
|---|---|
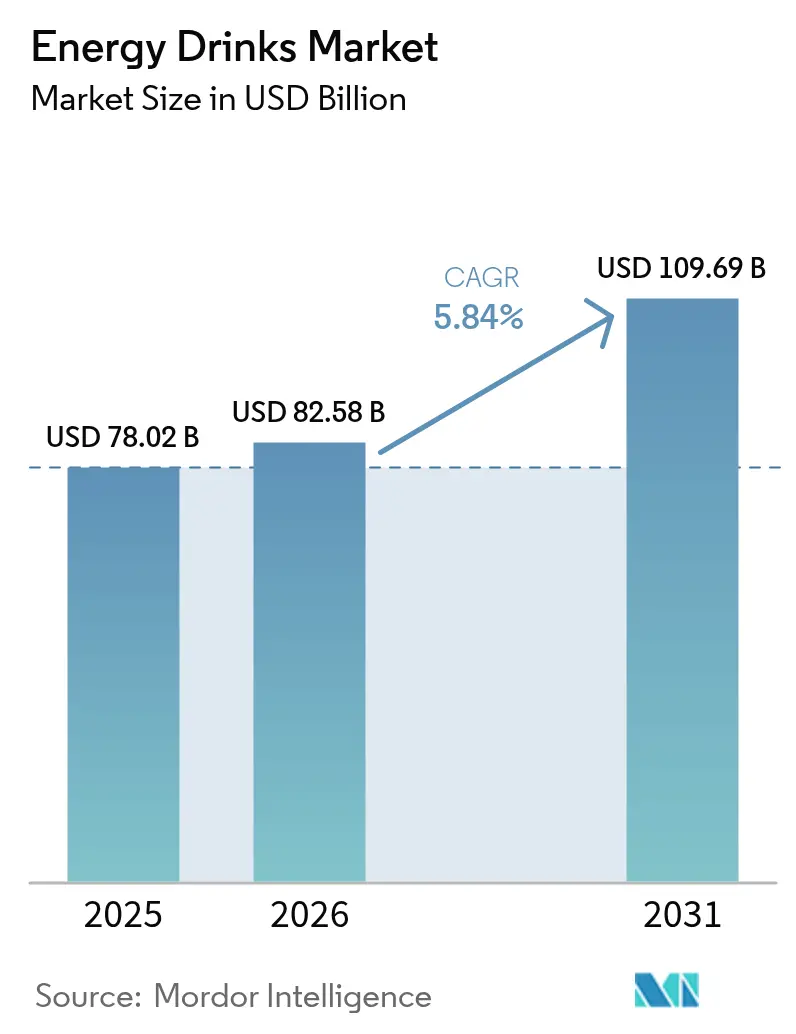
| Market Size (2026) | USD 82.58 Billion |
| Market Size (2031) | USD 109.69 Billion |
| Growth Rate (2026 - 2031) | 5.84% CAGR |
| Fastest Growing Market | Traditional Energy Drinks |
| Largest Market | Europe |
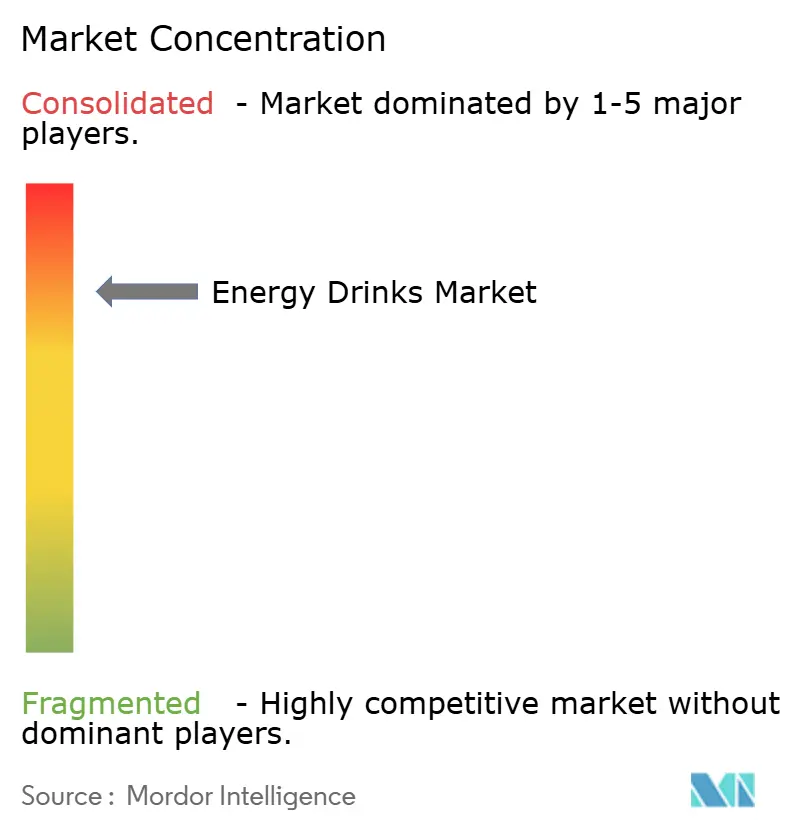
| Market Concentration | High |
Major Players
*Disclaimer: Major Players sorted in no particular order Image © Mordor Intelligence. Reuse requires attribution under CC BY 4.0. |
|
Energy Drinks Market Analysis by Mordor Intelligence
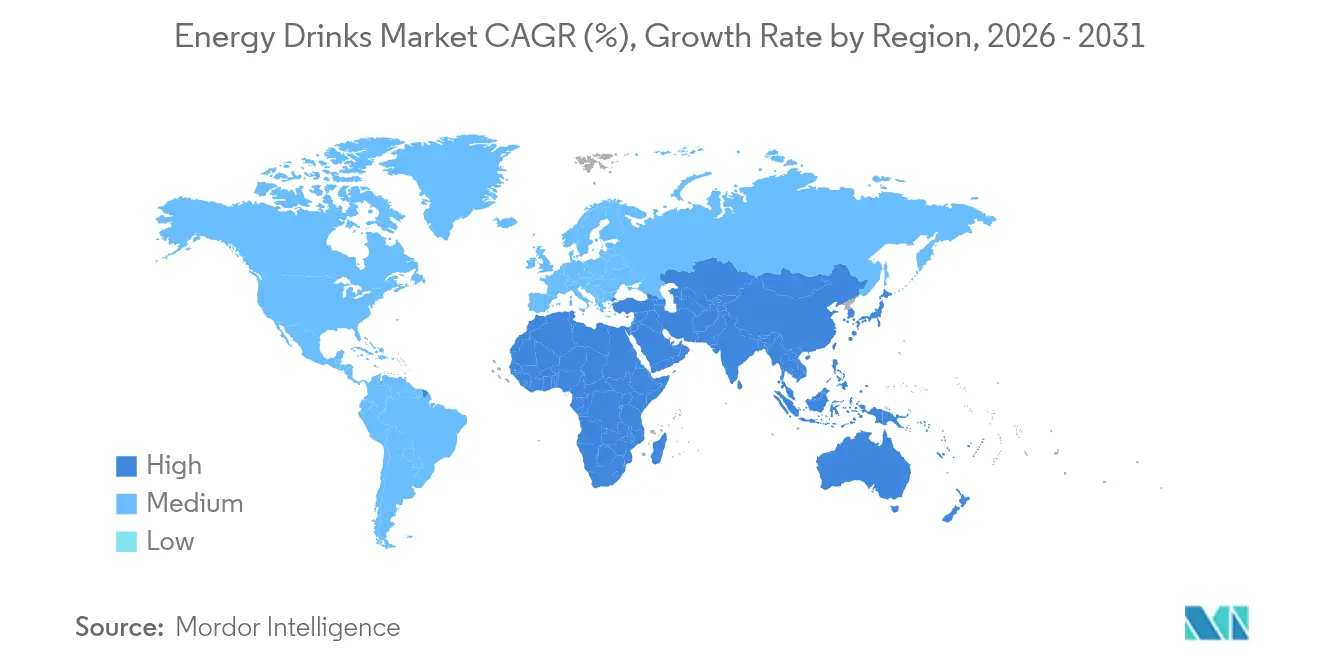
The energy drinks market size in 2026 is estimated at USD 82.58 billion, growing from 2025 value of USD 78.02 billion with 2031 projections showing USD 109.69 billion, growing at 5.84% CAGR over 2026-2031. As the market shifts from mere stimulation to a focus on functional wellness, clean-label claims and targeted health benefits are becoming central to formulation priorities. Consumers are increasingly favoring natural and organic variants, especially those fortified with plant-based caffeine sources like yerba mate and guayusa, striking a balance between efficacy and ingredient transparency. This trend towards premiumization is further bolstered by packaging innovations, notably the use of glass bottles, which not only reinforce sustainability narratives but also command a 30–40% price premium. While the Asia-Pacific region continues to dominate in volume, the Middle East and Africa are emerging as the fastest-growing markets. This growth is largely attributed to the Gulf Cooperation Council governments easing caffeine regulations, albeit with controls for youth access. Meanwhile, competitive intensity is on the rise, with over 200 regional challengers leveraging localized flavors and certifications to chip away at the margins of established players.
Key Report Takeaways
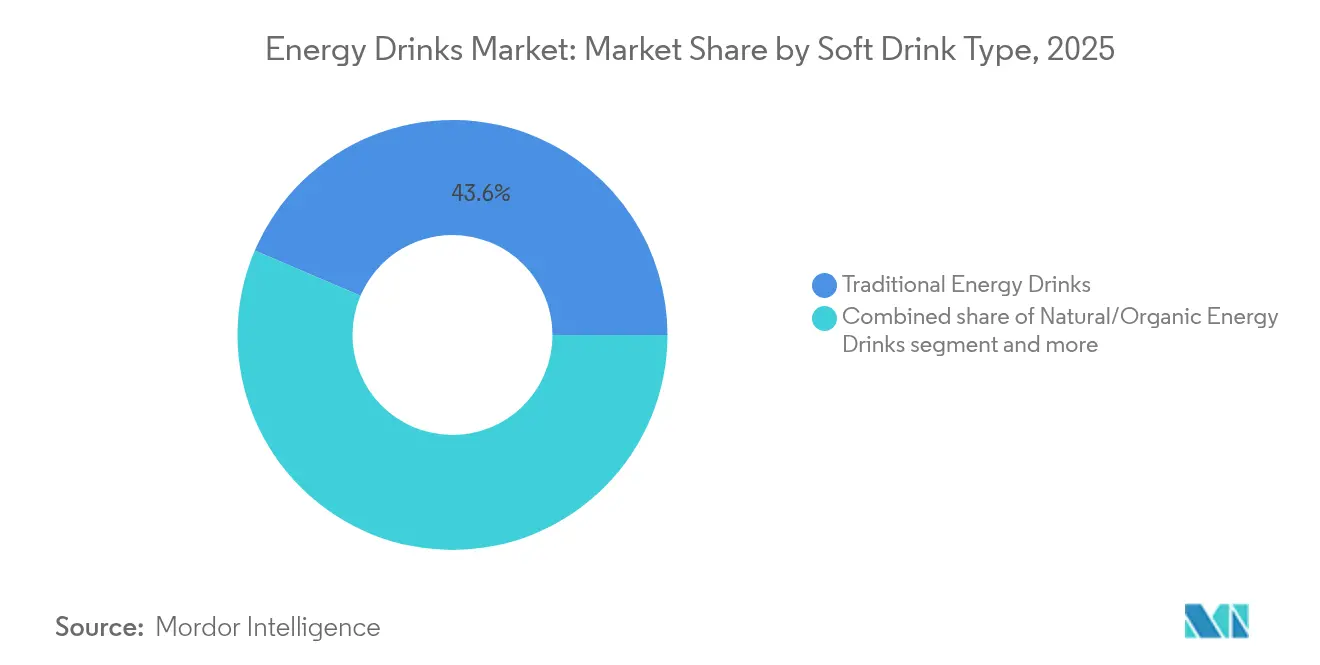
- By type, traditional formulations held 43.58% of the 2025 energy drinks market share and natural or organic variants are expanding at 7.12% CAGR through 2031.
- By packaging, metal cans accounted for 54.63% of 2025 volume while glass bottles are forecast to grow at 5.97% CAGR between 2026 and 2031.
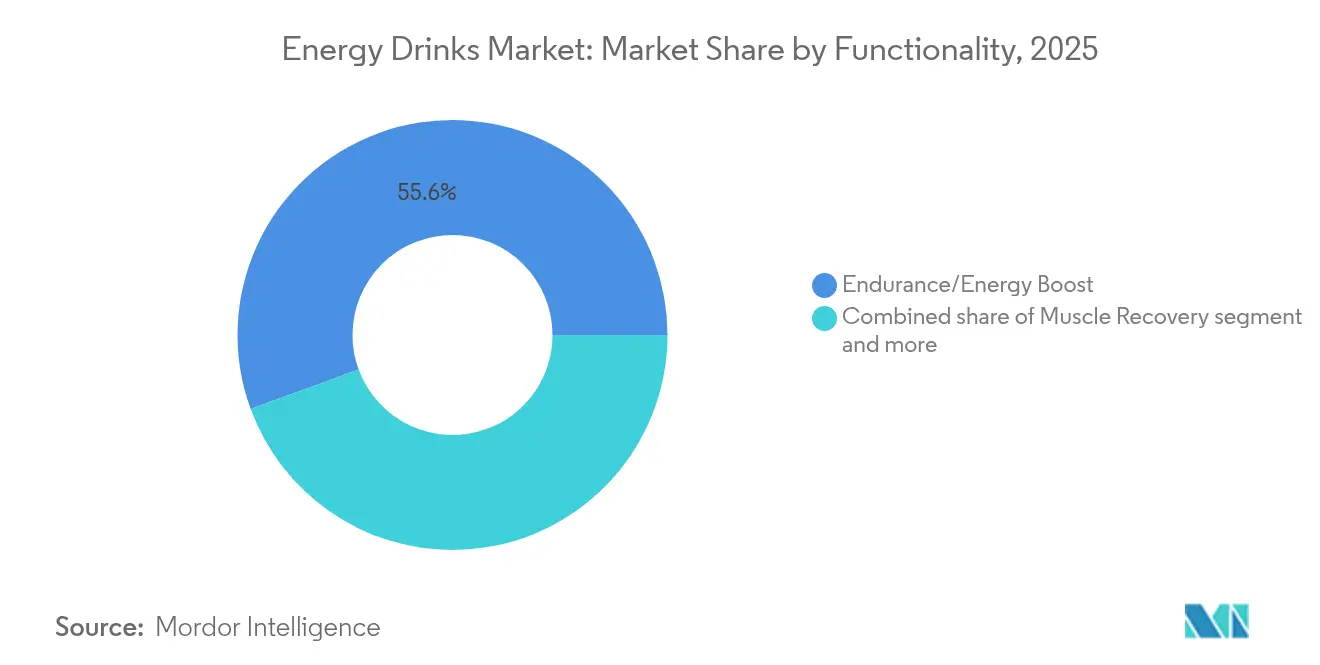
- By functionality, endurance and energy-boost claims represented 55.60% of 2025 volume and muscle recovery products are projected to register an 7.72% CAGR to 2031.
- By distribution channel, retail delivered 77.42% of 2025 sales, whereas HoReCa is set to advance at 6.33% CAGR over the forecast horizon.
- By geography, Asia-Pacific generated 52.62% of 2025 demand and Middle East and Africa is on track for a 6.21% CAGR through 2031.
Note: Market size and forecast figures in this report are generated using Mordor Intelligence’s proprietary estimation framework, updated with the latest available data and insights as of 2026.
Global Energy Drinks Market Trends and Insights
Drivers Impact Analysis*
| Driver | (~) % Impact on CAGR Forecast | Geographic Relevance | Impact Timeline |
|---|---|---|---|
| Busy lifestyles and on-the-go consumption | +1.2% | Global, strongest in Asia-Pacific urban centers and North American commuter markets | Medium term (2-4 years) |
| Expansion of convenience and e-commerce | +1.0% | North America, Europe, Asia-Pacific tier-1 cities, emerging in Middle East | Short term (≤ 2 years) |
| Functional beverage positioning | +1.3% | Global, led by North America and Western Europe, accelerating in Asia-Pacific | Long term (≥ 4 years) |
| Esports-focused formulations | +0.8% | North America, Europe, South Korea, China, with spillover to Southeast Asia | Medium term (2-4 years) |
| Clean-label natural caffeine | +0.9% | North America, Western Europe, Australia, premium Latin America segments | Long term (≥ 4 years) |
| Product innovation in flavors and formats | +1.1% | Global, fastest adoption in North America and Asia-Pacific | Short term (≤ 2 years) |
| Source: Mordor Intelligence | |||


Busy lifestyles and on-the-go consumption
As urban workdays stretch longer, meal times shrink, fueling a surge in demand for portable beverages packed with 80–200 mg of caffeine. Between 2022 and 2023, India accounted for 14.67 million workers in the digital economy[1]Source: European Food Safety Authority, "Health claims and nutrition claims – can I trust what’s said about the beneficial effects of foods?", efsa.europa.eu. Notably, 68% of these newcomers reported indulging in caffeinated drinks away from home at least thrice weekly. In 2024, North American consumers increasingly favored drive-through and mobile pickup options, accounting for a significant portion of energy-drink purchases, marking a notable rise compared to 2020. This shift was facilitated by retailers streamlining QR-code ordering. While brands boasting direct-store-delivery networks can replenish high-velocity SKUs within a short timeframe, this agility remains elusive for most regional firms. The trend towards portability has propelled the popularity of 2-ounce shots, outpacing the growth of larger cans, particularly in markets valuing discretion, and notably among women aged 25-34. This demographic is also drawn to clean-label claims and zero-sugar products, aligning with their preference for daily consumption.
Expansion of convenience and e-commerce channels
In 2024, Amazon's Subscribe and Save experienced significant growth in energy-drink subscriptions, reflecting the increasing consumer preference for convenience and recurring delivery options. Digital platforms are accelerating national rollouts, drastically reducing timelines, which gives emerging brands a head start, allowing them to scale before established players can respond. This shift in distribution dynamics is reshaping how brands approach market entry and expansion strategies. Convenience stores, which played a major role in energy drink distribution in 2024, have been expanding their cooler space annually to accommodate new SKUs. This expansion is particularly advantageous for brands offering promotions that resonate with Gen Z consumers, who are drawn to value-driven deals and innovative product offerings. While e-commerce has a strong presence in North America and Western Europe, Southeast Asia lags behind. This lag is attributed to prevalent cash-on-delivery practices and a fragmented last-mile logistics system, hinting at significant growth potential as infrastructure develops and digital payment adoption increases.
Functional beverage positioning
Formulators are now enhancing energy drinks with vitamins, electrolytes, nootropics, and adaptogens, positioning them as performance nutrition rather than mere indulgence. Celsius’s MetaPlus blend helped the company capture 11% of U.S. dollar sales in 2024, a rise from 6% in 2022. Notably, a 12-ounce can retails at USD 2.99, compared to USD 2.29 for standard formulations. Since 2023, the European Food Safety Authority has rejected 70% of evaluated claims, citing insufficient scientific evidence as the reason[2]Source: Ministry of Electronics and Information Technology, "ESTIMATION AND MEASUREMENT OF INDIA’S DIGITAL ECONOMY", meity.gov.in. In the U.S., brands assert their GRAS status, but this leaves them vulnerable to FDA scrutiny if adverse events emerge. While major players have in-house toxicology teams, start-ups grapple with study costs ranging from USD 50,000 to 150,000 per ingredient. Such compliance challenges shed light on the ongoing consolidation in the industry.
Esports/gamer-targeted formulations
In 2024, esports captivated a massive global audience, forging a clear connection between gaming culture and energy-drink consumption. Red Bull's partnership with League of Legends alone generated significant impressions, boosting brand visibility without leaning on traditional media outlets. Energy drinks tailored for gamers typically pack high levels of caffeine, often combined with nootropics like citicoline. This unique formulation makes them prime candidates for shelves in hardware stores and gaming cafés. Beverage sales experienced notable growth in 2024 at South Korea's PC-bang channel, thanks in part to operators cashing in on per-can incentives, courtesy of brand marketing budgets. While the gamer demographic predominantly consists of males and individuals aged 18–34, a notable uptick in female participation is steering brands towards milder flavor profiles and lower-caffeine options.
Restraints Impact Analysis*
| Restraint | (~) % Impact on CAGR Forecast | Geographic Relevance | Impact Timeline |
|---|---|---|---|
| Health and regulatory scrutiny of caffeine/sugar | –0.7% | Global, most acute in Europe and some U.S. jurisdictions, emerging in Asia-Pacific | Long term (≥ 4 years) |
| Competition from RTD coffee and sports drinks | –0.5% | North America, Western Europe, Australia, limited effect in Asia-Pacific | Medium term (2-4 years) |
| Aluminum-can supply volatility | –0.4% | Global, sharpest in Europe and North America, moderate in Asia-Pacific | Short term (≤ 2 years) |
| Youth-sale bans in selected European countries | –0.3% | Central and Eastern Europe, under review in Nordic countries | Medium term (2-4 years) |
| Source: Mordor Intelligence | |||
Health and regulatory scrutiny of caffeine and sugar
In January 2024, Poland, responding to 340 emergency-room visits for caffeine overdose in 2023, as reported by the USDA, implemented a ban on the sale of energy drinks to consumers under 18. This measure reflects growing concerns over the health risks associated with excessive caffeine consumption among younger demographics. In the same year, Lithuania took a proactive step by removing energy drinks from checkout aisles to discourage impulsive purchases, particularly by minors. Meanwhile, Denmark is evaluating similar regulatory actions to address these concerns. The European Food Safety Authority (EFSA) maintains a daily caffeine limit of 400 mg, but individual member states have the authority to enforce stricter regulations, adding complexity for multinational companies striving to ensure compliance across diverse markets[3]Source: European Food Safety Authority, "Caffeine", efsa.europa.eu. Concurrently, the World Health Organization has issued guidance recommending that free sugars should not exceed 10% of total caloric intake, emphasizing the need for healthier product formulations. While reformulating energy drinks into zero-sugar variants can effectively reduce calorie content, it introduces challenges in maintaining consumer satisfaction. Blind taste tests indicate that only 62% of consumers find the taste of artificial sweeteners in energy drinks acceptable, highlighting a significant hurdle for manufacturers aiming to balance health considerations with taste preferences.
Competition from RTD coffee and sports drinks
Ready-to-drink coffee and caffeinated sports beverages are increasingly taking over occasions traditionally dominated by energy drinks. In 2024, Starbucks' bottled coffee line, distributed by PepsiCo, achieved significant success, with each unit boasting a moderate to high caffeine content, catering to consumers seeking both convenience and energy. Meanwhile, sports drink brands are rolling out caffeinated versions, merging hydration with stimulation to attract a wider audience, including fitness enthusiasts and individuals with active lifestyles. Notably, consumers aged 35-54 show less loyalty to energy drinks, often switching brands based on price, flavor, or specific claims, indicating a growing demand for variety and tailored functionality in the beverage market.
*Our forecasts treat driver/restraint impacts as directional, not additive. The impact forecasts reflect baseline growth, mix effects, and variable interactions.
Segment Analysis
By Type: Natural Variants Reshape Formulation Priorities
In 2025, traditional energy drinks dominate the market, boasting a 43.58% share. This stronghold is largely attributed to the extensive distribution networks and brand equity of giants like Red Bull and Monster. These brands have established a loyal consumer base and maintain significant visibility through aggressive marketing campaigns and sponsorships. While natural and sugar-free alternatives are gaining traction, traditional energy drinks still command prime retail shelf space and spur impulse buys, particularly in convenience stores and supermarkets. Yet, these traditional drinks face mounting pressures to reformulate, especially as private-label natural drinks offer prices nearly 30% lower, all while delivering similar caffeine levels. Although there's a slow drift away from traditional drinks due to rising health consciousness, they still play a pivotal role in anchoring the category's overall value, supported by their widespread availability and established consumer trust.
Natural and organic energy drinks are on a rapid ascent, growing at a 7.12% CAGR, outpacing the broader market's 5.84% growth rate. This surge is driven by consumers' preference for cleaner labels and ingredients, even as obtaining USDA Organic certification pushes input costs up by 15–20%. These drinks enjoy retail premiums of over 35%, ensuring healthy margins and spurring further innovation. The segment benefits from increasing consumer awareness about health and wellness, as well as a growing inclination toward sustainable and ethically sourced products. Given this trajectory, natural and organic energy drinks are set to claim about 20% of the category's sales in the coming years. This trend aligns with a wider consumer shift towards functional and ethically marketed beverages, leaving traditional carbonated drinks trailing behind. Additionally, the segment's growth is supported by the rising popularity of plant-based ingredients and adaptogens, which appeal to health-conscious and younger demographics.


By Packaging Type: Glass Gains as Sustainability and Premiumization Align
In 2025, metal cans dominated the energy drinks market, capturing 54.63% of the total volume. Their prevalence is attributed to established manufacturing processes, efficient shelf space usage, and consumer familiarity. However, this segment is grappling with margin pressures stemming from fluctuations in aluminum prices. Following closely, PET bottles have carved out a significant market share, catering to larger, resealable pack sizes favored by cost-conscious consumers. Yet, these bottles face scrutiny due to concerns over their recycling rates. Aseptic cartons and pouches, accounting for 8% of the market volume, present growth potential. They offer advantages like extended shelf life and practicality, especially in warmer regions with limited refrigeration. Collectively, these traditional formats form the backbone of energy drink distribution and consumption.
Glass bottles are emerging as the fastest-growing packaging format, boasting a 5.97% CAGR. Premium natural and organic beverage brands are capitalizing on glass's association with purity, quality, and recyclability. While brands face a distribution breakage cost of approximately USD 0.12 per unit, they counterbalance this with shelf price premiums, bolstered by a stronger appeal to sustainability-conscious consumers. This pivot towards glass packaging mirrors a broader industry trend prioritizing eco-friendly materials and transparency in ingredient sourcing. If the current momentum persists, glass-based energy drinks could see a significant uptick in market share in the coming years. The market now showcases a diverse array of formats, catering to everything from on-the-go energy shots to premium offerings in the natural segment.
By Functionality: Muscle Recovery Extends Beyond Stimulation
In 2025, endurance and energy-boost drinks dominated the energy drinks market, capturing 55.60% of sales, underscoring caffeine’s pivotal role in consumer preference. These products cater to consumers seeking immediate energy and sustained alertness, anchoring the core of category demand. Meanwhile, muscle-recovery drinks, fortified with 20–30 grams of protein and 150–200 mg of caffeine, exhibited rapid growth at an 7.72% CAGR. Their crossover appeal with the USD 18 billion sports-nutrition market drives their popularity, especially among gym-goers aged 25-44. Notably, one in three of these individuals consumes them post-workout, bolstering the segment's premium pricing.
Cognitive-enhancement energy drinks are gaining traction by incorporating adaptogens like ashwagandha. However, regulatory bodies are increasingly scrutinizing claims that lack scientific backing. Furthermore, electrolyte-infused variants, which blend sodium and potassium with caffeine, are merging with conventional sports drinks, offering both hydration and stimulation. While rising whey protein costs have spurred interest in plant-based proteins, their amino acid profiles are less than ideal. Looking ahead, muscle-recovery drinks are set to expand their market presence, potentially capturing a larger share of the overall energy drinks market.
By Distribution Channel: HoReCa Velocity Outpaces Retail Volume
In 2025, energy drink distribution was predominantly channeled through retail outlets, capturing a commanding 77.42% of the total volume. Supermarkets and hypermarkets emerged as the frontrunners, boasting the widest selections of stock-keeping units (SKUs). Yet, these retail giants come with a hefty price tag, imposing slotting fees that can soar up to USD 50,000 for each product line, thereby squeezing brand profit margins. Convenience stores, catering to the fast-paced consumer, primarily offer single-serve cans, averaging a basket size of 1.4 units. Meanwhile, online sales, which constituted a significant portion of the retail volume in 2024, experienced a robust growth, largely driven by subscription programs that bolster customer loyalty and streamline acquisition costs.
The HoReCa (Hotel, Restaurant, Café) sector is witnessing the most rapid expansion, growing at a 6.33% CAGR. Nightlife venues, cafés, and esports arenas are increasingly entering exclusive-pour contracts, ensuring a steady supply. These establishments benefit from attractive gross margins nearing 50%, thanks to fountain systems that lower the cost per serving. Exclusive collaborations, such as Red Bull’s initiative with entertainer bars, fortify competitive advantages by securing prime entertainment spots and guaranteeing a steady demand from patrons. This burgeoning presence in the HoReCa sector not only broadens the distribution landscape for energy drinks but also taps into the rising trend of social and experiential consumption.
Geography Analysis
In 2025, the Asia-Pacific region led the global output with a commanding 52.62% share. China and India spearheaded this dominance, with both nations witnessing their modern retail footprints double since 2020. In China, the energy drinks market experienced a notable uptick in 2024. This surge was primarily driven by professionals in tier-2 cities, who increasingly turned to energy drinks during peak overtime hours to maintain their stamina. This shift highlights the growing acceptance of energy drinks as essential functional beverages among urban professionals. Meanwhile, India's energy drink market celebrated a robust 16% growth. However, with per-capita consumption at just one-tenth of North America's, the potential for expansion is immense. This disparity in per-capita intake signals manufacturers to boost awareness and accessibility, setting the stage for increased adoption. Japan, with its mature market, faced challenges due to its aging demographic. The older generation's preference for tea over carbonated energy drinks has tempered the market's growth, underscoring the need for strategies tailored to engage this demographic.
North America, a heavyweight in global demand, is characterized by fierce competition. Celsius, a prominent player in the region, has successfully expanded its market share, underscoring its strong brand positioning and astute marketing strategies. The competitive landscape in North America is defined by aggressive product innovation, lively marketing campaigns, and a pronounced focus on health-conscious consumers, all driving the demand for energy drinks. Europe, while commanding a significant share of the global volume, faces challenges from stringent regulations shaping its market landscape. In countries like Poland and Lithuania, youth-sale restrictions complicate matters for manufacturers targeting younger consumers. These health-centric regulations necessitate companies to adjust their strategies, balancing compliance with market share retention. Nevertheless, Europe's established consumer base and evolving preferences solidify its status as a crucial market for energy drinks.
The Middle East and Africa are emerging as the fastest-growing regions, boasting a 6.21% CAGR. This surge is largely attributed to the burgeoning expatriate communities and the swift evolution of the hospitality sector, amplifying the demand for energy drinks in social and leisure contexts. With a diverse consumer base and escalating disposable incomes, the region offers a fertile ground for market players to roll out innovative products tailored to local tastes. South America recorded growth, spurred by local brands harnessing regional flavors for differentiation. By aligning with cultural preferences, these brands have crafted unique offerings that resonate deeply with consumers. Yet, governmental tariffs present hurdles for both domestic and international entities, influencing pricing and profit strategies. Still, the region's expanding consumer base and heightened interest in functional beverages signal a promising landscape for market growth.

Competitive Landscape
The energy drinks market is witnessing a moderately consolidated competitive landscape. In 2024, the top five players accounted for roughly 60% of the market volume. Red Bull stands out with its premium positioning, while Monster capitalizes on a diverse flavor portfolio. Meanwhile, PepsiCo, Coca-Cola, and Keurig Dr Pepper leverage their extensive beverage networks to secure prime shelf space. Midsize challengers are turning to influencer marketing and direct-to-consumer channels, resulting in customer lifetime values that are three times higher than their store-focused counterparts. Technology plays a pivotal role: Celsius's QR-code packaging connects cans to workout-tracking apps, boosting repeat purchase rates by 18%.
Acquisitions continue to be a key strategy. In October 2024, Keurig Dr Pepper shelled out USD 990 million for Ghost Energy, gaining valuable intellectual property in the realms of gaming and fitness branding. In 2024, Monster Beverage secured seven patents for a microencapsulation technique, aiming to extend the effects of caffeine. While compliance costs, especially for toxicology testing and age-gating, pose challenges, they also create barriers that protect established players. This dynamic has led to strategic alliances among emerging brands.
Regional players are carving out niches by offering Halal or Kosher certifications and localized flavors like tamarind, lychee, or date. These tailored offerings find a receptive audience in the Middle East, Africa, and Southeast Asia, where cultural preferences are diverse. Concerns over aluminum-can supply have prompted vertical integration moves; both Celsius and Monster are bolstering their supply security by investing in co-packing and can-making capacities, eyeing stability through 2027.
Energy Drinks Industry Leaders
-
Monster Beverage Corporation
-
PepsiCo, Inc.
-
Red Bull GmbH
-
Suntory Holdings Limited
-
T.C. Pharmaceutical Industries Company Limited
- *Disclaimer: Major Players sorted in no particular order

Recent Industry Developments
- November 2025: Monster Energy unveiled Ultra Wild Passion, a new addition to its Ultra lineup. This zero-sugar energy drink boasts a bold passionfruit flavor, complemented by refreshing citrus notes.
- October 2025: Grupo Jumex and AriZona Beverages deepened their collaboration, introducing Jumex Energy, a new line of energy drinks crafted from authentic fruit nectar blends.
- October 2025: Slush Puppie teamed up with licensee Applied Nutrition to roll out performance energy drinks in cans, drawing inspiration from the iconic slushie brand with nostalgic Blue Raspberry and Cherry flavors.
- January 2025: Anheuser-Busch, in collaboration with 1st Phorm and UFC CEO Dana White, announced the launch of Phorm Energy. Set to debut in May 2025, this zero-sugar energy drink line is crafted with natural caffeine sourced from green tea, hydrating electrolytes, and is free from artificial flavors.


Global Energy Drinks Market Report Scope
Energy Shots, Natural/Organic Energy Drinks, Sugar-free or Low-calories Energy Drinks, Traditional Energy Drinks are covered as segments by Soft Drink Type. Glass Bottles, Metal Can, PET Bottles are covered as segments by Packaging Type. Off-trade, On-trade are covered as segments by Distribution Channel. Africa, Asia-Pacific, Europe, Middle East, North America, South America are covered as segments by Region.
By Type
| Traditional Energy Drinks |
| Sugar-free or Low-calories Energy Drinks |
| Natural/Organic Energy Drinks |
| Energy Shots |
| Other Energy Drinks |
By Packaging Type
| PET Bottles |
| Glass Bottles |
| Metal Can |
| Aseptic packages (tetra pak, cartons, pouches) |
| Disposable Cups |
Fucntionality
| Endurance/Energy Boost |
| Muscle Recovery |
| Other |
By Distribution Channel
| HoReCa | |
| Retail | Supermarkets/Hypermarkets |
| Convenience/Grocery Stores | |
| Online Retail Stores | |
| Other Distribution Channels |
By Geography
| North America | United States |
| Canada | |
| Mexico | |
| Rest of North America | |
| Europe | Germany |
| United Kingdom | |
| France | |
| Italy | |
| Spain | |
| Russia | |
| Netherlands | |
| Poland | |
| Belgium | |
| Sweden | |
| Rest of Europe | |
| Asia-Pacific | China |
| India | |
| Japan | |
| South Korea | |
| Australia | |
| Indonesia | |
| Thailand | |
| Singapore | |
| Rest of Asia-Pacific | |
| South America | Brazil |
| Argentina | |
| Colombia | |
| Chile | |
| Peru | |
| Rest of South America | |
| Middle East and Africa | Saudi Arabia |
| United Arab Emirates | |
| Nigeria | |
| Egypt | |
| Morocco | |
| Turkey | |
| South Africa | |
| Rest of Middle East and Africa |
| By Type | Traditional Energy Drinks | |
| Sugar-free or Low-calories Energy Drinks | ||
| Natural/Organic Energy Drinks | ||
| Energy Shots | ||
| Other Energy Drinks | ||
| By Packaging Type | PET Bottles | |
| Glass Bottles | ||
| Metal Can | ||
| Aseptic packages (tetra pak, cartons, pouches) | ||
| Disposable Cups | ||
| Fucntionality | Endurance/Energy Boost | |
| Muscle Recovery | ||
| Other | ||
| By Distribution Channel | HoReCa | |
| Retail | Supermarkets/Hypermarkets | |
| Convenience/Grocery Stores | ||
| Online Retail Stores | ||
| Other Distribution Channels | ||
| By Geography | North America | United States |
| Canada | ||
| Mexico | ||
| Rest of North America | ||
| Europe | Germany | |
| United Kingdom | ||
| France | ||
| Italy | ||
| Spain | ||
| Russia | ||
| Netherlands | ||
| Poland | ||
| Belgium | ||
| Sweden | ||
| Rest of Europe | ||
| Asia-Pacific | China | |
| India | ||
| Japan | ||
| South Korea | ||
| Australia | ||
| Indonesia | ||
| Thailand | ||
| Singapore | ||
| Rest of Asia-Pacific | ||
| South America | Brazil | |
| Argentina | ||
| Colombia | ||
| Chile | ||
| Peru | ||
| Rest of South America | ||
| Middle East and Africa | Saudi Arabia | |
| United Arab Emirates | ||
| Nigeria | ||
| Egypt | ||
| Morocco | ||
| Turkey | ||
| South Africa | ||
| Rest of Middle East and Africa | ||


Market Definition
- Carbonated Soft Drinks (CSDs) - Carbonated soft drinks (CSDs) refer to non-alcoholic beverages that are carbonated and typically flavored, containing dissolved carbon dioxide to create effervescence. These beverages commonly include cola, lemon-lime, orange, and various fruit-flavored sodas. Marketed in cans, bottles, or fountain dispense.
- Juices - We have considered packaged juices which encompass non-alcoholic beverages derived from fruits, vegetables, or a combination thereof, processed and sealed in various packaging formats such as bottles, cartons, or pouches. Excluding fresh juices, this market segment involves commercially prepared and preserved juices, often with added preservatives and flavors.
- Ready-to-Drink (RTD) Tea and RTD Coffee - Ready-to-Drink (RTD) tea and RTD coffee are pre-packaged, non-alcoholic beverages that are brewed and prepared for consumption without further dilution. RTD tea typically includes various tea varieties, infused with flavors and sweeteners, and comes in bottles, cans, or cartons. Similarly, RTD coffee involves pre-brewed coffee formulations, often mixed with milk, sugar, or flavorings, and is conveniently packaged for on-the-go consumption.
- Energy Drinks - Energy drinks are non-alcoholic beverages formulated to provide a quick boost of energy and alertness. Whereas, sports drinks are beverages designed to hydrate and replenish electrolytes, particularly after physical exertion, exercise, or intense activity
| Keyword | Definition |
|---|---|
| Carbonated Soft Drinks | Carbonated soft drinks (CSDs) are a combination of carbonated water and flavouring, sweetened by sugar or a non-sugar sweeteners. |
| Standard Cola | Standard Cola is defined as the original flavor of cola soda. |
| Diet Cola | A cola-based soft drink containing no or low amounts of sugar |
| Fruit Flavored Carbonates | A carbonated beverage prepared from fruit juice/fruit flavor with carbonated water and containing sugar, dextrose, invert sugar or liquid glucose either singly or in combination. It may contain peel oil and fruit essences. |
| Juice | Juice is a drink made from the extraction or pressing of the natural liquid contained in fruit and vegetables. |
| 100% Juice | Fruit/vegetable juice made from fruit in the form of its juice with no water added to make up the volume. It is not permitted to add sugars, sweeteners, preservatives, flavourings or colourings to fruit juice. |
| Juice Drinks (up to 24% Juice) | Fruit/vegetable juice drinks with up to 24% fruits/vegetable extract. |
| Nectars (25-99% Juice) | Juices that can have between 25 and 99% of fruit, with the minimum legal limits defined depending on the type of fruit |
| Juice concentrates | Juice Concentrates are those form of juices when most of this liquid is removed resulting in a thick, syrupy product known as juice concentrate. |
| RTD Coffee | Packaged coffee beverages that are sold in a prepared form and are ready for consumption at the time of purchase. |
| Iced Coffee | An iced coffee is a cold version of coffee, usually a combination of hot espresso and milk with ice added to it. |
| Cold Brew Coffee | Cold brew also called cold water extraction or cold pressing is made by steeping ground coffee in room-temperature water for several hours. |
| RTD Tea | Ready-to-drink (RTD) tea is a packaged tea product ready for immediate consumption without brewing or preparation |
| Iced Tea | Ice tea or iced tea is a drink made from tea without milk but with sugar and sometimes fruit flavourings, drunk cold. |
| Green Tea | Green tea is a tea beverage which promotes mental alertness, relieving digestive symptoms and promoting weight loss. |
| Herbal Tea | Herbal tea beverages are made from the infusion or decoction of herbs, spices, or other plant material in hot water. |
| Energy Drink | A type of drink containing stimulant compounds, usually caffeine, which is marketed as providing mental and physical stimulation. They may or may not be carbonated and may also contain sugar, other sweeteners, or herbal extracts, among numerous possible ingredients. |
| Sugar-free or Low-calories Energy Drinks | Sugar-free or Low-calories Energy Drinks are sugar-free, artificially sweetened energy drinks with few or no calories. |
| Traditional Energy Drink | Traditional Energy Drinks are functional soft drinks containing ingredients designed to boost the consumer's energy. |
| Natural/Oraganic Energy Drinks | Natural/Organic energy drinks are energy drinks free of artificial sweeteners and synthetic colorings. Instead, they contain naturally derived ingredients such as green tea, yerba mate, and botanical extracts. |
| Energy Shots | A small but highly concentrated energy drink that contains large amounts of caffeine and/or other stimulants. The quantity is comparatively smaller compared to energy drinks. |
| Sports Drink | Sports drinks are beverages designed specifically for the rapid supply of fluid, carbohydrates, and electrolytes before, during or after exercise. |
| Isotonic | Isotonic drinks contain similar concentrations of salt and sugar as in the human body, and are designed to quickly replace fluids lost during exercise but with an increase of carbohydrate. |
| Hypertonic | Hypertonic drinks have a higher concentration of salt and sugar than the human body. They are best drunk after exercise as it is important to replace glycogen levels quickly after exercise. |
| Hypotonic | Hypotonic drinks are designed to quickly replace fluids lost during exercise. They have very low carbohydrate content and a lower concentration of salt and sugar than the human body. |
| Electrolyte-Enhanced Water | Electrolyte water is water infused with electrically-charged minerals, such as sodium, potassium, calcium, and magnesium. |
| Protein-based Sport Drinks | Protein-based sports drinks are those sports drinks which has added protein in it that will improve performance and reduce muscle protein breakdown. |
| On-Trade | The on-trade refers to places that sell beverages for immediate consumption on the premises like bars, restaurants, and pubs |
| Off-Trade | Off-trade usually means places like liquor stores, supermarkets and other places where you don't consume the beverage right away. |
| Convenience Store | A retail business that provides the public with a convenient location to quickly purchase a wide variety of consumable products and services, generally food and gasoline. |
| Specialty store | A specialty store is a shop/store that carries a deep assortment of brands, styles, or models within a relatively narrow category of goods |
| Online Retail | Online retail is a type of eCommerce whereby a business sells goods or services directly to consumers from a website. |
| Aseptic Packaging | Aseptic packaging refers to the filling of a cold, commercially sterile product under sterile conditions into a presterilized container and closure under sterile conditions to form a seal that effectively excludes microorganisms. These includes tetra packs, cartons, pouches etc. |
| PET Bottle | PET bottle means a bottle made of polyethylene terephthalate. |
| Metal Cans | Metal containers made of aluminum or tin- plated or zinc-plated steel, which are commonly used for packaging food, beverages or other products. |
| Disposable Cups | Disposable Cup means a cup or other container designed for single use to serve beverages, such as water, cold drinks, hot drinks and alcoholic beverages. |
| Gen Z | A way of referring to the group of people who were born in the late 1990s and early 2000s. |
| Millenial | Anyone born between 1981 and 1996 (ages 23 to 38 in 2019) is considered a Millennial |
| Taurine | Taurine is an amino acid that supports immune health and nervous system function. |
| Bars & Pubs | It is a drinking establishment licensed to serve alcoholic drinks for consumption on the premises. |
| Café | It is a foodservice establishment serving refreshments (mainly coffee) and light meals. |
| On the go | It means doing / dealing with while busily engaged with something and not diverting plans in order to accommodate. |
| Internet Penetration | The Internet Penetration Rate corresponds to the percentage of the total population of a given country or region that uses the Internet. |
| Vending Machine | A machine that dispenses small articles such as food, drinks, or cigarettes when a coin or token is inserted |
| Discount store | A discount store or discounter offers a retail format in which products are sold at prices that are in principle lower than an actual or supposed "full retail price". Discounters rely on bulk purchasing and efficient distribution to keep down costs. |
| Clean Label | Clean label on the beverage market are drinks that are made from few ingredients of natural origin and are not or only slightly processed. |
| Caffeine | An alkaloid compound which is a stimulant of the central nervous system. It is mainly used recreationally, as a mild cognitive enhancer to increase alertness and attentional performance. |
| Extreme sport | Action sports, adventure sports or extreme sports are activities perceived as involving a high degree of risk. |
| High-intensity interval training | It incorporates several rounds that alternate between several minutes of high intensity movements to significantly increase the heart rate to at least 80% of one's maximum heart rate, followed by short periods of lower intensity movements. |
| Shelf life | The length of time for which an item remains usable, fit for consumption, or saleable. |
| Cream Soda | Cream soda is a sweet soft drink. Generally flavored with vanilla and based on the taste of an ice cream float |
| Root Beer | Root beer is a sweet North American soft drink traditionally made using the root bark of the sassafras tree Sassafras albidum or the vine of Smilax ornata as the primary flavor. Root beer is typically, but not exclusively, non-alcoholic, caffeine-free, sweet, and carbonated. |
| Vanilla Soda | A carbonated soft drink flavoured with vanilla. |
| Dairy-Free | A product that does not contain any milk or milk products from cows, sheep or goats. |
| Caffeine-Free Energy Drinks | Caffeine-free energy drinks rely on other ingredients to boost the energy. Popular choices include amino acids, B vitamins, and electrolytes. |


Research Methodology
Mordor Intelligence follows a four-step methodology in all our reports.
- Step-1: IDENTIFY KEY VARIABLES: In order to build a robust forecasting methodology, the variables and factors identified in Step 1 are tested against available historical market numbers. Through an iterative process, the variables required for market forecast are set, and the model is built on the basis of these variables.
- Step-2: Build a Market Model: Market-size estimations for the forecast years are in nominal terms. Inflation is not a part of the pricing, and the average selling price (ASP) is kept constant throughout the forecast period for each country.
- Step-3: Validate and Finalize: In this important step, all market numbers, variables, and analyst calls are validated through an extensive network of primary research experts from the market studied. The respondents are selected across levels and functions to generate a holistic picture of the market studied.
- Step-4: Research Outputs: Syndicated reports, custom consulting assignments, databases & subscription platforms


