
Market Overview
| Study Period | 2021 - 2031 |
|---|---|
| Market Size (2026) | USD 4.53 Billion |
| Market Size (2031) | USD 6.81 Billion |
| Growth Rate (2026 - 2031) | 8.50 % |
| Fastest Growing Market | Asia Pacific |
| Largest Market | North America |
| Market Concentration | Medium |
Major Players *Disclaimer: Major Players sorted in no particular order Image © Mordor Intelligence. Reuse requires attribution under CC BY 4.0. | |
Energy Bar Market Analysis by Mordor Intelligence
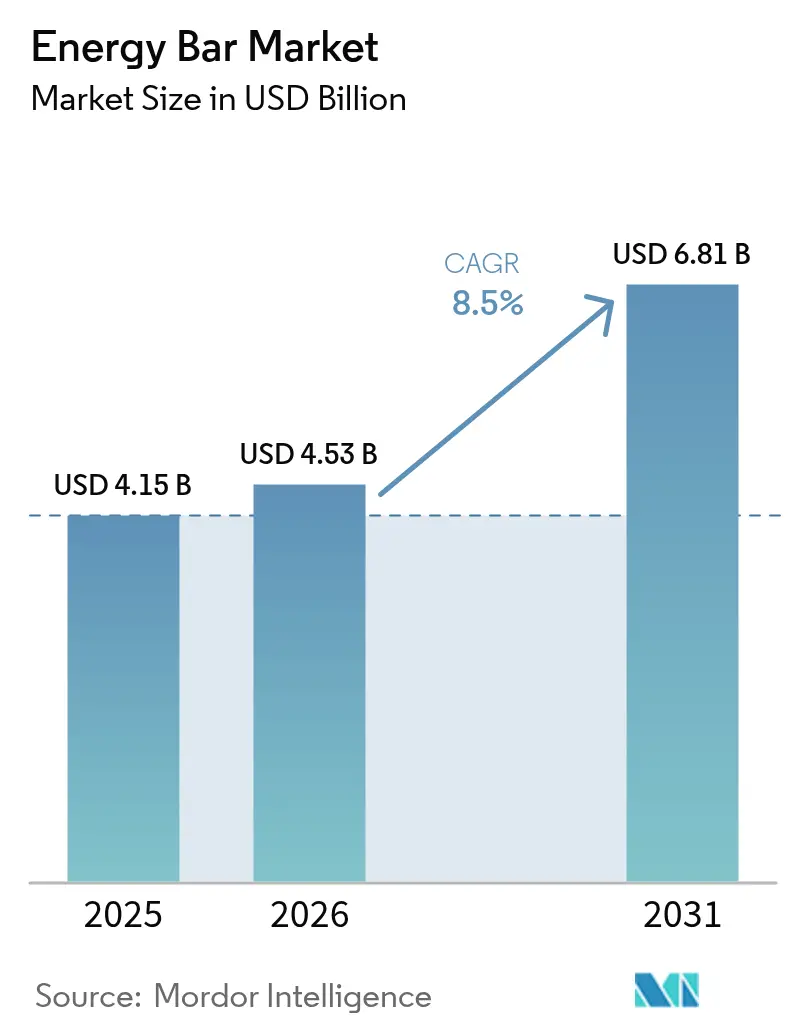
The energy bar market size was valued at USD 4.15 billion in 2025, is projected to reach USD 4.53 billion in 2026, and grow significantly to USD 6.81 billion by 2031, registering a strong CAGR of 8.50% from 2026 to 2031. Conventional formulations are expected to dominate revenue in 2025, but organic and plant-based options are gaining traction. This growth is influenced by the demand for clean-label certifications, advancements in personalized nutrition, and the increasing popularity of e-commerce subscriptions, which are reshaping consumer preferences. Manufacturers are facing challenges due to fluctuating prices of key commodities like cocoa, whey, and almonds. To mitigate these risks, they are adopting strategies such as ingredient hedging, diversifying protein sources, and pursuing vertical integration. Regulatory developments are also playing a significant role, with approvals for novel proteins and designations for next-generation sweeteners driving product reformulations. These efforts focus on reducing sugar content, improving amino-acid profiles, and supporting claims like Keto and Paleo. Geographically, growth patterns vary. While North America and Europe hold the largest market shares, the Asia-Pacific region is experiencing the fastest growth, driven by rising gym memberships and the expansion of modern retail channels.
Key Report Takeaways
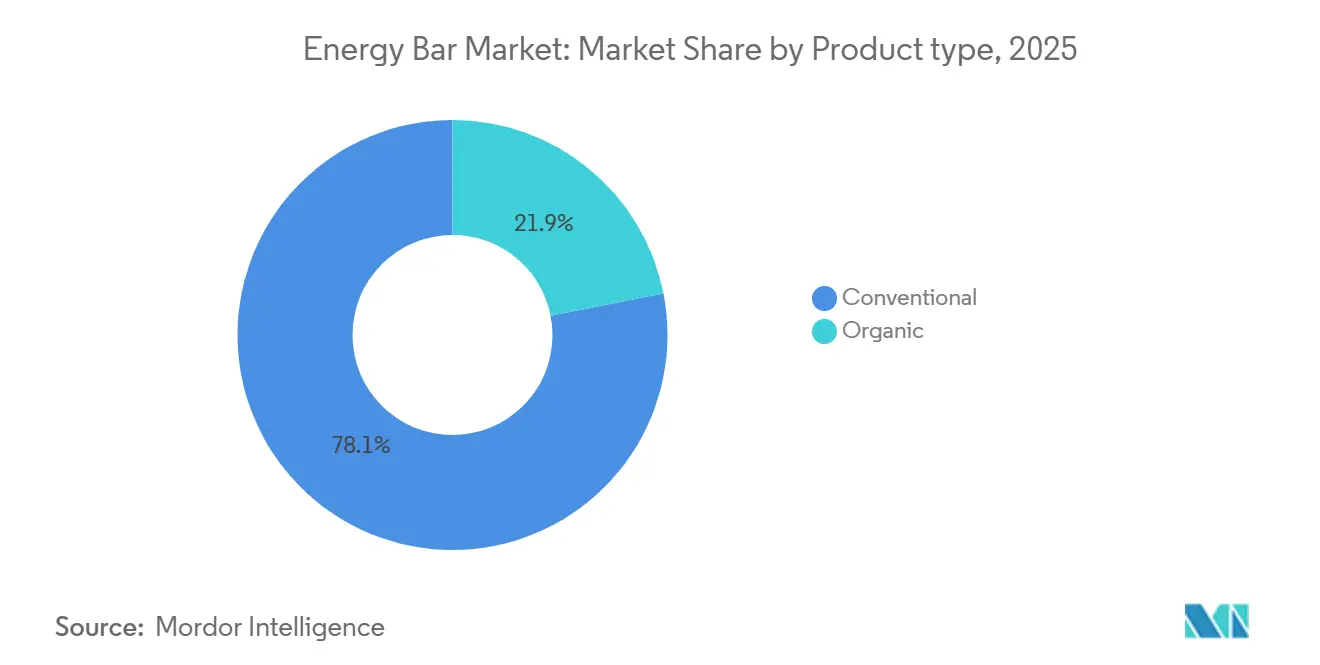
- By product type, in 2025, conventional bar dominated the energy bars market with a 78.09% share, while organic bars are projected to grow at an 8.59% CAGR from 2026 to 2031.
- By protein source, plant-based formats made up 54.24% of 2025 revenue, while animal-based bars, driven by whey and collagen, are expected to see an 8.80% CAGR growth through 2031.
- By function/application, sports and endurance nutrition accounted for 78.16% of 2025 sales, but weight-management and lifestyle-energy bars are on track to grow at a 9.17% CAGR until 2031.
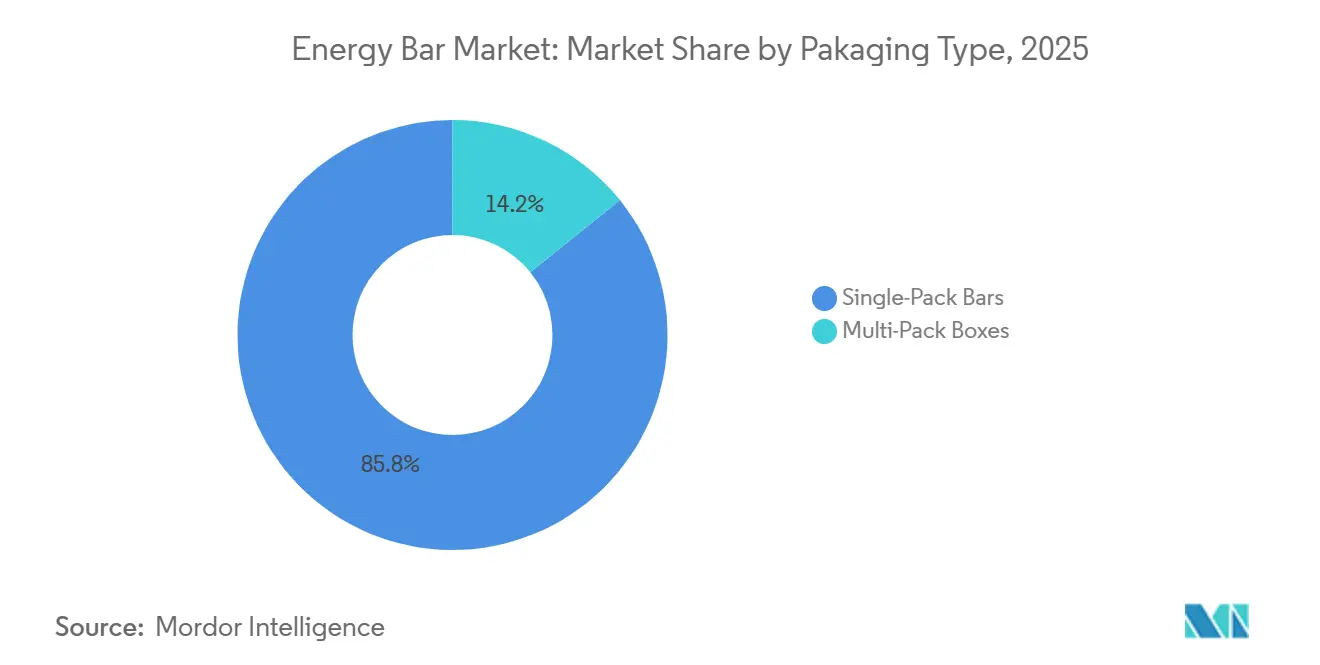
- By packaging, single-pack units took 53.21% of 2025 volume, while multi-pack boxes, boosted by online subscriptions, are projected to grow at an 8.81% CAGR from 2026 to 2031.
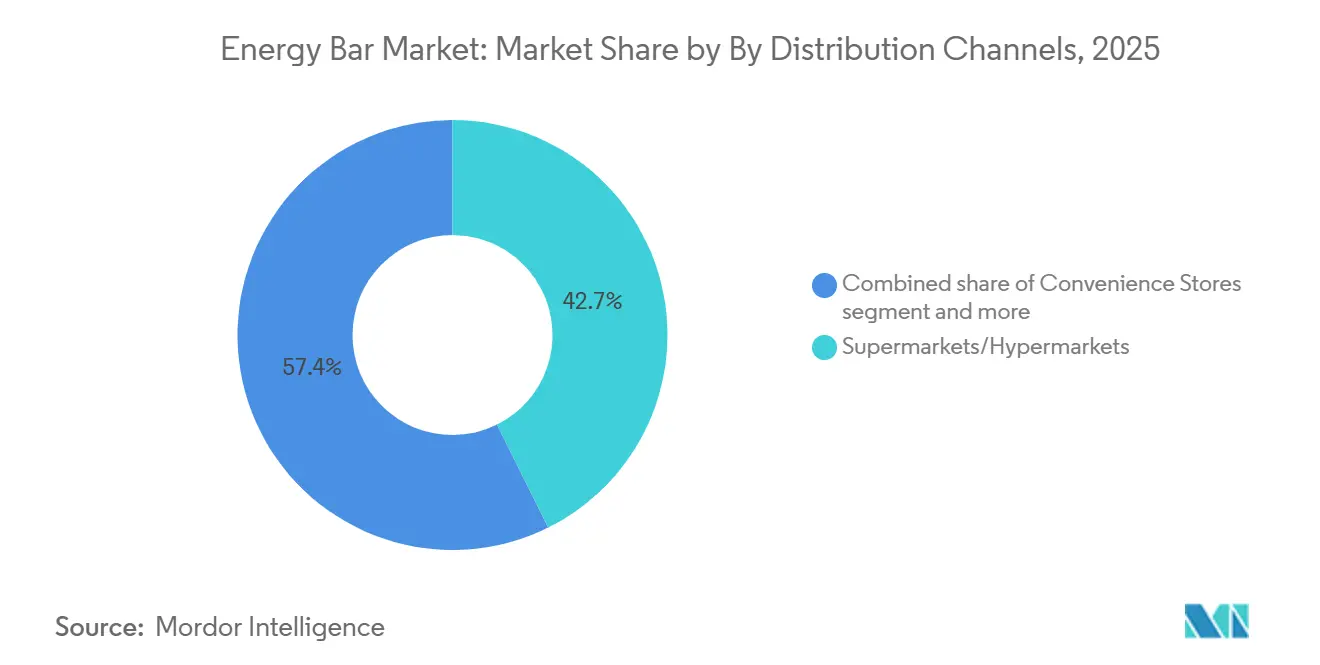
- By distribution, supermarkets/hypermarkets secured 42.65% of 2025 revenues, but online retail is set to surge with a 9.97% CAGR as direct-to-consumer brands sidestep shelf fees.
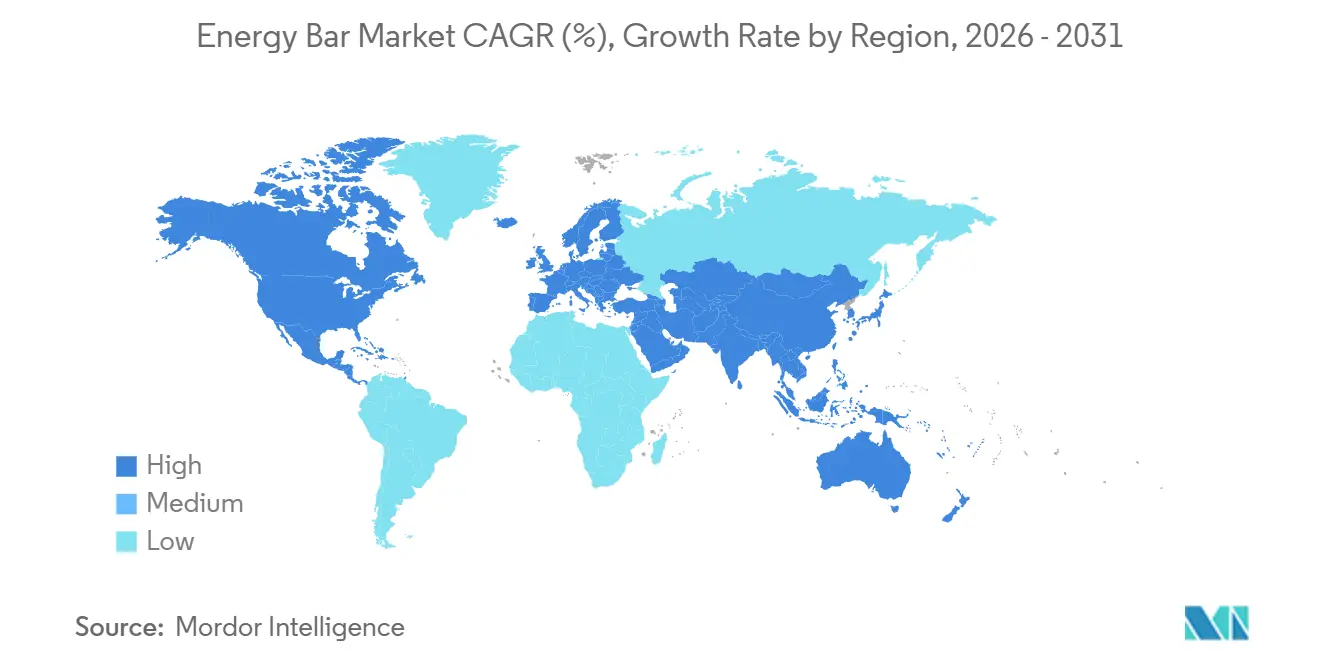
- Geographically, North America represented 41.92% of 2025's market value, while Asia-Pacific is anticipated to grow at a 9.01% CAGR through 2031.
Note: Market size and forecast figures in this report are generated using Mordor Intelligence’s proprietary estimation framework, updated with the latest available data and insights as of 2026.
Market Trends and Insights
Drivers Impact Analysis of Energy Bar Market*
| Driver | (~) % Impact on CAGR Forecast | Geographic Relevance | Impact Timeline |
|---|---|---|---|
| Growing demand for convenient on-the-go nutrition | +1.8% | Global, with urban concentration in North America, Europe, and Asia-Pacific megacities | Short term (≤ 2 years) |
| Expansion of fitness culture in emerging markets | +1.5% | Asia-Pacific core (India, China, Southeast Asia), spill-over to Latin America and Middle East | Medium term (2-4 years) |
| Growth of plant-based and vegan energy bars | +1.3% | North America and Europe lead, Asia-Pacific accelerating due to lactose intolerance and environmental awareness | Medium term (2-4 years) |
| Sugar reduction enabled by next-gen sweetener-based launches | +1.0% | Global, with regulatory tailwinds in EU (EFSA approvals) and North America (FDA GRAS designations) | Short term (≤ 2 years) |
| Product innovation and functional ingredients incorporation | +1.2% | North America innovation hub, Europe clean-label focus, Asia-Pacific adoption of traditional botanicals | Medium term (2-4 years) |
| Premiumization and specialized positioning | +0.9% | North America and Europe affluent segments, emerging in Asia-Pacific urban centers | Long term (≥ 4 years) |
| Source: Mordor Intelligence | |||
Growing demand for convenient on-the-go nutrition
Urbanization and busier meal schedules are changing the way people snack. More consumers now prefer portable snacks that help boost energy and improve focus. Among working-age adults, skipping meals has increased the demand for nutrient-rich bars that combine protein and fiber. The rise of remote work has further disrupted traditional meal patterns, prompting brands to market these bars as practical choices for breakfast or mid-afternoon snacks. Americans are increasingly replacing traditional meals with snacks or smaller portions, a trend that continues to grow. In 2020, 38% of people reported substituting meals with snacks or smaller meals. By 2024, this figure rose to 56%, and it is expected to reach 62% in 2025[1]. Packaging innovations, such as resealable films and portion-control features, cater to the need for convenience while ensuring transparency about nutritional information.
Expansion of fitness culture in emerging markets
The expansion of fitness culture in emerging markets is becoming increasingly evident, driven by growing awareness of health and wellness. This trend is reflected in the rising participation in organized athletic events, such as marathons and relays, which have seen significant growth in recent years. For instance, the 2025 Manchester Marathon attracted 36,000 participants and hosted the England Marathon Championships, showcasing the increasing popularity of endurance sports[2]. The shift toward active lifestyles is not only about individual fitness goals but also about fostering community engagement and collective motivation. Events like the Road Relays further highlight the role of teamwork and camaraderie in promoting fitness culture. This growing emphasis on healthier living presents opportunities for businesses in the fitness and wellness industry to cater to the evolving demands of this expanding market segment.
Growth of plant based and vegan energy bars
Plant based protein sources are gaining prominence in the energy bar market, driven by increasing consumer awareness of animal welfare, environmental sustainability, and lactose intolerance. Ingredients such as pea protein, rice protein, and soy isolates are being blended with chia seeds, hemp hearts, and cricket protein to create amino-acid profiles comparable to whey-based formulations. This segment is further supported by regulatory approvals that allow the use of innovative plant-based proteins in cereal bars, enabling manufacturers to achieve creamy textures without relying on dairy. Flexitarian consumers those who reduce but do not entirely eliminate animal products are an important target group. They value taste and texture over strict vegan labeling, encouraging brands to focus on sensory optimization and secure third-party non-GMO certifications. Additionally, allergen-free positioning is driving growth, as nut-free and gluten-free claims facilitate distribution in schools, hospitals, and airlines, where cross-contamination risks limit traditional bar options.
Sugar reduction enabled by next gen sweetener based launches
The energy bar market is undergoing a significant transformation as sugar reduction becomes a primary focus, driven by the adoption of next-generation sweeteners. With increasing consumer demand for healthier and functional snack options, manufacturers are incorporating innovative sweeteners such as aspartame, sucralose, and stevia-derived compounds into their formulations. These sweeteners, known for their intense sweetness compared to traditional sugar, allow producers to reduce sugar content while maintaining the desired taste and texture of energy bars[3]. Additionally, their low-calorie profile and minimal impact on blood sugar levels appeal to health-conscious consumers and those with specific dietary needs, further driving their adoption in the market. For instance, on April 28, 2025, Trek, a UK-based protein bar brand, introduced a new range of high-protein, low-sugar bars. This launch aligns with the sugar reduction trend in the energy bar market and addresses the rising demand for healthier snacking options. By leveraging next-generation sweeteners, Trek delivers reduced sugar content without compromising taste, demonstrating its commitment to innovation and setting a new benchmark in the sports nutrition category.
Restraints Impact Analysis of Energy Bar Market*
| RESTRAINT | (~) % IMPACT ON CAGR FORECAST | GEOGRAPHIC RELEVANCE | IMPACT TIMELINE |
|---|---|---|---|
| Intensifying competition from alternative snacks | -0.7% | Global, with pronounced effects in North America where snack innovation is highest | Short term (≤ 2 years) |
| Commodity price volatility in proteins and nuts | -0.9% | Global, with acute pressure in cocoa-dependent formulations (West Africa supply shocks) and almond-reliant bars (California drought cycles) | Short term (≤ 2 years) |
| Sustainability concerns over single-use wrappers | -0.5% | Europe (EU PPWR mandates), North America (state-level plastic bans), Asia-Pacific (emerging regulations) | Medium term (2-4 years) |
| Clean-label scrutiny limiting functional additives | -0.6% | North America and Europe, where consumer advocacy and regulatory oversight are most stringent | Medium term (2-4 years) |
| Source: Mordor Intelligence | |||
Intensifying competition from alternative snacks
Energy bars face substitution pressure from protein chips, meat jerky, ready-to-drink protein shakes, and nut-butter pouches, as consumers continue to diversify their snacking portfolios. Jerky brands such as Jack Link's and Chomps have introduced grass-fed and organic variants that offer high protein content with minimal processing, appealing to paleo and carnivore-diet adherents who often perceive bars as overly processed. RTD shakes provide superior convenience no chewing required and brands like Fairlife and Premier Protein have secured refrigerated shelf space in convenience stores and gas stations, capturing impulse purchases that traditionally favored bars. Protein chips from Quest and PopCorners provide savory alternatives that satisfy cravings for crunch and salt, a sensory profile that sweet or neutral bars cannot replicate. This fragmentation impacts category growth, as retailers allocate limited shelf space across multiple snack formats, and digital advertising costs increase as brands compete for the same consumer attention. The competitive intensity is further heightened by private-label entrants that leverage retailer data to identify fast-moving SKUs and launch similar products at lower prices.
Commodity price volatility in proteins and nuts
Cocoa prices have recently declined as manufacturers, facing rising costs and tighter profit margins, have reduced their industrial demand. On the supply side, cocoa production is expected to increase during the 2025/2026 season, driven by favorable weather conditions and the maturation of newly planted cocoa trees in Ecuador. Despite the current price drop, industry projections suggest that cocoa prices may remain elevated, hovering around USD 6,000 per tonne. This sustained price level could result in higher confectionery prices, which may, in turn, impact sales volumes negatively. Similarly, the prices of whey protein concentrate and isolate have experienced fluctuations, largely influenced by shifts in the dairy market. Key factors contributing to this variability include the European Union's milk-production quotas and New Zealand's export volumes, both of which have created uncertainties on the supply side.
*Our forecasts treat driver/restraint impacts as directional, not additive. The impact forecasts reflect baseline growth, mix effects, and variable interactions.
Energy Bar Market Segment Analysis
By Product Type:
Organic Bars Gain Despite Conventional DominanceIn 2025, conventional energy bars accounted for 78.09% of the market revenue, supported by their extensive distribution networks, affordable pricing, and a broad range of flavors. These factors made them a popular choice among mass-market consumers who prioritize taste and cost over ingredient sourcing. Additionally, conventional bars continue to dominate in impulse-buy locations like gas stations, vending machines, and checkout aisles, where affordability and immediate energy needs drive purchasing decisions.
Organic energy bars are projected to grow at an impressive CAGR of 8.59% through 2031, outpacing the overall market. This growth is driven by rising demand from health-conscious consumers seeking USDA Organic and Non-GMO Project Verified certifications, which ensure pesticide-free ingredients and sustainable farming practices. While organic bars carry a price premium, these higher costs are justified by transparent supply chains, third-party audits, and marketing that highlights environmental and social benefits. Organic bars are also gaining momentum in natural-channel retailers like Whole Foods and Sprouts, where they represent a significant portion of total bar sales compared to conventional supermarkets.
By Protein Source:
Plant-Based Leads, Animal-Based AcceleratesIn 2025, plant-based protein sources dominated the market, accounting for 54.24% of the revenue. This growth was driven by the rising popularity of flexitarian diets, increasing environmental awareness, and the prevalence of lactose intolerance, which affects a significant portion of the global population. Key ingredients such as pea protein, soy isolate, and rice protein are often combined to create amino-acid profiles comparable to whey. Additionally, brands are exploring ingredients like chia seeds, hemp hearts, and cricket protein to stand out, although insect-based options face regulatory and consumer acceptance challenges. Plant-based bars are particularly successful in regions like Asia-Pacific, where vegetarianism is culturally ingrained, and Europe, where environmental regulations encourage sustainable product development.
Animal-based protein bars are emerging as the fastest-growing segment, with a projected 8.80% CAGR has slightly exceeds the overall market growth. This expansion is fueled by demand from endurance athletes and aging consumers who value the benefits of whey protein for muscle recovery and collagen peptides for joint health. Whey remains the preferred choice for post-workout recovery due to its rapid digestion and high bioavailability, a standard that plant proteins continue to strive toward. Collagen-infused bars are gaining traction as a hybrid category, addressing skin, bone, and connective tissue health, with brands like Vital Proteins and Ancient Nutrition leading innovation. The segment also benefits from clean-label trends emphasizing grass-fed and pasture-raised sourcing, which appeal to health-conscious consumers. However, regulatory compliance remains a key focus, as EFSA and FDA closely monitor health claims and labeling accuracy in this space.
By Function:
Weight Management Outpaces Sports NutritionSports and endurance nutrition bars dominate the market, capturing a significant share of 78.16%. This stronghold is driven by consistent demand from gym-goers, runners, and cyclists who prioritize products with balanced protein, carbohydrates, and electrolytes for hydration and recovery. Leading brands like Clif Bar, PowerBar, and Gatorade maintain their position through strategic sponsorships of marathons, triathlons, and professional sports leagues, which enhance brand equity and justify premium pricing. The segment also benefits from boutique fitness studios, such as CrossFit, Orangetheory, and Barry's Bootcamp, which sell these bars at their locations, targeting consumers immediately post-workout. However, the segment faces challenges as growth slows due to market maturity and rising competition from alternatives like ready-to-drink protein shakes and amino-acid supplements.
Weight-management and lifestyle-energy bars are the fastest-growing segment, with a projected CAGR of 9.17% through 2031. Their popularity stems from their appeal as meal replacements for busy professionals, shift workers, and parents balancing multiple responsibilities. These bars are designed to provide satiety and stabilize blood sugar, making them suitable as breakfast or lunch substitutes rather than snacks. Brands such as SlimFast, Atkins, and Zone Perfect have shifted their focus from diet-specific messaging to broader wellness themes, emphasizing balanced macronutrients and sustained energy. This repositioning has helped reduce the stigma associated with weight-loss products. Additionally, these bars are gaining traction in corporate wellness programs, where employers subsidize healthy snacks to promote employee well-being. Despite their growth, regulatory scrutiny remains a challenge, with the FDA and EFSA imposing strict guidelines on nutrient thresholds and calorie-reduction claims.
By Packaging Type:
Multi-Pack Growth Reflects E-Commerce ShiftSingle-pack bars accounted for 53.21% of the market in 2025, highlighting their dominance in convenience-driven retail spaces. These bars are a go-to choice for consumers making quick, impulse purchases at convenience stores, gas stations, and checkout aisles. Their popularity is further cemented by their strong presence in vending machines, gyms, and airports, where portability and portion control are essential. The convenience and accessibility of single-serve packaging ensure its continued leadership in these high-traffic, on-the-go channels.
Multi-pack boxes are positioned as the fastest-growing segment, with a projected CAGR of 8.81% through 2031. This growth is fueled by the rising adoption of e-commerce subscriptions, the expansion of warehouse-club retailers, and the increasing trend of stocking household pantries. These shifts, which gained traction during the pandemic, have become more entrenched as remote work normalizes. Multi-packs attract budget-conscious families and frequent consumers by offering cost savings and variety. Additionally, advancements in packaging, such as variety packs and sustainable materials, are helping brands cater to environmentally conscious shoppers while enhancing convenience and value.
By Distribution Channels:
Online Retail Disrupts Traditional Shelf SpaceSupermarkets/hypermarkets dominated the distribution market in 2025, holding a 42.65% share. Their leadership is driven by their extensive reach, ability to attract large volumes of customers, and impactful promotional strategies. These retailers effectively use techniques like prominent product placements and special offers to encourage both initial purchases and repeat buying. Additionally, traditional retailers benefit from impulse buying behavior, with strategically placed products near checkout counters prompting last-minute additions to shopping carts. In-store sampling further helps convert curious shoppers into loyal customers, reinforcing their stronghold in the market.
Online retail is the fastest-growing distribution channel, with a compound annual growth rate (CAGR) of 9.97% projected through 2031. This rapid growth is propelled by direct-to-consumer brands that bypass traditional retail costs, employ targeted digital marketing, and offer personalized subscription services to foster customer loyalty. While Amazon remains a dominant player in the online segment, niche platforms are steadily gaining traction. These platforms differentiate themselves by catering to specific dietary preferences and offering bulk purchase options, appealing to a growing base of health-conscious and convenience-driven consumers.

Geography Analysis
North America Energy Bar Market
North America held the largest market share in 2025, contributing 41.92% of the total market value. The United States led the region, driven by its strong consumer demand and innovation in product offerings such as collagen-infused, keto-certified, and low-sugar options. Canada supported this dominance with its robust natural-channel presence, while Mexico's contract-manufacturing capabilities further enhanced the region's position. These combined factors established North America as the global leader in the market.
APAC Energy Bar Market
Asia-Pacific emerged as the fastest-growing region, with a projected compound annual growth rate (CAGR) of 9.01% through 2031. The region's growth was propelled by rising consumer spending and increasing interest in health and wellness. Both global multinationals and domestic companies played a significant role by introducing products tailored to local tastes and preferences. The region's economic progress and shifting consumer behaviors have made it a critical area for market expansion.
EMEA and South America Energy Bar Market
Other regions showcased unique growth opportunities and market dynamics. Europe focused on clean-label and sustainable products, aligning with regulatory directives on nutrient profiling and packaging waste. South America tapped into its wealth of indigenous ingredients, such as açaí and quinoa, to cater to the growing demand for natural and functional products. Meanwhile, the Middle East and Africa expanded its market through halal-certified product offerings and government-supported nutrition programs. While these regions currently trail in market share and growth rate, their localized strategies and supportive policies indicate promising potential for future development.
Regulatory Landscape
Energy bars sold as packaged foods must comply with nutrition labeling and claims rules that shape formulation and on-pack messaging. In the United States, FDA nutrition labeling requirements under 21 CFR 101.9 set the baseline for Nutrition Facts disclosures, while FDA work on front-of-package (FOP) nutrition labeling and broader 2026 food safety and nutrition priorities increases scrutiny on ingredient safety determinations and substantiation for nutrient-forward positioning. A key claims anchor is the FDA final rule updating the implied nutrient content claim "healthy" (issued December 2024), which became effective February 25, 2025 and sets a February 25, 2028 compliance date, creating a defined window for reformulation and label updates across bars marketed for wellness, weight management, and lifestyle energy.
In the European Union, Regulation (EU) No 1169/2011 governs mandatory nutrition declarations (including energy, fat, saturates, carbohydrate, sugars, protein, and salt), and the European Commission is assessing changes to the Food Information to Consumers framework, including a push toward harmonized FOP nutrition labeling. This direction, alongside ongoing legislative activity in the United States such as H.R. 8385 (Food Labeling Modernization Act of 2026), which proposes standardized interpretive nutrition information, adds execution complexity for global brands. It drives separate label artwork, claim vetting, and, in some cases, sugar and sweetener reformulation to match regional label and claims expectations.
Competitive Landscape
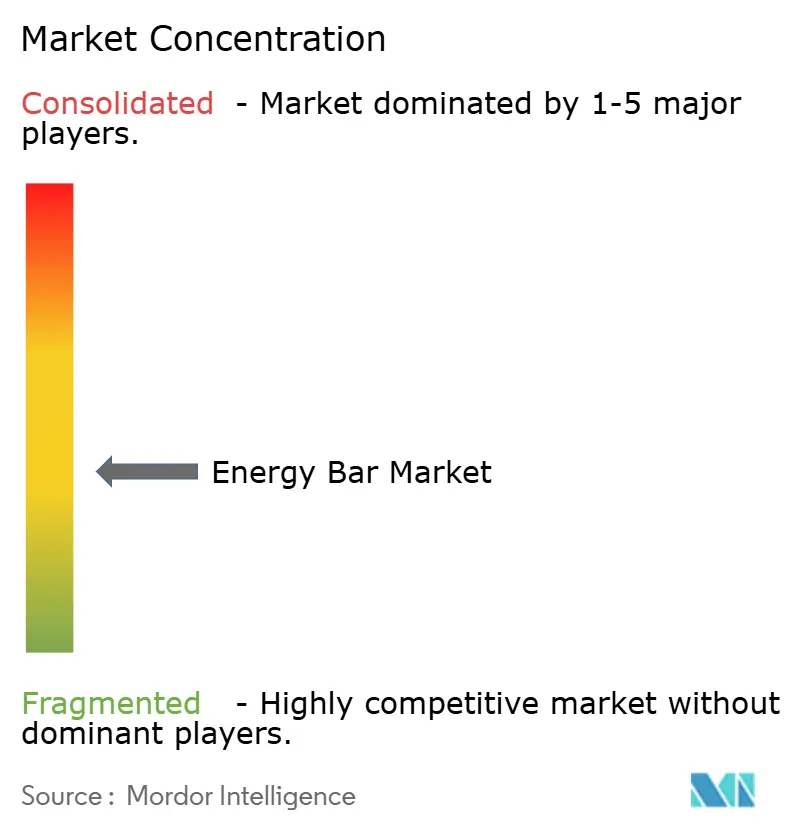
The energy bar market is moderately fragmented. Large multinational companies like Mars, Mondelez, Nestlé, General Mills, and PepsiCo dominate the market, competing alongside smaller, specialized players such as Simply Good Foods (Quest, Atkins, OWYN), Glanbia (ThinkThin, Amazing Grass), and Built Brands. This competitive environment allows niche players to find opportunities by focusing on direct-to-consumer channels, personalized nutrition, and unique ingredient offerings. Simply Good Foods and Glanbia are examples of companies leveraging these strategies to strengthen their market presence, with premiumization trends driving consumer demand for clean-label and certified products.
Technological advancements are transforming the energy bar market, enabling brands to connect with consumers in innovative ways and improve operational efficiency. Augmented-reality packaging is being used to provide interactive content like recipe videos and workout tutorials, while blockchain technology ensures transparency by tracing ingredients back to their sources. Predictive analytics is helping brands manage inventory more effectively across online and physical stores. Smaller brands like FITCRUNCH are disrupting the market by using influencer collaborations, exclusive product launches, and targeted digital advertising to compete with larger players.
Opportunities in personalized nutrition are expanding as artificial intelligence enables brands to create customized products tailored to individual needs. AI-driven platforms can analyze biometric data to recommend specific macronutrient combinations, offering consumers a more personalized experience. Subscription models that include auto-replenishment and flavor customization are also gaining popularity, helping brands reduce customer-acquisition costs and build long-term loyalty. Regulatory frameworks, such as FDA and EFSA guidelines, ensure that product claims are backed by evidence, fostering trust and transparency. As technology adoption grows, companies that embrace these innovations are better positioned to meet changing consumer preferences and drive sustainable growth in the market.
Energy Bar Industry Leaders
-
General Mills Inc.
-
Mars Inc.
-
Nestlé S.A.
-
Mondelez International Inc.
-
Post Holdings, Inc.
- *Disclaimer: Major Players sorted in no particular order
Energy Bar Market Companies Covered in this Report
- Mars, Inc.
- Mondelez International, Inc.
- General Mills, Inc.
- Nestle S.A.
- Post Holdings, Inc.
- Glanbia plc
- Abbott Laboratories
- The Hershey Company
- PepsiCo, Inc.
- Lotus Bakeries
- The Simply Good Foods Company
- Otsuka Holdings Co., Ltd.
- Wholesome Habits Pvt. Ltd.
- Munk Pack, Inc.
- The Hain Celestial Group, Inc.
- Pure Protein, LLC
- NuGo Nutrition, Inc.
- Built Brands, LLC
- Ferrero Group
- USANA Health Sciences, Inc.
- FitLife Brands, Inc.
- Kindelicious Foods Private Limited
Market Opportunities and Future Outlook
Capacity build-outs and format diversification are opening room for both incumbents and specialist brands to scale beyond traditional bar SKUs. In the United States, Mars commissioned a USD 240 million Utah facility designed to produce about 1 billion snack bars annually (operations commenced in August 2025). This adds large-scale supply for bar portfolios and increases competitive pressure for brands that depend on constrained co-manufacturing slots. In Europe, Newton Food completed a EUR 3.5 million investment in Lithuania to raise protein bar capacity to 50 million units per year (July 2026), reinforcing the value of regional production hubs for private label and emerging brands seeking consistent throughput and shorter lead times.
Product and packaging innovation is also shifting where differentiation lands, especially in bite-sized formats, layered textures, and waste-reduction packaging concepts. Mondelez International expanded CLIF offerings in March 2026 with new bite-style products alongside limited-edition bars, while GoMacro introduced MacroSquares in June 2026 to compete on texture and format as much as macronutrients. On sustainability-linked packaging, initiatives including Eat Natural using edible wafer paper for fruit bars in the UK (February 2026) and Brawny Bear partnering with Pakka Limited for compostable flexible packaging (August 2024) show active experimentation beyond conventional wrappers. They also point to practical openings for energy bar brands to improve distribution and brand preference as packaging waste restrictions and retailer packaging scorecards tighten.
Recent Industry Developments in Energy Bar Market
- May 2026: General Mills launched LARABAR Protein, a plant-based protein bar line (10-12g protein) in multiple flavors. The extension moves LARABAR beyond simple-ingredient snack bars into higher-protein propositions that compete more directly with mainstream fitness and lifestyle energy bars.
- December 2025: Mars completed its acquisition of Kellanova for USD 35.9 billion, bringing brands including RXBAR into the Mars Snacking portfolio. The combination concentrates scale in global snacking and creates new leverage in manufacturing, distribution, and cross-brand merchandising for bar formats.
- August 2024: Mars announced its plan to acquire Kellanova, outlining a pathway to combine a major global snacking platform with established bar assets. The deal framework signaled intensifying consolidation dynamics among energy and protein bar brands competing for shelf space and promotional budgets.
Energy Bar Market Report Scope and Research Methodology
Market Definition and Coverage
This market covers packaged energy bars sold through retail and online channels, counted as finished consumer products and measured in value terms. It captures demand across everyday snacking and sports-related usage where bars are positioned for energy, satiety, or nutrition support.
Scope exclusions: We exclude homemade bars and bulk ingredient mixes that are not sold as ready-to-eat energy bar products.
Segments Covered in This Report
- By Product Type
- Organic
- Conventional
- By Protein Source
- Plant-Based
- Animal-Based
- By Function/Application
- Sports and Endurance Nutrition
- Meal Replacement
- Weight Management and Lifestyle Energy
- By Packaging Type
- Single-Pack Bars
- Multi-Pack Boxes
- By Distribution Channels
- Supermarkets/Hypermarkets
- Convenience Stores
- Specialty Stores
- Online Retail Stores
- Other Distribution Channels
- By Geography
- North America
- United States
- Canada
- Mexico
- Rest of North America
- Europe
- United Kingdom
- Germany
- France
- Italy
- Spain
- Sweden
- Belgium
- Poland
- Netherlands
- Rest of Europe
- Asia-Pacific
- China
- Japan
- India
- Thailand
- Singapore
- Indonesia
- South Korea
- Australia
- Rest of Asia-Pacific
- South America
- Brazil
- Argentina
- Colombia
- Chile
- Peru
- Rest of South America
- Middle East and Africa
- United Arab Emirates
- South Africa
- Saudi Arabia
- Nigeria
- Egypt
- Morocco
- Turkey
- Rest of Middle East and Africa
- North America
Data Sources, Market Sizing, and Validation
Desk Research
Desk research is used to set the structure of the model and to keep assumptions tied to what can be checked in public information. We typically start with government and official statistics such as USDA and the US Census Bureau series where relevant, along with Eurostat for European retail and consumption indicators. Trade and customs signals are also reviewed through sources such as UN Comtrade, which helps us sanity-check cross-border movement of packaged snack products.
To understand category dynamics, we also refer to sources such as peer-reviewed nutrition and food science journals, food labeling and safety guidance from agencies such as the FDA, and trade association publications that discuss packaged snack trends and claims. Company filings, annual reports, and investor presentations are used to track portfolio focus, geography mix, and channel priorities, and paid subscriptions are used selectively for company financials, news and financials, and patent databases to spot formulation and claims activity. These sources are illustrative only, and many other public references are used for data collection, validation, and clarification during the study.
Primary Interviews and Surveys
Primary work is used to test what the desk sources cannot answer cleanly, especially around channel splits, pricing moves, and how energy bars are defined at shelf level in different countries. We speak with participants across manufacturing, distribution, and retail, and we also include category managers and nutrition-focused practitioners so our assumptions reflect real purchase behavior across APAC, EMEA, and the Americas.
Distribution of primary research fieldwork respondents
| Company type | Respondent position | Region |
|---|---|---|
| Top tier: 34% | CXOs: 18% | APAC: 48% |
| Mid tier: 48% | Functional/Unit leaders: 36% | EMEA: 33% |
| Smaller Players: 18% | Managers: 46% | Americas: 19% |
Market-Sizing & Forecasting
The model begins with a top-down build where packaged snack and sports nutrition demand signals are reconstructed by region, and then narrowed to energy bars using category participation and channel availability checks. To keep the total grounded, we corroborate it with selective bottom-up approximations like sampled shelf prices multiplied by estimated volumes for key channels, and then adjust when gaps show up across regions.
Inputs used in the market model include average retail price per bar and price per multipack, the share of sales flowing through supermarkets, convenience, specialty, and online stores, and how organic and conventional bars are positioned in each geography. We also track adoption signals tied to sports and endurance usage, shifts in plant-based versus animal-based protein positioning, and packaging mix (single bars versus multipack boxes) because these change realized pricing and consumption frequency. When data is thin for a country, regional proxies are applied first and then corrected after expert feedback, which helps avoid overstating small markets.
For forecasting, we rely on scenario analysis supported by a simple multivariate regression on the most stable drivers, such as real income trend, modern retail expansion, and expected pricing progression by channel. Final growth paths are reviewed with interview feedback so the forecast reflects both demand drivers and practical shelf and distribution constraints.
Data Validation & Update Cycle
Validation is done by triangulating the model output against independent signals, such as per capita packaged snack spend direction, observed shelf pricing, and channel expansion rates, and then checking whether the results move logically across regions and years. If a segment or country shows a sharp jump, the assumptions are re-checked, the calculation trail is reviewed, and the team re-contacts sources when a single input is driving the swing.
Before sign-off, the numbers go through multi-step analyst reviews where definitions, unit conversions, and currency timing are double-checked for consistency. Reports are refreshed annually, and interim updates are completed when material events occur, such as major labeling shifts or channel disruptions. Right before delivery, we do a final review pass so clients receive the most current view available at that time.
Mordor Intelligence's Energy Bar Market Estimate Compared With Other Published Estimates
Published market sizes for energy bars often do not match because different groups count different product boundaries, use different base years, and apply their own pricing assumptions. Another common reason is that some estimates lean on broad category totals, while others rebuild demand from channel and consumption indicators and then validate the outputs with expert feedback.
The biggest gap drivers for this market usually come from whether adjacent bars are included, how organic and conventional mixes are priced over time, and how online sales are counted when a product is bundled or sold in multipacks. Currency conversion timing can also shift the number in a given year, and refresh cadence matters because pricing and promotional intensity in packaged snacks can change quickly, which then flows into the value estimate.
Benchmark comparison
| Source | Market Size | Gaps in Research Methodology |
|---|---|---|
| Mordor Intelligence | USD 4.53 B (2026) | |
| Global Research Publisher A | USD 6.39 B (2024) | Uses an earlier base year and can reflect a broader shelf interpretation of bar categories, and its value build is more sensitive to assumed average pricing without the same level of channel-by-channel validation. |
| Industry Publisher B | USD 2.50 B (2024) | Leans toward a narrower definition and slower price progression, which can undercount premium sports-focused bars and fast-growing online sales where multipack pricing shifts the realized value. |
The spread in published values is mostly explained by what is counted as an energy bar and how pricing is carried forward across channels and regions. By keeping adjacent bar types out of scope and by updating channel-mix and multipack pricing assumptions during validation, the estimate stays traceable to clear inputs and repeatable steps, which is the approach applied by Mordor Intelligence.
Key Questions Answered in the Report
What is the current size of the energy bars market and its CAGR through 2031?
The energy bars market size stands at USD 4.53 billion in 2026 and is projected to reach USD 6.81 billion by 2031, advancing at an 8.50% CAGR from 2026 to 2031.
Which product type leads category revenues?
Conventional formulations led with 78.09% of 2025 global value, thanks to wide distribution and lower retail prices.
What segment is expected to grow fastest?
Weight-management and lifestyle energy bars are forecast to post the quickest gains with a 9.17% CAGR through 2031.
Why are multi-pack boxes gaining popularity online?
E-commerce subscriptions, variety packs, and 15-25% per-unit savings are shifting households toward pantry-stocking multi-packs.