
Energy As A Service (EaaS) Market Size and Share
Market Overview
| Study Period | 2021 - 2031 |
|---|---|
| Market Size (2026) | USD 119.67 Billion |
| Market Size (2031) | USD 203.74 Billion |
| Growth Rate (2026 - 2031) | 11.23 % |
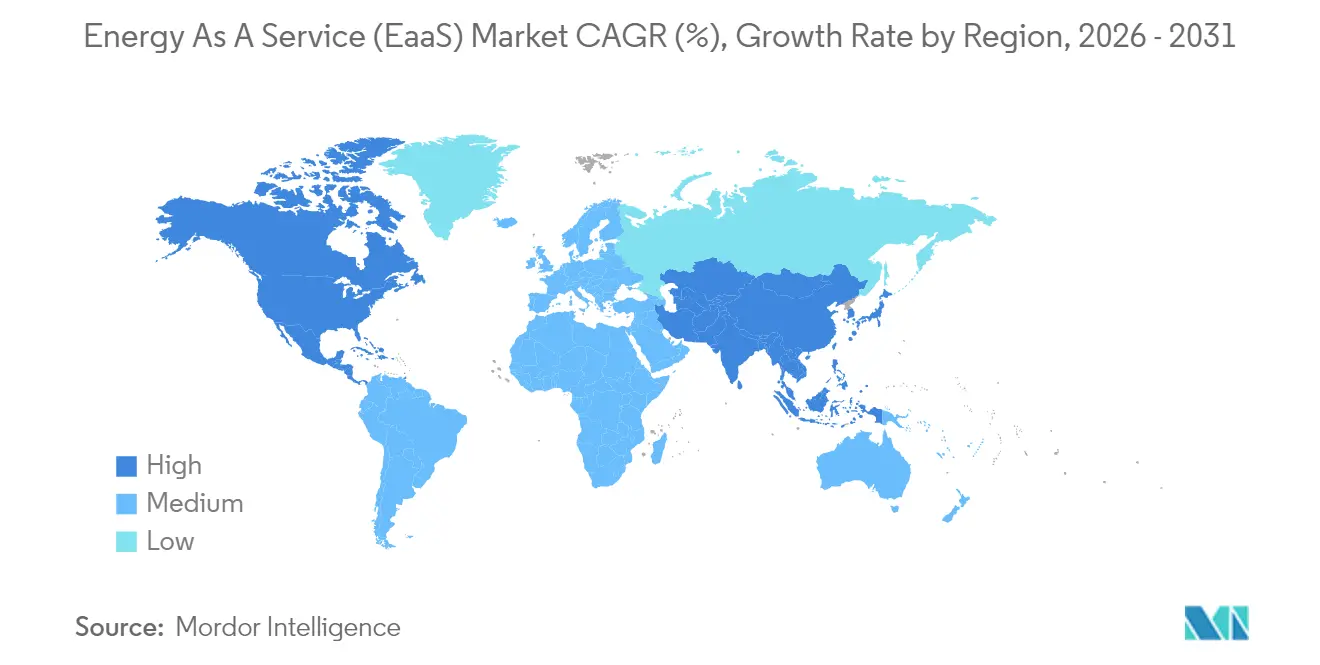
| Fastest Growing Market | Asia Pacific |
| Largest Market | North America |
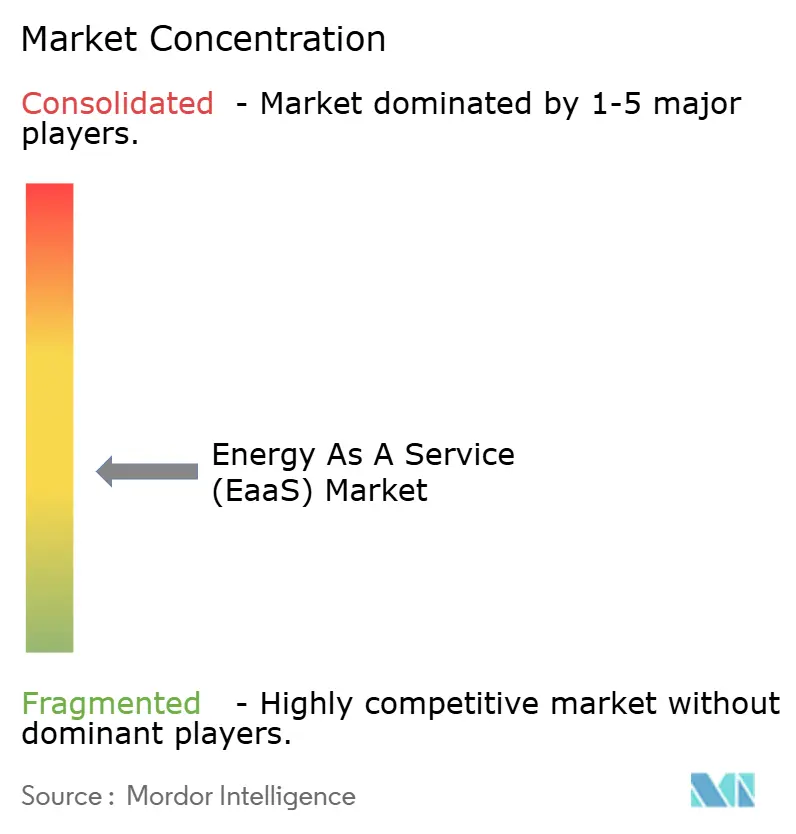
| Market Concentration | Medium |
Major Players *Disclaimer: Major Players sorted in no particular order Image © Mordor Intelligence. Reuse requires attribution under CC BY 4.0. | |
Energy As A Service (EaaS) Market Analysis by Mordor Intelligence
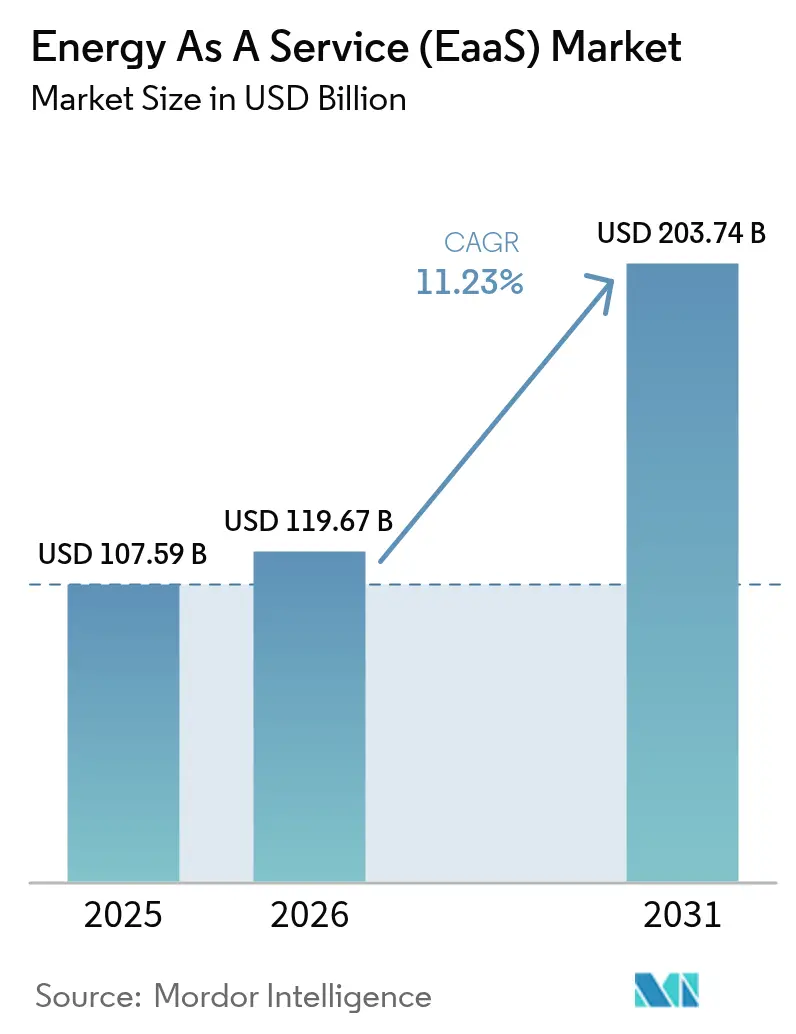
The Energy As A Service Market size was valued at USD 107.59 billion in 2025 and estimated to grow from USD 119.67 billion in 2026 to reach USD 203.74 billion by 2031, at a CAGR of 11.23% during the forecast period (2026-2031).
Corporate decarbonization mandates, grid reliability concerns, and the financial appeal of shifting from capital to operating expenditure models anchor this sustained momentum. Large enterprises are increasingly outsourcing energy procurement, generation, storage, and analytics to avoid upfront investments and secure predictable costs. Policy tailwinds such as the Inflation Reduction Act (IRA) in the United States and comparable green-funding pools across the European Union further improve project economics by layering grants, tax credits, and low-interest financing. Simultaneously, advanced analytics and distributed energy technologies—such as solar PV, battery storage, and intelligent load control—are now bundled into subscription-style contracts that deliver measurable emissions reductions and resiliency benefits.
Key Report Takeaways
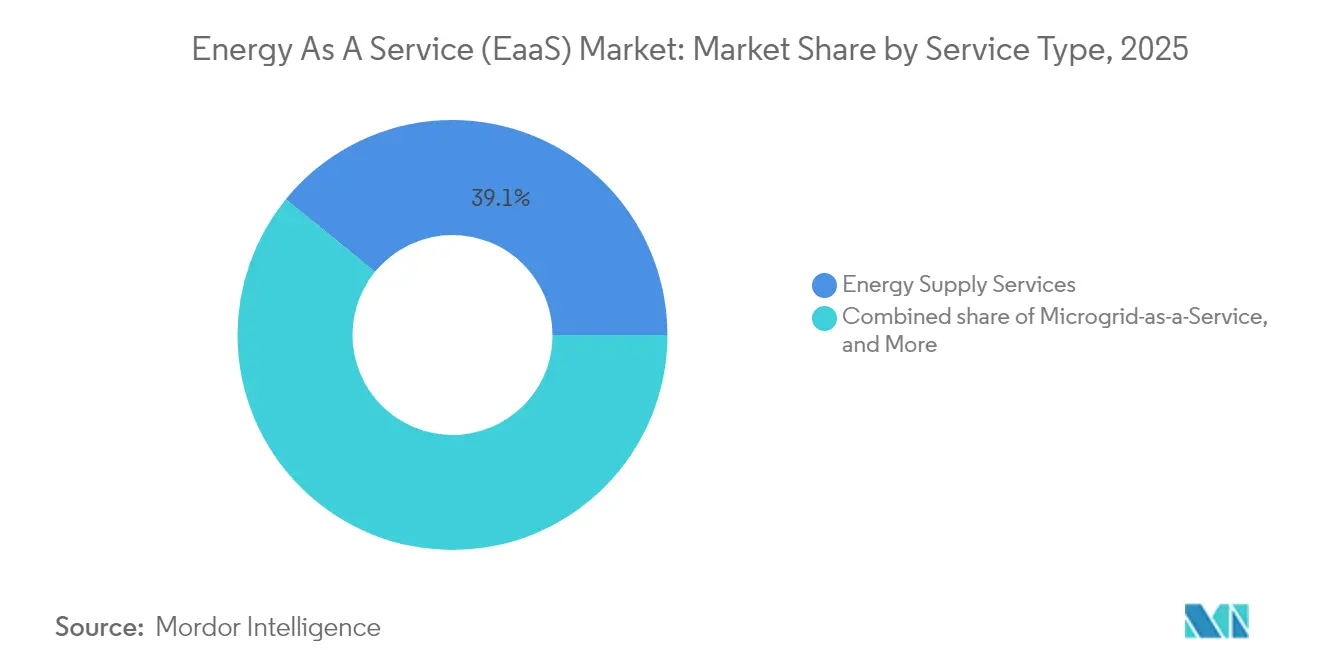
- By service type, Energy Supply Services accounted for 39.12% of global revenue in 2025, while Microgrid-as-a-Service is projected to grow at a 14.05% CAGR through 2031.
- By service-delivery model, Pay-for-Service captured 39.55% of the Energy as a Service market share in 2025; leasing and rental are advancing at an 18.02% CAGR through 2031.
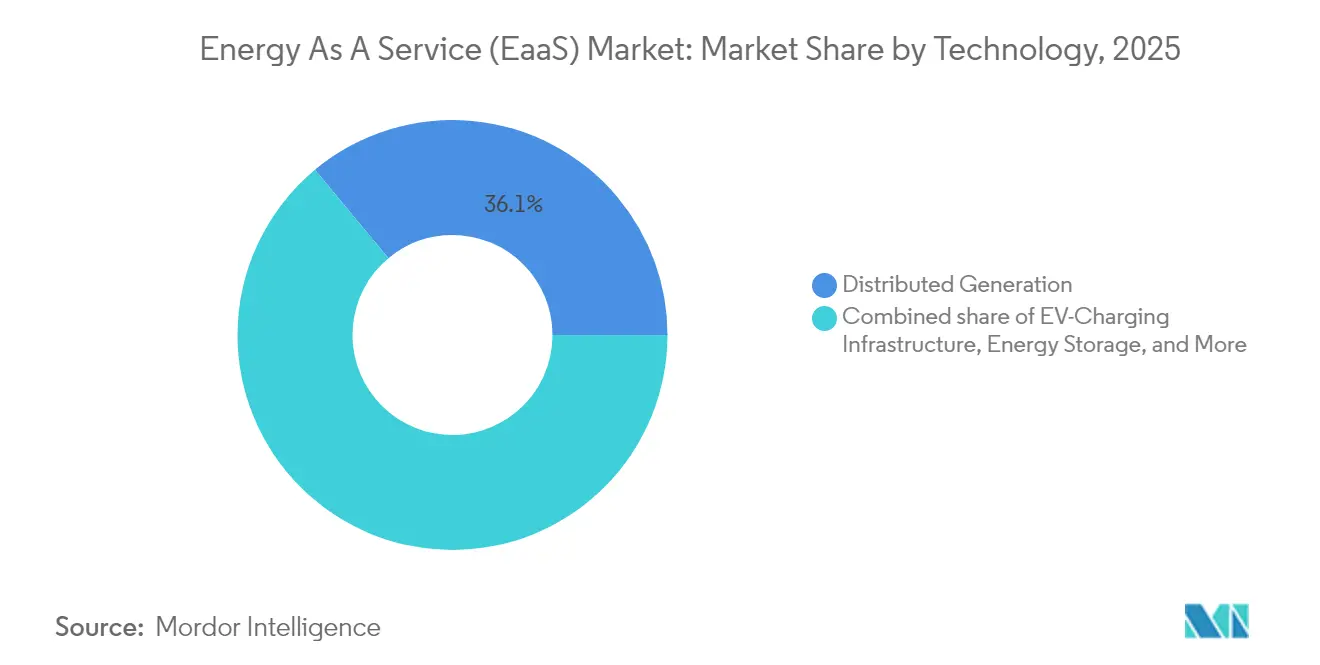
- By technology, Distributed Generation accounted for a 36.05% share of the Energy as a Service market size in 2025, while EV-charging infrastructure is expanding at a 19.74% CAGR through 2031.
- By end user, commercial facilities represented 62.78% of 2025 revenue, whereas industrial customers are forecast to grow at a 13.72% CAGR to 2031.
- By geography, North America led with a 42.18% market share in 2025; the Asia-Pacific region recorded the fastest regional CAGR at 16.32% through 2031.
Note: Market size and forecast figures in this report are generated using Mordor Intelligence’s proprietary estimation framework, updated with the latest available data and insights as of 2026.
Market Trends and Insights
Drivers Impact Analysis of Energy As A Service (EaaS) Market*
| Driver | (~) % Impact on CAGR Forecast | Geographic Relevance | Impact Timeline |
|---|---|---|---|
| Corporate decarbonization mandates & Scope-3 pressure | 2.10% | Global, early uptake in North America & EU | Medium term (2-4 years) |
| Grid volatility driving microgrid adoption | 1.80% | North America & Asia-Pacific, spill-over to Europe | Short term (≤ 2 years) |
| Shift from CAPEX to OPEX in large facilities | 2.30% | Global, strongest in developed markets | Long term (≥ 4 years) |
| AI-driven energy analytics improving ROI | 1.60% | North America & Europe, widening to Asia-Pacific | Medium term (2-4 years) |
| Inflation Reduction Act & kindred green funds | 1.90% | North America with global knock-on | Short term (≤ 2 years) |
| Rise of C&I battery storage services | 1.40% | Global, led by North America & Europe | Medium term (2-4 years) |
| Source: Mordor Intelligence | |||


Corporate Decarbonization Mandates & Scope-3 Pressure
Mandatory greenhouse-gas disclosure rules, such as California’s SB 253, require firms with revenue exceeding USD 1 billion to report Scope 3 emissions starting in 2027, prompting procurement teams to prioritize renewable electricity and verified emissions accounting.[1]California Legislature, “SB 253 Climate Corporate Data Accountability Act,” ca.gov Multinational buyers extend these requirements along their supply chains, amplifying demand for turnkey Energy as a Service market solutions that bundle green power, energy efficiency, and transparent reporting. Financial institutions also factor climate risk into lending decisions, so companies perceive service-based energy contracts as a convenient Energy-as-a-Service market that expands the path to greener balance sheets. Mid-sized enterprises lacking in-house sustainability staff benefit the most, outsourcing both technology selection and monitoring. As disclosure deadlines approach, the addressable customer pool for the Energy as a Service market widens across every major sector.
Grid Volatility Driving Microgrid Adoption
Ageing infrastructure, extreme weather, and data center growth stress legacy grids; the International Energy Agency estimates that 80 million km of power lines will need refurbishment or replacement by 2040.[2]International Energy Agency, “Electricity Grids and Secure Energy Transitions,” iea.org Microgrids mitigate outage risk by allowing critical loads to island and self-supply. Demonstrations funded by the California Energy Commission have shown 20-60% energy cost savings while maintaining uptime during blackouts.[3]California Energy Commission, “EPIC Microgrid Demonstration Results,” energy.ca.gov Corporations now view microgrids not as backup assets, but as integrated components of their facility management strategies, and service providers supply them under multi-year pay-for-performance contracts. Regulatory treatment varies by jurisdiction, yet policy experimentation—such as performance-based tariffs and reduced interconnection fees—continues to unlock new demand pockets for the Energy as a Service market.
Shift from CAPEX to OPEX in Fortune-1000 Facilities
Asset-light finance models resonate with boards seeking to conserve capital for core operations. An industrial conglomerate recently bypassed USD 106 million in upfront spend by retrofitting 1,200 sites via an Energy as a Service agreement that tied payments to documented savings. Manufacturers, retailers, and healthcare chains are replicating this template because operational expenses can be budgeted annually, depreciation can be avoided, and site rollouts can be supported more quickly. Providers respond with guarantees covering performance, maintenance, and technology refresh, cementing the Energy as a Service market as a mainstream procurement option for CFOs.
AI-Driven Energy Analytics Improving ROI
Artificial-intelligence platforms now predict load, detect equipment faults, and optimize dispatch across portfolios in near real-time. The International Energy Agency projects cumulative operational savings of USD 110 billion in global power plants by 2035, resulting from the application of AI. Field deployments cut commercial-building energy use by as much as 19% and lengthen equipment life by one-fifth. Vendors increasingly embed machine-learning engines into edge controllers, making sophisticated analytics affordable for mid-tier facilities. The result is a higher net present value for projects and faster expansion of the Energy as a Service market.
Restraints Impact Analysis of Energy As A Service (EaaS) Market*
| Restraint | (~) % Impact on CAGR Forecast | Geographic Relevance | Impact Timeline |
|---|---|---|---|
| Long-term contract lock-in concerns | -1.20% | Global, acute in developed markets | Long term (≥ 4 years) |
| Cyber-security liabilities on third-party assets | -0.90% | Global, critical-infrastructure focus | Short term (≤ 2 years) |
| Policy uncertainty on behind-the-meter incentives | -1.10% | North America & Europe | Medium term (2-4 years) |
| Inflated WACC on energy infrastructure in emerging economies | -0.80% | Africa & Latin America | Long term (≥ 4 years) |
| Source: Mordor Intelligence | |||
Long-Term Contract Lock-In Concerns
Standard Energy Savings Performance Contracts span 5-20 years, raising anxiety about technology obsolescence and operational flexibility. The U.S. Department of Energy advises rigorous measurement and verification to safeguard customer value and audit readiness.[4]U.S. Department of Energy, “Guidance on Energy Savings Performance Contracts,” energy.gov Service providers are increasingly inserting mid-term upgrade clauses or opt-out windows, but these features can raise pricing. Consequently, risk-averse prospects may delay signing, reducing immediate growth potential for the Energy as a Service market.
Cyber-Security Liabilities on Third-Party Assets
The FBI warns that the speed of renewable energy deployment has exceeded the implementation of cyber defenses, exposing distributed assets to potential attacks. Battery-management systems are especially vulnerable because operational-technology protocols often lack encryption or intrusion detection. Regulatory regimes, such as Europe’s NIS2 directive, impose stricter compliance obligations, increasing costs and complexity for small providers. Although these dynamics create consulting opportunities, they also elevate liability exposure and slow contract negotiations.
*Our forecasts treat driver/restraint impacts as directional, not additive. The impact forecasts reflect baseline growth, mix effects, and variable interactions.
Energy As A Service (EaaS) Market Segment Analysis
By Service Type – Energy Supply Services Retain Leadership While Microgrids Surge
Energy Supply Services generated 39.12% of 2025 turnover, reflecting enterprises’ priority to secure competitively priced, low-carbon electricity without managing complex procurement processes. Within this segment, the Energy as a Service market share advantage stems from bundled power-purchase arrangements, hedging strategies, and management of renewable certificates. Microgrid-as-a-Service is projected to record the fastest 14.05% CAGR through 2031, as hospitals, airports, and manufacturing parks seek island-mode resiliency during grid disturbances. The Energy as a Service market size for microgrids is projected to more than double between 2026 and 2031, supported by falling battery prices and streamlined permitting. Services covering operations & maintenance, as well as lifecycle upgrades, add sticky recurring revenue streams, further entrenching providers.
In parallel, Energy Infrastructure Services—engineering, interconnection, and asset monitoring—gain importance as clients demand seamless integration of generation, storage, and advanced controls. The Energy as a Service market is seeing rising cross-sell opportunities, where a single contract now spans supply, efficiency optimization, and on-site generation. Providers with deep software stacks and nationwide field service crews command premium valuations, reflecting the synergistic value created by integrated offerings.


By Service-Delivery Model – Subscription Stability Outpaces Flexible Leasing Growth
Pay-for-service agreements accounted for 39.55% of 2025 revenue, as they transform volatile utility expenses into a single, predictable monthly line item. These contracts typically bundle performance guarantees and align provider compensation with realized savings, reinforcing customer confidence. Leasing & Rental models gain traction at an 18.02% CAGR by offering shorter tenures and simplified off-balance-sheet treatment, which appeals to tenants or property managers with limited lease horizons. While the Energy as a Service industry occasionally employs Build-Own-Operate-Transfer structures for municipalities seeking eventual ownership, subscription plans are the dominant form of private-sector uptake.to legacy ESCO arrangements, modern Pay-for-Service contracts emphasize modular add-ons, such as demand-response participation, electric vehicle charging, and carbon reporting
Performance-based contracts remain prevalent in the public and institutional arena, supported by statutory frameworks that authorize multi-year repayment from guaranteed savings. Compared with legacy ESCO arrangements, modern Pay-for-Service contracts emphasize modular add-ons such as demand-response participation, electric-vehicle charging, and carbon-reporting dashboards. This evolution reinforces the Energy as a Service market’s positioning as a scalable, tech-enabled solution rather than a one-off retrofit scheme.
By Technology – Distributed Generation Leads; EV Infrastructure Accelerates
Distributed Generation-solar PV, wind turbines, and fuel-cell combined heat and power-held 36.05% of 2025 revenue. Its dominance owes to mature cost curves and broad policy support. The Energy as a Service market size attributable to on-site solar alone is expected to increase steadily as rooftop permitting processes become digitalized. Simultaneously, EV-charging infrastructure is growing at a 19.74% CAGR as logistics fleets, corporate campuses, and parking garage operators electrify. Coupling fast chargers with BESS allows demand-charge mitigation, creating a compelling service value proposition.
Battery-energy storage systems underpin multiple revenue streams, including time-of-use arbitrage, frequency regulation, and backup power. Intelligent energy-management platforms unify these assets, employing AI to orchestrate dispatch and predictive maintenance. The Energy as a Service market greatly benefits when all hardware layers communicate through open protocols, enabling remote firmware updates and real-time optimization.
By End User – Commercial Segment Dominates While Industrial Adoption Accelerates
Commercial buildings-such as retail chains, data centers, hospitals, and universities-accounted for 62.78% of 2025 turnover because their core operations rely on uninterrupted power, yet they often lack internal energy expertise. Data-center electricity demand alone could reach 9.1% of U.S. load by 2030, further intensifying uptake of fully managed service bundles. Industrial customers, although smaller today, are expected to register a brisk 13.72% CAGR as factories modernize under new emissions rules and electricity-intensive processes adopt electrification. The Energy as a Service market size tied to heavy industry is therefore poised to expand rapidly, especially where carbon-border adjustment policies raise export competitiveness stakes.
For commercial portfolios, standardized system designs and centralized monitoring yield economies of scale. In contrast, industrial facilities require bespoke engineering to align with process heat demands and safety codes. Providers that cultivate sector-specific expertise-such as pharmaceutical clean rooms, semiconductor fabs, or food-cold-chain warehouses-secure differentiation in a crowded Energy as a Service market.
Geography Analysis
North America Energy As a Service (EaaS) Market
North America retained 42.18% of global revenue in 2025, powered by the IRA’s USD 370 billion stimulus, state-level storage mandates, and mature corporate procurement programs. The Greenhouse Gas Reduction Fund steers low-interest capital to disadvantaged communities, broadening the customer base beyond Fortune 500 enterprises. Canada reinforces regional momentum through carbon pricing and provincial clean-energy auctions. Cross-border interoperability of smart-metering standards and open-data policies further accelerates platform scalability for energy-as-a-service market participants.
APAC Energy As a Service (EaaS) Market
The Asia-Pacific region records the fastest growth, with a 16.32% CAGR to 2031, reflecting rapid urbanization and sustained public-sector investment. China’s multi-gigawatt distributed-generation schemes and India’s transmission build-out unlock substantial opportunities for turnkey microgrid and storage offerings. Japan and South Korea deploy high-penetration renewables paired with advanced predictive maintenance analytics, establishing templates that are replicable across ASEAN nations. Although financing costs remain elevated in certain jurisdictions, blended-finance facilities and export-credit support mitigate risk and catalyze the regional Energy-as-a-Service market.
EMEA and South America Energy As a Service (EaaS) Market
Europe maintains a sizable share, bolstered by the Fit-for-55 decarbonization targets that compel large emitters to contract for renewable power and energy efficiency guarantees. Harmonized data-sharing frameworks simplify multi-country rollouts, though each member state retains discretion over behind-the-meter incentive design, which introduces execution complexity. South America, the Middle East, and Africa together contribute a modest but growing slice of global revenue. Currency volatility and policy uncertainty temper uptake, yet landmark projects-such as Morocco’s 822,000 m³/day desalination plant incorporating solar-plus-storage under a 35-year concession-demonstrate feasibility for bankable Energy as a Service market structures

Regulatory Landscape
Policy frameworks that govern energy efficiency services, contracting, and grid participation continue to shape how EaaS offerings are structured and financed. In the European Union, the recast Energy Efficiency Directive (Directive (EU) 2023/1791) includes provisions aimed at removing regulatory and non-regulatory barriers to energy performance contracting and related service models, with Article 29 scheduled for national transposition by 11 October 2025. The European Commission also issued guidance to support implementation, including Commission Recommendation (EU) 2024/2476, which addresses transparency in energy service markets and practical interpretation, including public-sector accounting treatment aligned with Eurostat guidance for Energy Performance Contracts.
Regulatory requirements tied to market access and consumer protection can still limit certain full-service models. In the United Kingdom, the classification of some full-service EaaS contracts under Financial Conduct Authority rules adds complexity around consumer-credit and capital treatment, and the Boiler Upgrade Scheme has restrictions affecting eligibility for third-party-owned systems, limiting one common EaaS pathway for heat pump financing. On the electricity-supply side, oversight bodies continue to formalize PPA market monitoring. ACER, under the EU electricity market framework (Regulation (EU) 2019/943), conducts annual assessments of PPA markets and released dedicated country sheets in November 2025, reinforcing reporting and transparency expectations that influence how EaaS providers source and contract low-carbon electricity for customers.
Competitive Landscape
The market remains moderately fragmented with clear signals of consolidation. Tier-one multinationals—such as Schneider Electric, Honeywell, Siemens, and ABB—bundle hardware, software, and financing, leveraging their global footprints to win campus-scale deals. Mid-tier specialists—Veolia, Enel X, and NRG—emphasize regional depth and sector-focused expertise, often partnering with equipment OEMs to offer jointly branded solutions. Digital-native entrants supply AI-first platforms that integrate third-party assets via API-based architectures, lowering switching costs for customers and pressuring incumbents to modernize.
Acquisition activity centers on complementary capabilities. Honeywell’s USD 1.81 billion purchase of Air Products’ LNG process unit extends its portfolio into low-carbon fuels. Bosch’s USD 8 billion acquisition of Johnson Controls’ air-conditioning assets creates an HVAC powerhouse positioned to embed subscription-based efficiency services worldwide. Strategic partnerships also flourish: Carrier and Google Cloud co-develop AI-powered home energy management that integrates HVAC hardware, batteries, and real-time optimization. These examples underscore how data analytics and integrated controls now represent key battlegrounds rather than commodity hardware specifications.
Differentiation increasingly hinges on customer-experience metrics—such as deployment speed, billing transparency, and verified emissions reporting—rather than kilowatt-hour price alone. Providers, therefore, invest in user-friendly dashboards, mobile alerts, and automated compliance documentation to enhance their operations. Supply-chain resilience and cybersecurity posture likewise influence purchasing decisions, prompting vendors to pursue SOC 2 certifications and zero-trust network architectures. As scaled players absorb niche innovators, the Energy as a Service market is shifting toward oligopolistic dynamics; however, regional regulations and sector-specific requirements still preserve room for agile challengers.
Energy As A Service (EaaS) Industry Leaders
Schneider Electric SE
Engie SA
Veolia Environnement SA
Honeywell International Inc.
Johnson Controls International plc
- *Disclaimer: Major Players sorted in no particular order
Energy As A Service (EaaS) Market Companies Covered in this Report
- Schneider Electric SE
- Engie SA
- Honeywell International Inc.
- Veolia Environnement SA
- Electricité de France (EDF) SA
- Johnson Controls International plc
- Bernhard
- Enel SpA
- Sparkfund
- Siemens AG
- ABB Ltd.
- Centrica Business Solutions
- Ameresco
- NRG Energy
- Shell Energy
- Duke Energy Sustainable Solutions
- Ørsted A/S
- TotalEnergies
- E.ON SE
- Brookfield Renewable
- Generate Capital

Market Opportunities and Future Outlook
Large-load and multi-site customers are using service-like contracting structures to accelerate energy infrastructure buildouts while managing balance-sheet and execution risk. This is creating room for providers to bundle financing, interconnection, generation, storage, and controls into single agreements. In April 2026, OG&E announced a partnership with Google to support three data centers in Oklahoma under a structure where Google funds 100% of grid-connection costs and associated new generation infrastructure, pointing to utility-facilitated, customer-funded infrastructure arrangements that better match EaaS-style risk allocation. Similar dynamics appeared in April 2026 through NiSource announcements related to large-scale data center operations in Indiana, combining dedicated generation assets and market capacity purchases and expanding arrangements with Amazon Data Services to support faster site activation while addressing ratepayer impacts through credits.
Storage-backed services and portfolio-scale procurement are also broadening the opportunity set for EaaS platforms that pair asset performance with software-driven optimization. In June 2026, NatPower signed a multi-year supply and execution agreement with Tesla for more than 25 GWh of Megapack systems across Italy and the UK under an ownership and operation model that aligns with long-tenor, service-backed infrastructure deployment. At a smaller project scale, Nuvve expanded its European revenue platform in March 2026 by adding a 40 MW/80 MWh BESS project in Austria via a cooperation agreement with OMNIA Group Holdings, highlighting growing space for aggregators and platform operators to monetize flexibility alongside customer energy services, including monitoring, dispatch, and settlement.
Recent Industry Developments in Energy As A Service (EaaS) Market
- June 2026: NatPower signed a multi-year supply and execution agreement with Tesla for over 25 GWh of Megapack battery storage systems across Italy and the UK. The structure supports NatPower-owned, utility-scale storage buildouts that can be wrapped into long-term optimization and performance services, strengthening the storage layer that underpins many EaaS offerings.
- April 2026: OG&E announced a partnership with Google to power three data centers in Oklahoma, with Google funding 100% of grid connection costs and associated new generation infrastructure. The arrangement reinforces customer-funded, utility-facilitated infrastructure as a practical template for large-load energy service contracting where costs and timelines are managed through negotiated agreements.
- March 2026: Nuvve expanded its European revenue platform by adding a 40 MW/80 MWh battery energy storage system project in Austria through a cooperation agreement with OMNIA Group Holdings. This move broadens Nuvve's ability to pair storage assets with dispatch, aggregation, and settlement capabilities, supporting service-led monetization of flexibility for commercial and grid-facing use cases.


Energy As A Service (EaaS) Market Report Scope and Research Methodology
Market Definition and Coverage
This market covers revenue generated by providers that deliver energy outcomes as an outsourced service, where customers pay through contracts instead of owning and operating the assets themselves. It includes bundled offerings that combine supply, infrastructure, performance commitments, and ongoing energy management.
Scope exclusions: Pure one-time equipment sales, standalone construction work, and basic utility retailing that is not delivered as a contracted service model are excluded.
Segments Covered in This Report
- By Service Type
- Energy Supply Services
- Energy Efficiency and Optimisation Services
- Operation and Maintenance Services
- Energy Infrastructure Services
- Microgrid-as-a-Service
- By Service-Delivery Model
- Pay-for-Service (Subscription)
- Performance-based Contracting (ESCO/EPC)
- Build-Own-Operate-Transfer (BOOT)
- Leasing and Rental Models
- By Technology
- Distributed Generation (Solar PV, Wind, Combined Heat & Power and Fuel Cells)
- Energy Storage (Battery Storage, and Thermal Storage)
- Smart Energy Management & Analytics
- EV-Charging Infrastructure
- By End User
- Commercial (Data Centres, Retail & Shopping Malls, Healthcare Facilities, Educational Institutions, Hospitality and Others)
- Industrial (Heavy Manufacturing, Food & Beverage Processing, Chemicals & Pharmaceuticals, Mining & Metals and Others)
- By Geography
- North America
- United States
- Canada
- Mexico
- Europe
- Germany
- United Kingdom
- France
- Italy
- NORDIC Countries
- Russia
- Rest of Europe
- Asia-Pacific
- China
- India
- Japan
- South Korea
- ASEAN Countries
- Rest of Asia-Pacific
- South America
- Brazil
- Argentina
- Rest of South America
- Middle East and Africa
- Saudi Arabia
- United Arab Emirates
- South Africa
- Egypt
- Rest of Middle East and Africa
- North America
Data Sources, Market Sizing, and Validation
Desk Research
Desk work was used to build the first structure of the market and to pin down what should be counted as service revenue versus adjacent energy spending. We relied on public sources such as the US Energy Information Administration (EIA), the International Energy Agency (IEA), the World Bank, UN Comtrade trade statistics, and US DOE program publications to interpret demand signals like electricity consumption, distributed generation adoption, and storage additions.
We also reviewed company filings and investor presentations, project announcements covered in reputable press, and association materials to map the contract types and delivery models used in practice. Where useful, paid subscriptions for company financials and news, patent databases, and an import-export shipment level database were used to fill gaps in timelines, technology direction, and supplier footprint. These sources are illustrative, and additional references were used for data collection, cross-checking, and clarification.
Primary Interviews and Surveys
Primary interviews and surveys were run with stakeholders across the value chain, including service providers, contract managers, technology partners, and large commercial and industrial energy buyers. As the market is global, inputs were checked across APAC, EMEA, and the Americas to confirm what is actually contracted, how bundles are priced, and which services are being used in live projects.
Distribution of primary research fieldwork respondents
| Company type | Respondent position | Region |
|---|---|---|
| Top tier: 29% | CXOs: 13% | APAC: 44% |
| Mid tier: 49% | Functional/Unit leaders: 43% | EMEA: 33% |
| Smaller Players: 22% | Managers: 44% | Americas: 23% |
Market-Sizing & Forecasting
The core sizing starts with a top-down build that reconstructs the addressable spend using commercial and industrial energy services demand pools, and then it is translated into contracted EaaS revenue based on adoption and delivery-model shares. To keep the model practical, we track a short list of inputs that can be explained and refreshed, including C&I electricity use, distributed generation and storage deployments, microgrid project activity, typical contract duration and renewal behavior, and service pricing logic tied to savings and performance commitments.
After the top-down totals are formed, they are tested using selective bottom-up approximations so the totals stay realistic. We roll up sampled provider revenue where disclosures are available, check volume assumptions against known project counts, and apply sampled average contract values to validated activity levels. Where disclosures are thin, we handle gaps through regional proxies. Forecasts are then produced using scenario analysis supported by expert views on policy support, financing appetite, and the pace of adoption for subscription and performance-based models, which together shape the expected revenue curve.
Data Validation & Update Cycle
Validation is done through a set of cross-checks so the final number does not depend on one data stream. Model outputs are compared against independent signals such as distributed generation additions, storage rollouts, microgrid deployments, and observed contract patterns described by respondents. When unusual jumps show up, assumptions are revisited, and follow-up calls are triggered to confirm whether the change is structural or a one-off project effect.
Before sign-off, the work goes through multiple analyst reviews that check arithmetic consistency, region splits, and whether the implied pricing and penetration rates look reasonable. Reports are refreshed annually, and interim updates are made when material events occur, including major policy shifts or large changes in financing conditions. Right before delivery, a final review pass is completed so clients receive the most current view available.
Mordor Intelligence's Energy As A Service Market Sizing Compared With Other Published Estimates
Published market values for EaaS often look different because the category sits next to many neighboring spends, and each publisher draws the boundary in a different place. Differences also show up when firms apply different pricing logic for long-term contracts, or when they update assumptions at different times of the year.
A major driver is how adjacent items are counted. Mordor Intelligence treats EaaS as contracted service revenue tied to delivery models such as subscription, performance-based contracting, and BOOT, and it does not automatically add one-time equipment sales or general utility retail revenue. Some estimates also assume faster price expansion for bundled energy management software, while others use different currency timing, which can shift the reported USD totals for the same year.
Benchmark comparison
| Source | Market Size | Gaps in Research Methodology |
|---|---|---|
| Mordor Intelligence | USD 107.59 B (2025) | |
| Global Consultancy A | USD 95.20 B (2025) | Uses a narrower service-only definition that excludes microgrid-as-a-service and some infrastructure-led contracting, and it applies more conservative adoption rates for performance-based contracts in C&I sites. |
| Industry Association B | USD 128.40 B (2025) | Blends EaaS with adjacent distributed energy spending by including a portion of equipment and installation value, and it assumes higher average contract values without consistent checks against observed project activity. |
The comparison shows that most of the spread is explained by what is counted as service revenue versus adjacent project spend, followed by differences in adoption and pricing assumptions. By keeping the total traceable to contract models, activity signals, and repeatable refresh steps, the market size remains easier to reconcile year to year.


Key Questions Answered in the Report
What is the projected value of the global Energy as a Service market in 2031?
It is forecast to reach USD 203.74 billion, growing at an 11.23% CAGR from 2026.
Which region leads adoption of Energy as a Service solutions today?
North America held 42.18% of 2025 revenue, driven by strong policy support such as the Inflation Reduction Act.
Why are microgrids gaining popularity within commercial campuses?
They deliver 20-60% cost savings and ensure resilience during grid outages, benefits now available through subscription contracts.
How does the IRA reshape project economics for service providers?
Grants, tax credits, and low-interest loans lower capital costs, letting providers offer more competitive subscription prices.
Which technology segment is expanding fastest through 2031?
EV-charging infrastructure is expected to scale at a 19.74% CAGR as fleet electrification accelerates.
What are the main cybersecurity concerns for distributed energy assets?
Battery-management and control systems can be vulnerable to remote attacks, prompting stricter compliance requirements and higher liability exposure.
Page last updated on:


 Your data is secure and never sold or shared.


