
Encoder Market Size and Share
Market Overview
| Study Period | 2020 - 2031 |
|---|---|
| Market Size (2026) | USD 3.85 Billion |
| Market Size (2031) | USD 5.71 Billion |
| Growth Rate (2026 - 2031) | 8.21% CAGR |
| Fastest Growing Market | Asia-Pacific |
| Largest Market | Asia-Pacific |
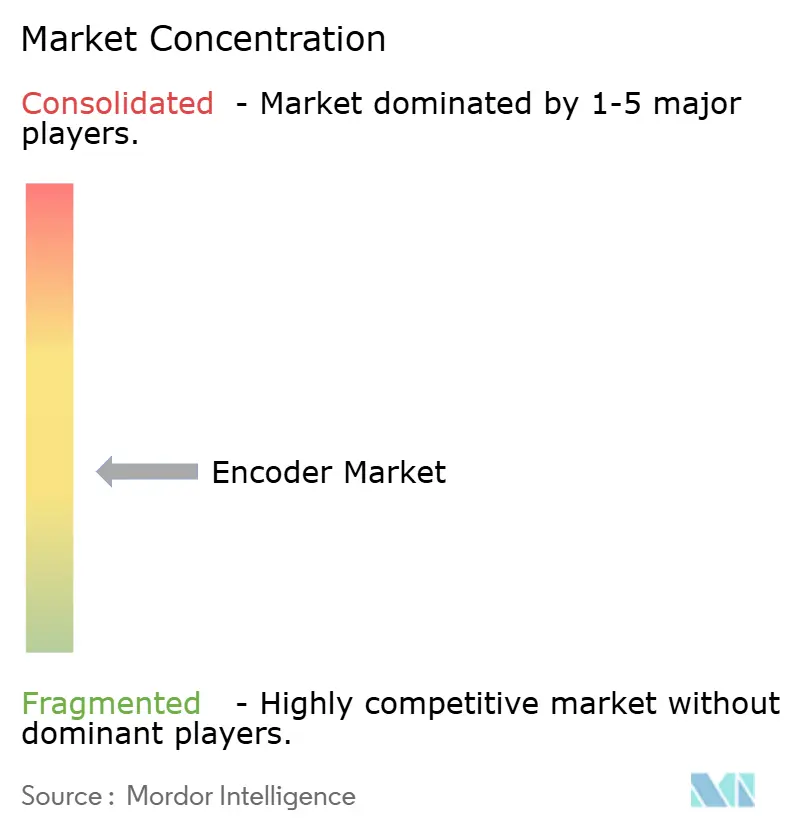
| Market Concentration | Medium |
Major Players *Disclaimer: Major Players sorted in no particular order Image © Mordor Intelligence. Reuse requires attribution under CC BY 4.0. | |
Encoder Market Analysis by Mordor Intelligence
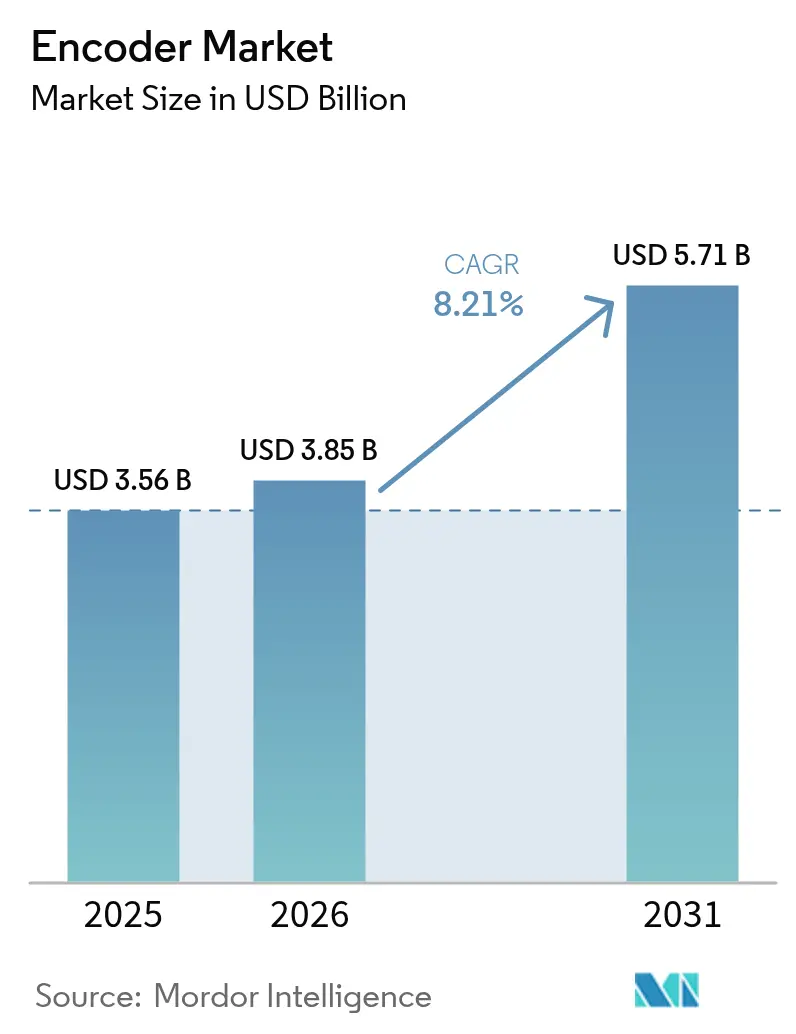
The encoder market size in 2026 is estimated at USD 3.85 billion, growing from 2025 value of USD 3.56 billion with 2031 projections showing USD 5.71 billion, growing at 8.21% CAGR over 2026-2031. Sustained factory-floor automation, the spread of collaborative robots, and tightening functional-safety rules are the main forces propelling this expansion. Pent-up demand for higher‐resolution feedback is accelerating the migration from incremental to absolute designs, while integrated motor-encoder modules shorten assembly time and improve mean time between failures. Asia-Pacific, led by China, Japan, and India, contributes the largest volume of shipments and also captures the fastest growth rate as regional manufacturers scale precision packaging, electronics, and machine-tool lines. Established European vendors retain leadership in sub-micron optical products, yet rapidly improving magnetic IC solutions from Suzhou and Shenzhen have widened global price competition and nudged many buyers toward hybrid or inductive alternatives.
Key Report Takeaways
- By product type, rotary devices held 72.65% of encoder market share in 2025; linear encoders record the fastest 7.28% CAGR to 2031.
- By technology, optical systems led with 51.85% revenue in 2025, while magnetic designs post the highest 8.17% growth through 2031.
- By output signal, incremental units controlled 61.45% of the encoder market size in 2025, yet absolute encoders expand at 8.62% annually.
- By end-user industry, industrial automation accounted for 38.55% of 2025 revenue; medical devices represent the fastest-growing application at 9.11% CAGR.
- By geography, Asia-Pacific commanded 35.25% of global sales in 2025 and maintains a 9.45% CAGR through 2031.
Note: Market size and forecast figures in this report are generated using Mordor Intelligence’s proprietary estimation framework, updated with the latest available data and insights as of 2026.
Global Encoder Market Trends and Insights
Drivers Impact Analysis*
| Driver | (~) % Impact on CAGR Forecast | Geographic Relevance | Impact Timeline |
|---|---|---|---|
| EU collaborative-robot adoption | +0.6% | Western & Northern Europe | Medium term (2-4 years) |
| China smart packaging lines | +0.8% | China, Taiwan | Short term (≤2 years) |
| Japanese SIL 2/3 safety rules | +0.5% | Japan | Long term (≥4 years) |
| India PLI-driven CNC expansion | +0.4% | India | Medium term (2-4 years) |
| US medical-robotics shift to integrated motor-encoder modules | +0.5% | United States | Short term (≤2 years) |
| Semiconductor lithography demand for sub-nanometer feedback | +0.7% | Global tier-1 fabs | Long term (≥4 years) |
| Source: Mordor Intelligence | |||


EU adoption of collaborative robots
Wider use of cobots in German, French, and Nordic plants requires sub-micron feedback to guarantee safe human-robot interaction. OEMs now specify encoders with 1 nm resolution and ±4 µm system accuracy to meet force-limiting norms, enabling robots to detect the slightest contact and halt within milliseconds. High-resolution absolute optics such as Renishaw’s RESOLUTE line meet these thresholds and support speeds up to 100 m/s, letting automation suppliers increase throughput without compromising worker protection. Broader deployment of ISO / TS 15066-compliant systems is therefore lifting average selling prices across the encoder market even as unit volumes climb [1]Renishaw plc, “RESOLUTE Absolute Encoder System,” renishaw.com .
China’s smart packaging lines
Electronics and pharmaceutical packagers in China run lines that position parts at sub-100 nm tolerances while cycling hundreds of units per minute. Vibration, thermal fluctuation, and airborne particulates force line builders to blend optical scales with rugged housings or shift to inductive formats that still deliver nanometer-grade precision. Each expansion project typically specifies multiple axes of feedback, so growth in this vertical materially raises encoder shipments. Provincial subsidies for fully automated factories amplify demand by lowering capital hurdles for mid-tier manufacturers.
Functional-safety (SIL 2/3) rules in Japanese process industries
Chemical and pharmaceutical sites in Japan must now prove compliance with SIL 2/3 mandates that ensure safe shutdown if any single component fails. Encoders with redundant tracks and built-in diagnostics gain share because they acquire absolute position on power-up and validate signal integrity in real time. The rule set spurs early replacement of legacy incremental units, lengthening the average revenue per installation and bolstering the encoder market in a country already known for high automation density.
PLI-backed CNC machine-tool growth in India
India’s Production Linked Incentive program has mobilized USD 19.3 billion (₹1.61 lakh crore) of committed capital and created over 1.15 million jobs across electronics, medical devices, and automotive lines. CNC builders responding to fresh domestic orders are equipping new spindles and linear motors with high-precision rotary encoders to hold micron-level part tolerances. The resulting uplift in unit demand supports local assembly of encoder subcomponents and entices foreign vendors to increase Indian sourcing [2]Press Information Bureau, “PLI Scheme Generates ₹14 Lakh Crore Production Across 14 Sectors,” pib.gov.in .
Restraints Impact Analysis*
| Restraint | (~) % Impact on CAGR Forecast | Geographic Relevance | Impact Timeline |
|---|---|---|---|
| Dust-induced optical-encoder failures | -0.3% | ASEAN steel & cement corridors | Short term (≤2 years) |
| Low-cost magnetic IC price erosion | -0.4% | Global mid-tier automation | Medium term (2-4 years) |
| US-EU export controls on ultra-precision encoders | -0.2% | Mainland China | Short term (≤2 years) |
| Remaining price premium of absolute encoders | -0.2% | Global | Medium term (2-4 years) |
| Source: Mordor Intelligence | |||
Optical contamination failures in dust-intensive ASEAN steel mills
Particulate fallout in blast-furnace bays obstructs traditional code discs, leading to sudden position loss and unscheduled outages. Facility managers now pivot toward magnetic or inductive sensing that tolerates debris without sacrificing uptime, curbing replacement demand for optical models and marginally slowing encoder market revenue in heavy-industry niches [3]Baumer Group, “Bearingless Encoders for Harsh Industrial Environments,” baumer.com .
Suzhou & Shenzhen low-cost magnetic IC encoders driving price erosion
Foundry-level advances let Chinese fabless firms offer 10-bit to 12-bit single-chip encoders at fraction-of-legacy prices. General automation customers adopt these parts for conveyors and pick-and-place arms where ultimate resolution is less critical. Greater supply exerts downward pressure on average selling prices worldwide, shrinking gross margins and limiting near-term revenue expansion.
*Our forecasts treat driver/restraint impacts as directional, not additive. The impact forecasts reflect baseline growth, mix effects, and variable interactions.
Segment Analysis
By Type: Rotary dominance reinforced by linear acceleration
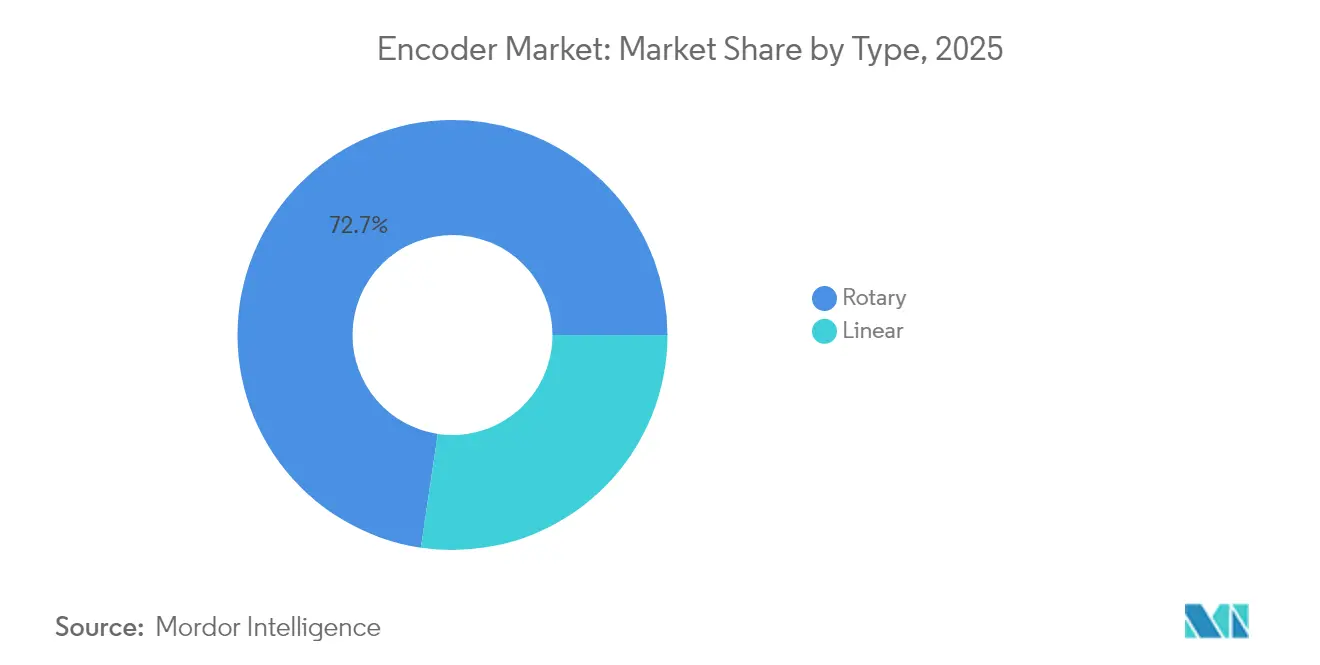
Rotary devices generated 72.65% of encoder market revenue in 2025 as virtually every servo motor and robot joint needs angular feedback. Their entrenched base, wide shaft-size offerings, and direct compatibility with off-the-shelf drives keep demand buoyant. Linear encoders, however, post a 7.28% CAGR to 2031 as semiconductor steppers, lithography stages, and direct-drive tables prioritise friction-free translation. The encoder market size for linear solutions is set to climb from USD 973.66 million in 2025 to USD 1.48 billion in 2031, propelled by machine-tool builders replacing ball-screw rigs with air-bearing or magnetic levitation slides. Growth in additive manufacturing also favours linear scales that provide closed-loop z-axis control at sub-micron granularity.
Emerging use of enclosed designs such as Renishaw’s FORTiS reduces downtime in coolant-rich machining centres, while ultra-high-vacuum variants capture share in EUV lithography chambers. Although retrofits sustain rotary volumes, new-build capital equipment increasingly incorporates dual sensors—rotary for spindle position and linear for carriage motion raising overall encoder market shipments without cannibalising either sub-category.


By Technology: Optical precision versus magnetic resilience
Optical encoders retained 51.85% revenue in 2025, driven by 1 nm resolution models required in wafer steppers, coordinate-measuring machines, and high-end cobots. The encoder market share for optical units may slip marginally by 2031 as magnetic options cut the historical resolution gap. Magnetic devices expand at an 8.17% CAGR because they withstand oil mist, dust, and wide temperature swings, lowering total cost of ownership in steel, mining, and wind-turbine applications. Battery-free absolute magnetics recently launched by Nidec further widen use cases by eliminating supercapacitors and maintenance cycles .
Capacitive and inductive platforms occupy well-defined niches: capacitive encoders resist electromagnetic interference for MRI beds and semiconductor ion implanters, whereas inductive solutions thrive in food-grade or wash-down zones thanks to fully sealed housings. Suppliers devote R&D dollars to hybrid stacks that blend optical code strips with magnetic reference tracks, handling high axial misalignment without loss of nanometric repeatability. This convergence should keep encoder market differentiation centred on firmware, diagnostics, and connectivity rather than pure sensing physics.
By Output Signal: Absolute gaining momentum over incremental
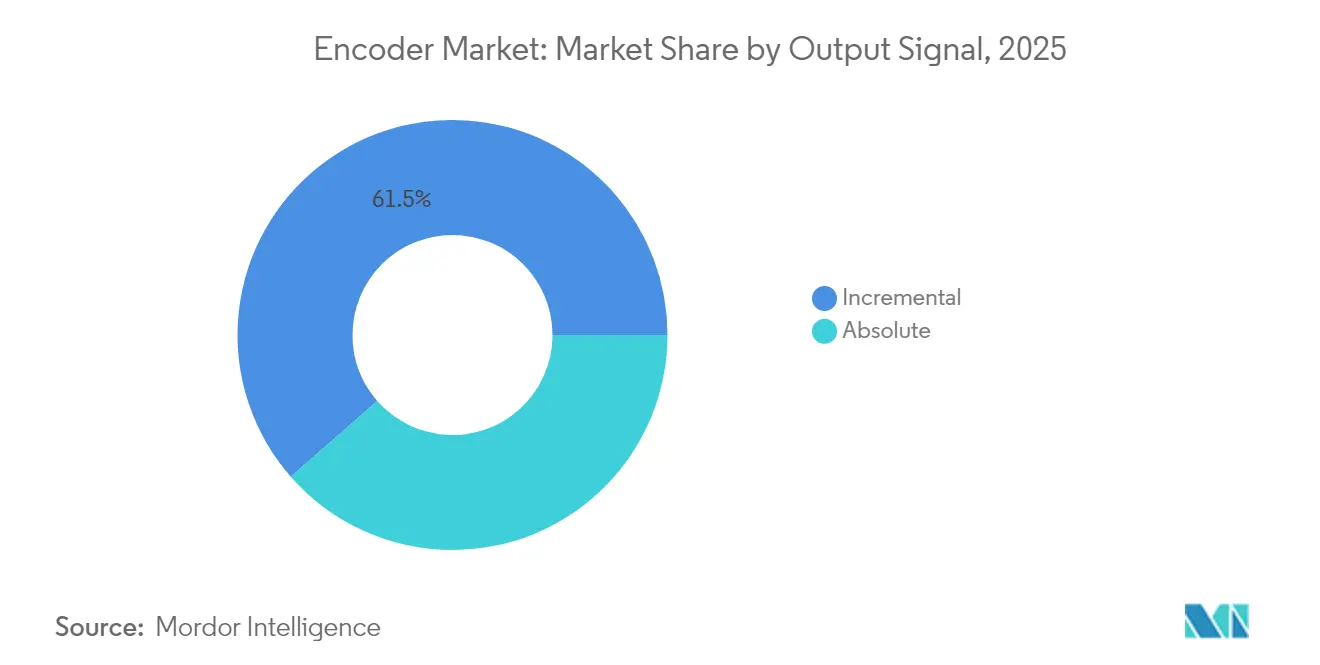
Incremental encoders led unit shipments in 2025 because PLCs and variable-frequency drives already support quadrature inputs and because the devices cost 15%–20% less. Yet absolute formats record an 8.62% CAGR—outpacing every other category—since users cannot afford post-power-loss homing in lights-out warehouses or surgical theatres. The encoder market size for absolute models is projected to rise from USD 1.37 billion in 2025 to USD 2.25 billion in 2031. Price premiums are falling as single-turn magnetic ASICs integrate multiturn counting through energy harvesting, while high-end optical discs now share photodiode arrays across two tracks to conserve bill of materials.
Next-generation inductive scanning from Heidenhain delivers 22-bit output in a 35 mm flange package, suiting collaborative robots and delta pickers where envelope constraints are strict. As capital equipment budgets increasingly factor downtime into life-cycle cost models, absolute encoders’ ability to start from rest with full positional awareness often justifies the extra upfront expense.
By End-user Industry: Industrial backbone meets medical innovation
Discrete manufacturing captured 38.55% of 2025 revenue, underpinned by automotive, white-goods, and electronics production lines that deploy hundreds of axes per site. Growth remains linked to tightening takt-time targets and higher first-pass yield, both of which benefit from real-time position feedback. The encoder industry finds incremental opportunity in medical devices where surgical robots, CT gantries, and infusion pumps must track movement within sub-millimetre bands. Medical adoption posts a 9.11% CAGR as hospitals in the United States and Western Europe expedite digitised operating suites.
Electric-vehicle drivetrains sustain steady unit pull-through for resolvers and motor-shaft encoders, especially in China where local OEMs ship millions of e-motors annually. Semiconductor manufacturers represent a smaller but high-margin pool because each lithography scanner can embed more than 120 linear and rotary encoders, many priced far above commodity levels. Across these verticals, integration with industrial Ethernet protocols and predictive-maintenance firmware emerges as a key differentiator.
Geography Analysis
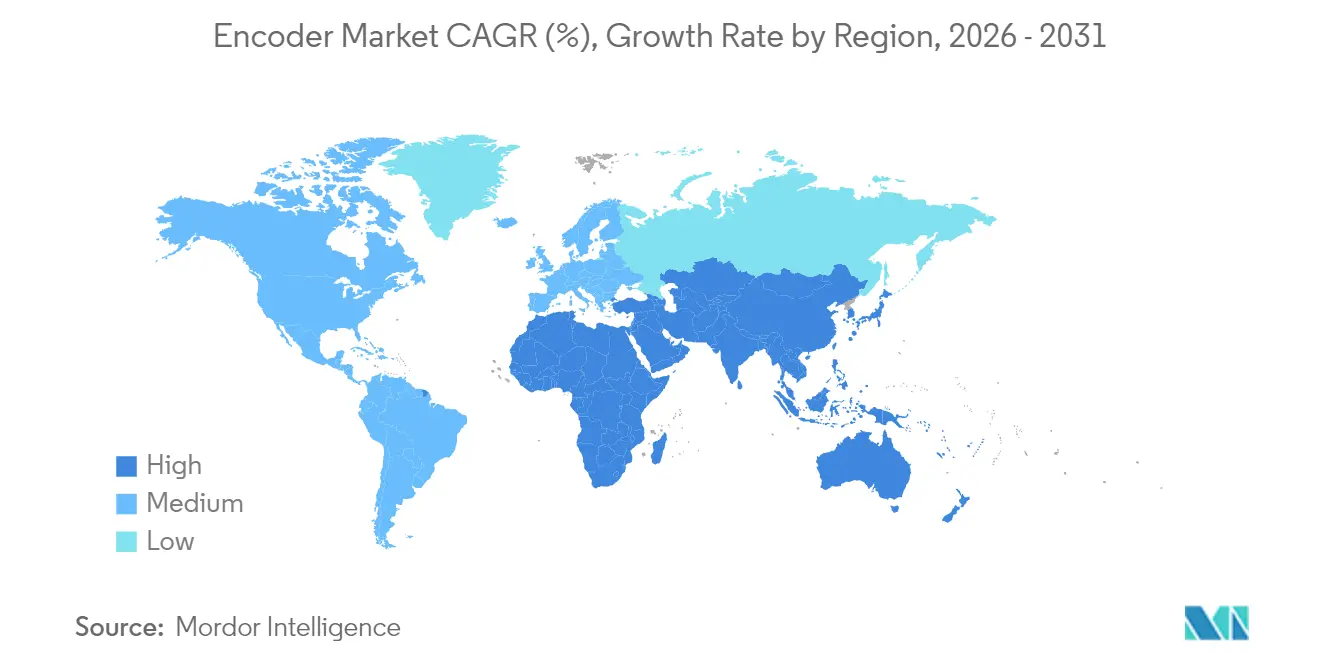
Asia-Pacific led with 35.25% of global revenue in 2025 and sustains a 9.45% CAGR through 2031. Chinese policy backing for smart factories and compound-semiconductor fabs continues to funnel encoder orders into coastal provinces. Japan’s installed robot base exceeds 420 units per 10,000 workers, keeping demand resilient for SIL-rated feedback components that fit legacy servo footprints. India’s PLI tranche drives the fastest incremental gains, with encoder call-offs attaching to new CNC, PCB, and medical-device lines financed under the scheme. The encoder market size in Asia-Pacific therefore moves from USD 1.26 billion in 2025 toward USD 2.16 billion in 2031.
North America and Europe together represent roughly half of 2025 turnover, powered by aerospace, medical robotics, and precision machining. The United States anchors clinical-grade demand: Johnson & Johnson MedTech’s OTTAVA™ surgical platform integrates ultra-compact optical encoders on every robotic arm to secure sub-millimetre repeatability. German and Swiss suppliers export high-accuracy scales worldwide, cementing Europe’s role as an innovation hub even as unit volumes migrate East. EU subsidies for collaborative-robot deployment channel revenue toward 1 nm-class feedback solutions, lifting average selling price across the region.
Latin America and the Middle East & Africa remain smaller contributor regions yet post steady single-digit growth as brownfield plants retrofit automated conveyors, palletisers, and bottling lines. Brazilian auto assemblers and Mexican Tier-1 suppliers now add magnetic encoders to motor drives as part of broader Industry 4.0 overhauls. Gulf-state oil producers specify ruggedised inductive and magnetic designs rated to 125 °C ambient and certified for Class 1 Div 2 zones. This uptake diversifies the global encoder market and cushions suppliers against cyclical slowdowns in any one geography.

Regulatory Landscape
Video encoding is shaped primarily by international codec specifications and regional broadcast-system rules that determine which bitstreams, profiles, and conformance constraints are permitted for distribution. In January 2026, ITU-T approved Rec. H.266 (VVC) and updated Rec. H.265 (HEVC, V11), creating a formal baseline for vendors and platform operators that need standards-aligned implementations and interoperability testing across contribution and delivery workflows.
Broadcast and broadband ecosystems moved in step with these codec baselines in 2026 through updated system specifications. DVB released A001 Rev. 23 (TS 101 154) in February 2026 to define technical requirements for video and audio coding in broadcast and broadband applications, and ATSC approved updated A/345 (VVC Video) and A/341 (HEVC) for ATSC 3.0 systems in April 2026. At the same time, ISO/IEC maintenance of AVC continues, with ISO/IEC 14496-10:2025 (AVC) tracked for revision status as of July 2026, reinforcing ongoing compliance needs for legacy AVC-heavy deployments alongside newer HEVC and VVC rollouts.
Competitive Landscape
The battle for share remains open, with no single firm exceeding 15% of global revenue. European leaders such as Renishaw, Heidenhain, and Baumer protect high-precision niches by rolling out multi-protocol digital outputs, functional-safety variants, and self-monitoring firmware. Japanese conglomerates Omron and Panasonic focus on mechatronic integration that shortens commissioning time for OEM clients. Meanwhile, Chinese challengers including Shanghai SICK, HONTKO, and several Suzhou IC houses flood the mid-tier automation space with 12-bit magnetic SoC products that cut bill-of-materials costs by 30% compared with traditional optical units.
Strategic moves increasingly hinge on ecosystem partnerships. Heidenhain co-develops inductive scanning arrays with drive-maker Siemens to embed high-bandwidth position feedback directly inside servo housings. Renishaw collaborates with metal-3D-printing firms to feed real-time stage data into melt-pool control loops, raising build quality and opening a lucrative after-market calibration service. Nidec aligns its new battery-free magnetic encoder with in-house servo motors, pitching a unified motion stack that eliminates backup power modules.
White-space opportunities centre on predictive-maintenance analytics. Vendors that harvest error signal statistics, vibration signatures, and temperature drift can warn plant engineers of impending encoder failure several weeks in advance. Adding this layer of insight lets suppliers sell software subscriptions that compound revenue and differentiate hardware that is otherwise at risk of commoditisation. The encoder market therefore shifts from mere component supply toward integrated motion-intelligence platforms.
Encoder Industry Leaders
Omron Corporation
Dr. Johannes Heidenhain GmbH
Rockwell Automation Inc.
Honeywell International
Pepperl+Fuchs SE
- *Disclaimer: Major Players sorted in no particular order

Market Opportunities and Future Outlook
The most immediate whitespace for encoder vendors is operational modernization in broadcast and streaming stacks, where standards updates in 2026 open up new codec choices and also require workflow re-architecture. With ATSC publishing updated A/345 (VVC) and A/341 (HEVC) in April 2026 and DVB issuing A001 Rev. 23 (TS 101 154) in February 2026, broadcasters and service providers have clearer constraints for adding VVC and refining HEVC implementations, including the ability to support migrations that must coexist with entrenched H.264/AVC pipelines.
A second opportunity is the shift toward software-defined, cloud-native encoding and playout, paired with AI-assisted media operations, which expands the addressable market beyond dedicated appliances into elastic compute and hybrid architectures. In July 2026, Fox Corporation named Amazon Web Services as its preferred AI cloud provider, integrating AWS Elemental MediaLive and AWS Elemental Inference for intelligent streaming and real-time content reformatting, a concrete signal of commercial uptake for AI-enabled encoding workflows at a large media operator. Separately, distribution-side investments such as SIMBA selecting Broadpeak Advanced CDN in July 2026 for a new streaming delivery network in Brazil point to demand for encoding profiles tuned for live and on-demand delivery performance and cost, including as Brazil progresses TV 3.0 codec choices that incorporate VVC as a primary codec.
Recent Industry Developments
- July 2026: ifm expanded its RM900S safety encoder family with certified options for mobile machines, supporting CANopen Safety and SIL2/PLd levels. The update supports adoption in safety-critical motion applications where encoder diagnostics and certified interfaces are required for machine compliance and uptime. It also raises the competitive bar for safety-rated encoder portfolios as more OEMs standardize on functional-safety variants.
- May 2026: HEIDENHAIN highlighted new motor-feedback and encoder offerings at SPS Italia 2026, including the ILC 3019 inductive linear encoder and updates tied to its corporate group portfolio. The focus on inductive solutions supports customers operating in contamination-prone environments where optical devices face reliability penalties. It also reinforces HEIDENHAIN's positioning in high-performance automation segments where robust sensing and industrial connectivity drive premium specifications.
- January 2024: Renishaw expanded the RESOLUTE family with Functional-Safety variants certified for SIL 2/3 applications. Adding certified safety options broadens use in regulated industrial environments that require validated shutdown behavior and fault detection. The move supports higher-value deployments in automation cells and collaborative-robot systems where safety compliance is specified at the component level.


Research Methodology Framework and Report Scope
Market Definition and Coverage
For this study, the encoder market covers devices that convert mechanical motion or position into electrical signals that can be read by control systems in machines, factory automation, and equipment. The market is sized in revenue terms across major end uses and geographies.
Scope exclusions: We exclude standalone motion controllers, PLCs, and complete servo drive systems when encoders are bundled and not priced as a distinct line item.
Segmentation Overview
- By Type
- Rotary
- Linear
- By Technology
- Optical
- Magnetic
- Capacitive
- Inductive
- Other Technologies
- By Output Signal
- Incremental
- Absolute
- By End-user Industry
- Automotive
- Electronics and Semiconductor
- Industrial
- Textile
- Printing Machinery
- Medical Devices
- Energy and Power
- Aerospace and Defense
- Other End-user Industries
- By Geography
- North America
- United States
- Canada
- Mexico
- South America
- Brazil
- Argentina
- Rest of South America
- Europe
- Germany
- United Kingdom
- France
- Italy
- Spain
- Rest of Europe
- Asia-Pacific
- China
- Japan
- South Korea
- India
- Australia
- New Zealand
- Rest of Asia-Pacific
- Middle East and Africa
- United Arab Emirates
- Saudi Arabia
- South Africa
- Rest of Middle East and Africa
- North America
Data Sources, Market Sizing, and Validation
Desk Research
Desk research started with defining what counts as an encoder sale and what does not, since encoder components are often packaged within larger automation kits. We relied on public sources that support production and demand signals, such as industrial output and manufacturing series from the World Bank and OECD, UN Comtrade trade statistics for relevant component flows, and U.S. International Trade Commission data for tariff and import trend context.
To reduce guesswork in pricing and adoption, we also reviewed standards and application references from bodies such as IEC and ISO, plus peer-reviewed engineering journals that discuss encoder use in robotics and machine tools. Company annual reports, SEC filings, and investor presentations were checked for revenue mix hints and end-market exposure, along with association websites and reputable press for automation cycle commentary and capacity announcements. In a few places, a paid subscription used for company financials and news helped validate ownership structures and fill gaps in smaller public disclosures. The sources listed here are illustrative only, and many other public references were used for data collection, validation, and clarification.
Primary Interviews and Surveys
Primary interviews and surveys were used to pressure test the demand pool, especially where encoders are chosen as part of the machine design rather than purchased as a separate line item. We spoke with a mix of component suppliers, automation system integrators, and procurement and maintenance teams at end-user plants across APAC, EMEA, and the Americas, and then used those inputs to confirm adoption rates, pricing movement, and replacement patterns.
Distribution of primary research fieldwork respondents
| Company type | Respondent position | Region |
|---|---|---|
| Top tier: 33% | CXOs: 15% | APAC: 38% |
| Mid tier: 51% | Functional/Unit leaders: 37% | EMEA: 37% |
| Smaller Players: 16% | Managers: 48% | Americas: 25% |
Market-Sizing & Forecasting
Sizing was built using a top-down and bottom-up approach, starting from industrial automation and machinery activity and then translating that activity into encoder demand through usage intensity assumptions. For the top-down build, production and trade indicators were used to reconstruct where motion systems are being installed, and then penetration rates were applied by end use to estimate unit demand, which was converted to value using typical price bands.
To keep the model practical, it focuses on a small set of measurable drivers, including factory automation capex sentiment, machine tool and robotics shipment trends, the mix shift between incremental and absolute encoders, optical versus magnetic technology choices, and typical replacement cycles in harsh-duty environments. Results were corroborated with selective bottom-up approximations, including sampled ASP times volume checks by end use, and supplier revenue sanity checks where disclosures were available. Where data was missing, we used conservative ranges that were validated through interviews.
Forecasting used scenario analysis supported by expert views, since end markets such as automotive production and electronics output can swing by region. In the final step, assumptions on pricing, technology mix, and adoption were updated so the forecast reflects the latest buying behavior heard during field discussions.
Data Validation & Update Cycle
Validation was handled through multiple checks so single-source noise does not drive the outcome. We compared model outputs against independent signals such as production indices, trade movement direction, and published automation investment commentary, and then investigated any large variances before sign-off.
A second analyst review is completed for the key assumptions, followed by selective re-contacts when a number looks out of line for a region or end use. Reports refresh annually, and interim updates are made when material events occur, such as major plant expansions, sharp currency shifts, or visible demand slowdowns. Before delivery, an analyst performs a fresh pass so clients receive the latest updated view.
Mordor Intelligence's Encoder Market Sizing Compared With Other Published Estimates
Published encoder market numbers can look far apart even when the underlying hardware is similar. The spread usually comes from how the scope is drawn, how average pricing is treated across technologies, and how the demand cycle is mapped to end-use industries.
Manufacturing output direction, import and export movement for relevant components, and interview checks on replacement rates are the evidence that keeps Mordor Intelligence's 2025 estimate anchored to encoder device revenue, with motion controllers, PLCs, and bundled servo systems excluded when they are not priced separately. Differences also show up when some sources assume faster ASP expansion across premium absolute encoders without matching that to what buyers report in recent sourcing cycles.
Benchmark comparison
| Source | Market Size | Gaps in Research Methodology |
|---|---|---|
| Mordor Intelligence | USD 3.56 B (2025) | |
| Global Consultancy A | USD 3.84 B (2025) | Applies a broader application mapping that can treat bundled encoder content inside larger automation assemblies as standalone revenue, and it also appears to use higher assumed price levels for premium absolute encoders without consistent quote-based validation across end uses. |
| Industry Publisher B | USD 5.34 B (2025) | Likely includes adjacent motion and control hardware in the counted revenue pool, which lifts the total above encoder-only device sales, and base-year currency timing and regional mix assumptions can further inflate the reported current value. |
The table mainly points to scope alignment and price validation as the practical reasons behind the gap. When the counted items are restricted to encoder devices and the value build is checked against adoption and replacement signals, the result becomes easier to trace and repeat for planning.


Key Questions Answered in the Report
How big is the Encoder Market?
The Encoder Market size is expected to reach USD 3.85 billion in 2026 and grow at a CAGR of 8.21% to reach USD 5.71 billion by 2031.
What is the current Encoder Market size?
In 2026, the Encoder Market size is expected to reach USD 3.85 billion.
Who are the key players in Encoder Market?
Omron Corporation, Honeywell International, Schneider Electric, Rockwell Automation Inc. and Panasonic Corporation are the major companies operating in the Encoder Market.
Which is the fastest growing region in Encoder Market?
Asia-Pacific is estimated to grow at the highest CAGR over the forecast period (2026-2031).
What years does this Encoder Market cover, and what was the market size in 2025?
In 2025, the Encoder Market size was estimated at USD 3.85 billion. The report covers the Encoder Market historical market size for years: 2019, 2020, 2021, 2022, 2023 and 2024. The report also forecasts the Encoder Market size for years: 2026, 2027, 2028, 2029, 2030 and 2031.
Page last updated on:






