
Emollient Market Size and Share
Market Overview
| Study Period | 2021 - 2031 |
|---|---|
| Market Size (2026) | USD 1.77 Billion |
| Market Size (2031) | USD 2.19 Billion |
| Growth Rate (2026 - 2031) | 4.46 % |
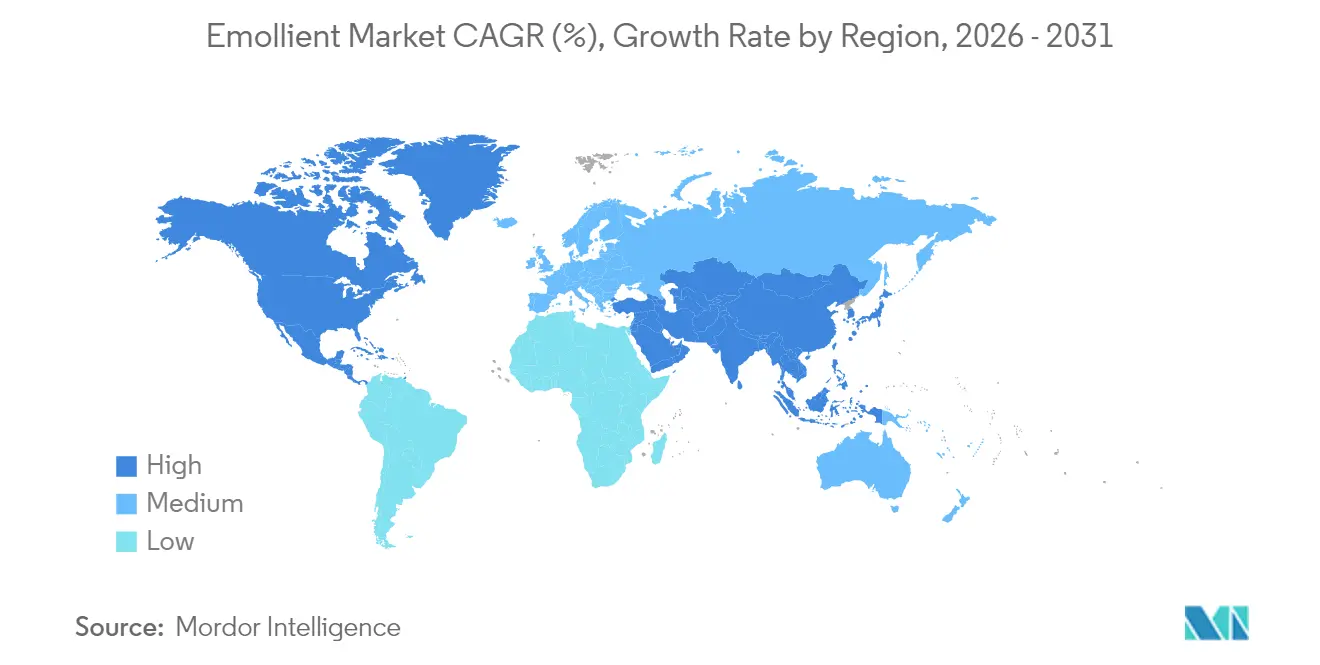
| Fastest Growing Market | North America |
| Largest Market | Asia Pacific |
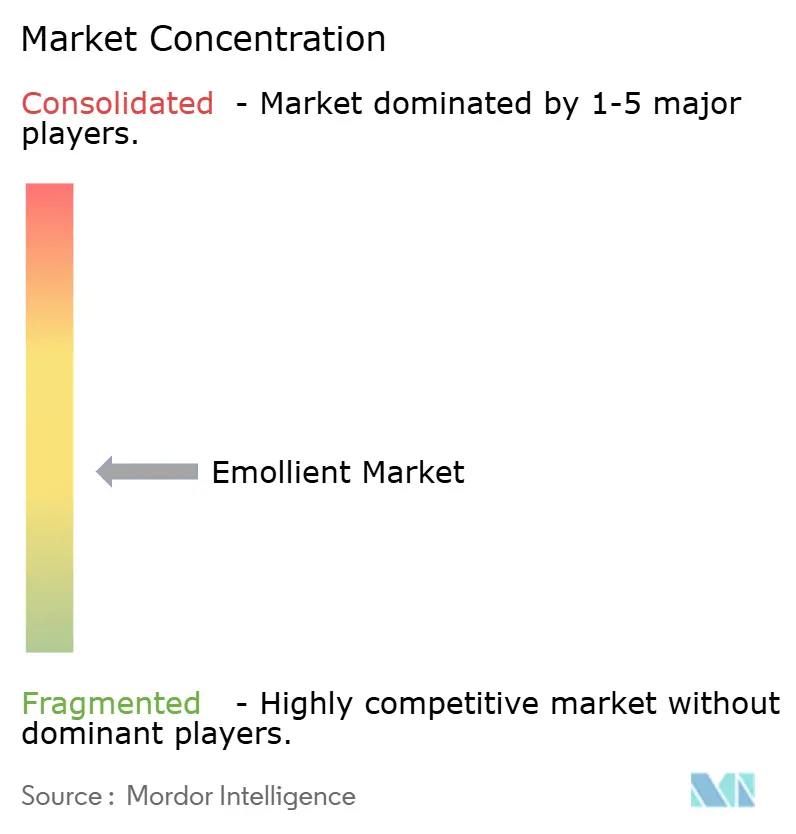
| Market Concentration | Medium |
Major Players
*Disclaimer: Major Players sorted in no particular order Image © Mordor Intelligence. Reuse requires attribution under CC BY 4.0. |
|
Emollient Market Analysis by Mordor Intelligence
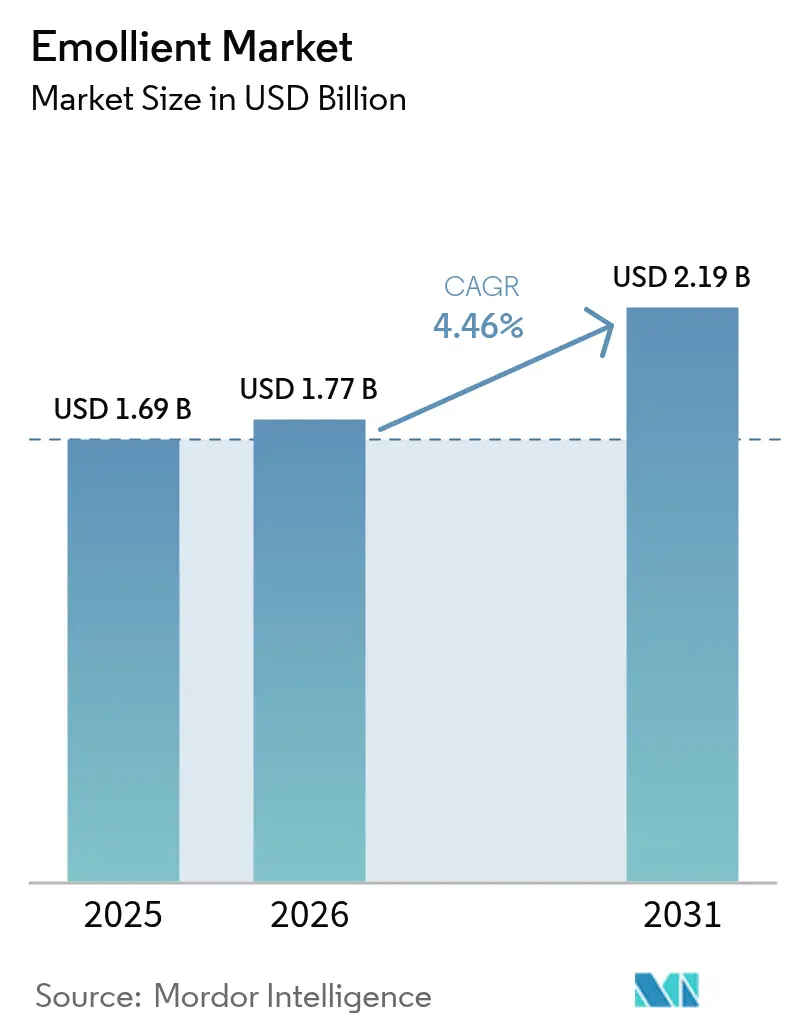
The Emollient market size is expected to grow from USD 1.69 billion in 2025 to USD 1.77 billion in 2026 and is forecast to reach USD 2.19 billion by 2031 at 4.46% CAGR over 2026-2031. The market growth is driven by consumer preferences for skin health and wellness products, particularly the demand for microbiome-friendly formulations that support skin barrier function. The increasing understanding of the skin microbiome's role in preventing dryness, irritation, and skin conditions has led manufacturers to develop products with prebiotic, probiotic, and postbiotic ingredients. The market is also expanding due to consumer demand for clean, sustainable, and ethically sourced ingredients, coupled with stricter regulatory requirements for product safety and efficacy. The emollients market continues to develop microbiome-focused solutions that address both consumer health needs and environmental considerations within the global cosmetics and personal care industry.
Key Report Takeaways
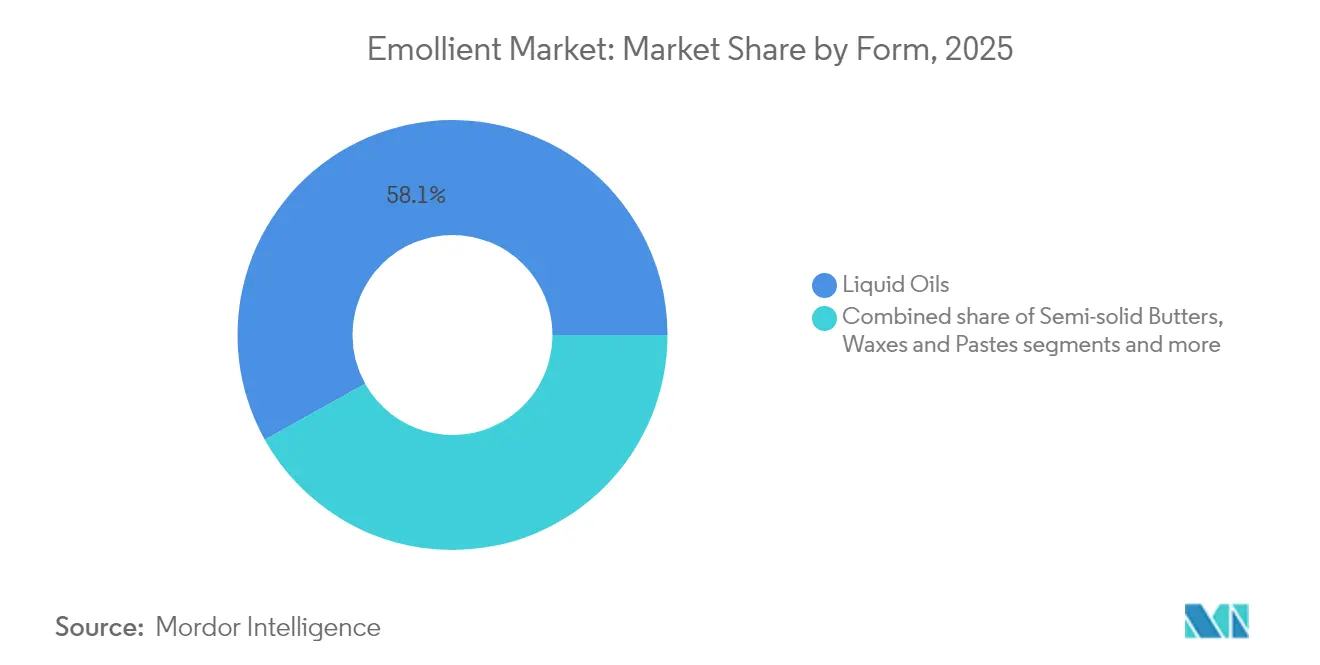
- By form, liquid oils commanded 58.10% of the emollients market share in 2025, while powder and beads are projected to grow at 6.07% CAGR through 2031.
- By source, plant-derived options held 45.05% revenue share in 2025; bio-fermented alternatives are expanding at 5.74% CAGR to 2031.
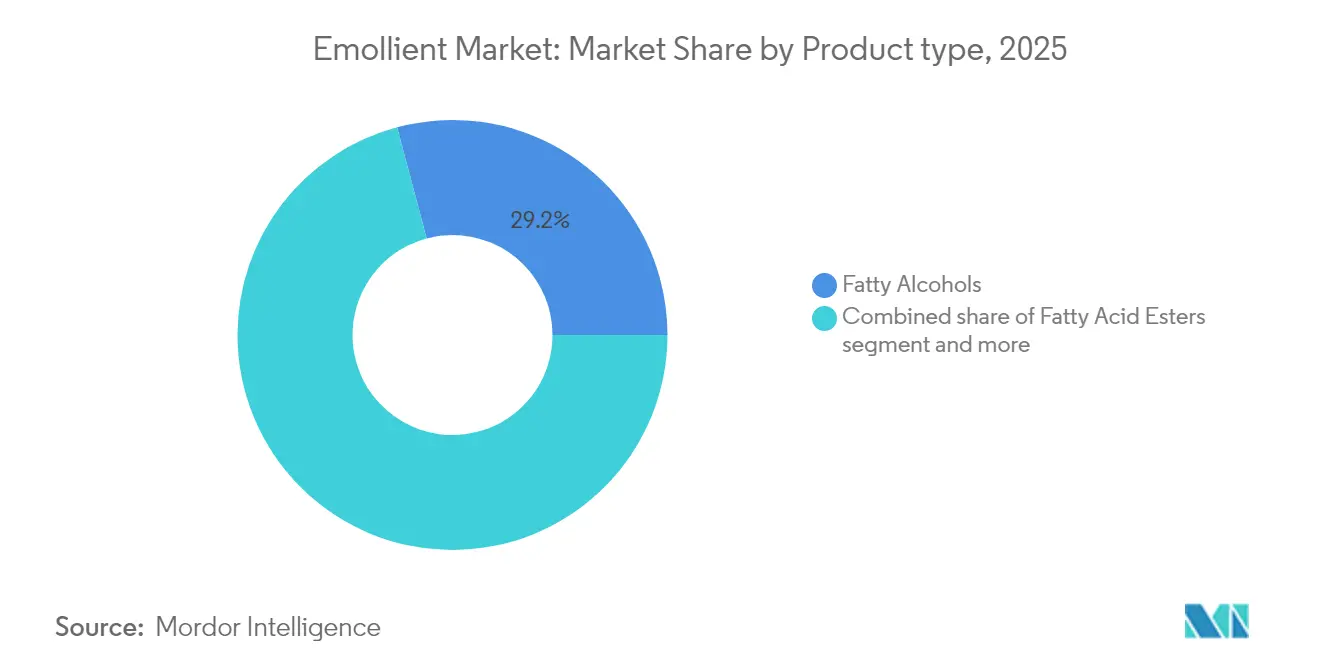
- By product type, fatty alcohols accounted for 29.15% of the emollients market size in 2025; fatty acid esters exhibit the fastest outlook, advancing 5.39% annually to 2031.
- By application, skincare retained 41.05% share of the emollients market size in 2025, whereas hair care is set to rise at 5.08% CAGR through 2031.
- By geography, Asia-Pacific led with 32.10% regional share in 2025; North America records the highest regional CAGR at 4.78% toward 2031.
Note: Market size and forecast figures in this report are generated using Mordor Intelligence’s proprietary estimation framework, updated with the latest available data and insights as of 2026.
Market Trends and Insights
Drivers Impact Analysis of Emollient Market*
| Driver | (~) % Impact on CAGR Forecast | Geographic Relevance | Impact Timeline |
|---|---|---|---|
| Skin-microbiome friendly formulations | +0.8% | Global, with early adoption in North America and the European Union | Medium term (2-4 years) |
| Technological advancements in emollient formulations | +0.7% | Global, concentrated in developed markets | Long term (≥ 4 years) |
| Increasing prevalence of skin illnesses | +0.6% | Global, higher impact in aging populations | Long term (≥ 4 years) |
| Expansion geriatric population | +0.5% | North America, Europe, Japan | Long term (≥ 4 years) |
| Surging demand for natural and organic products | +0.4% | Global, premium segments in developed markets | Medium term (2-4 years) |
| Growing popularity of multi-functional skincare products | +0.3% | Asia-Pacific, North America | Short term (≤ 2 years) |
| Source: Mordor Intelligence | |||
Skin-microbiome Friendly Formulations
The growing focus on microbiome-friendly skincare has transformed emollient development, expanding beyond basic moisturization to support the skin's bacterial ecosystem. Skincare products with a pH below 5 increase skin microbiome diversity while reducing harmful bacteria, creating new requirements for emollient manufacturers. Companies select ingredients that include prebiotics and postbiotics to promote beneficial bacteria while maintaining the skin barrier. Studies show that fermented ingredients, such as Lactobacillus plantarum-processed botanicals, improve skin hydration and elasticity, demonstrating the effectiveness of microbiome-focused formulations. Regulatory acceptance of microbiome health as a cosmetic benefit is increasing. For instance, in March 2024, the Netherlands government allocated EUR 200 million from its National Growth Fund to support research on microbiomes and their commercial applications. These developments support market growth while meeting regulatory requirements for safety and efficacy claims.
Technological Advancements in Emollient Formulations
Advanced nanocarrier systems deliver active ingredients to targeted skin layers while improving their stability and bioavailability. Temperature, pH, and multi-stimuli-responsive systems control ingredient release based on skin conditions, improving product effectiveness. These technological developments address poor skin penetration and ingredient stability issues in emollient formulations. Companies use digital technologies and AI algorithms to create personalized skincare solutions by analyzing skin characteristics and matching appropriate emollient combinations. The evolution of plant-based emollients demonstrates this technological progression in the global emollient market, as evidenced by Sonneborn, LLC's introduction of SonneNatural NXG in November 2023. This plant-based emollient for personal care products contains specialized occlusive agents that improve formula stability, reflecting the industry's transformation toward advanced, sustainable formulation technologies. The integration of these technological innovations enables manufacturers to develop more effective and targeted emollient solutions that meet diverse consumer requirements across various applications.
Increasing Prevalence of Skin Illnesses
Skin conditions like atopic dermatitis, psoriasis, and acne continue to rise, driving demand for therapeutic-grade emollients that offer both cosmetic and medical benefits. The American Academy of Dermatology Association reports that acne affects up to 50 million Americans annually, making it the most common skin condition in the United States [1]Source: American Academy of Dermatology Association, "Skin Conditions by the Numbers", www.aad.org. Skin microbiome imbalances cause inflammation and damage the skin barrier, creating opportunities for manufacturers to develop emollients that address both visible concerns and underlying conditions. Consumers invest more in premium emollient products with proven clinical effectiveness due to the mental health effects of skin conditions, including anxiety and depression. Healthcare professionals actively recommend specific emollient formulations in treatment plans, which expands the market beyond cosmetic channels. The market has also grown as consumers recognize skin health in overall wellness, positioning emollients as preventive healthcare products rather than just cosmetic solutions.
Expansion Geriatric Population
Aging populations in developed markets are changing emollient demand patterns, as older consumers need specialized formulations for age-related skin conditions. Aging reduces skin microbiome diversity, which increases infection risk and affects barrier function, creating demand for emollients with enhanced protective properties. The geriatric segment shows a willingness to pay premium prices for products that demonstrate effectiveness in skin hydration, elasticity, and comfort. According to the Federal Interagency Forum on Child and Family Statistics, in 2024, 18.3% of the American population was 65 years or older, compared to 17.7% in 2023 [2]Source: Federal Interagency Forum on Child and Family Statistics, "Persons in selected age groups as a percentage of the total U.S. population", www.childstats.gov. Healthcare systems recognize that preventive skin care in elderly populations through effective emollient use reduces costs associated with skin breakdown and infections. Marketing approaches address the diverse nature of older consumers by focusing on psychographic and lifestyle factors rather than age alone. The combination of aging demographics and increased health consciousness drives consistent demand for emollients that offer both effectiveness and safety for sensitive, mature skin.
Restraints Impact Analysis of Emollient Market*
| Restraint | (~) % Impact on CAGR Forecast | Geographic Relevance | Impact Timeline |
|---|---|---|---|
| Complex and evolving regulatory landscape | -0.4% | Global, highest impact in the European Union and North America | Medium term (2-4 years) |
| Price sensitivity among consumers | -0.3% | Emerging markets, value-conscious segments | Short term (≤ 2 years) |
| Formulation challenges and compatibility issues | -0.2% | Global, technical manufacturing constraints | Long term (≥ 4 years) |
| Limited penetration in underdeveloped markets | -0.2% | Africa, parts of Asia-Pacific, South America | Long term (≥ 4 years) |
| Source: Mordor Intelligence | |||
Complex and Evolving Regulatory Landscape
The implementation of comprehensive regulatory frameworks, including MoCRA in the United States and REACH compliance in Europe, is increasing compliance costs and operational complexity for emollient manufacturers. The Food and Drug Administration (FDA)'s new facility registration and product listing requirements, effective July 2024, mandate detailed ingredient disclosures and safety documentation, creating challenges for smaller manufacturers. European regulations have intensified requirements for nanomaterials and endocrine-disrupting substances, with extensive safety assessments extending product launch timelines. The variation in regulatory standards across major markets requires companies to maintain multiple formulation variants, which increases development costs. Recent inspections by the European Chemicals Agency found that 6.4% of cosmetics contained hazardous chemicals, leading to enhanced compliance requirements. Additionally, regulatory uncertainty regarding new ingredients, such as bio-fermented emollients, has limited manufacturer investment in innovative formulations.
Price Sensitivity Among Consumers
Price sensitivity among consumers presents a substantial impediment to the global emollient market's expansion, particularly prevalent in emerging economies. Consumers in these regions demonstrate a strong inclination toward cost-effective solutions, limiting their ability to purchase premium-priced natural or high-quality emollient formulations. This constraint manifests more prominently during economic downturns or periods of stagnant disposable income, when consumers systematically shift toward basic personal care products instead of premium emollient-based alternatives. The elevated prices of premium emollient products create significant barriers to market penetration and impede the adoption of specialized formulations, including natural and organic variants. Trade data substantiates this price sensitivity impact. According to Trade Map, Malaysia's import value of hair care products decreased from USD 149.22 million in 2022 to USD 139.25 million in 2023 [3]Source: Trade Map, "Import value of hair care products in Malaysia", www.trademap.org. This decline explicitly demonstrates that consumer spending on emollient-containing products correlates directly with economic conditions and price fluctuations. As a result, manufacturers must implement strategic approaches to balance product quality and innovation with cost-effectiveness, ensuring market competitiveness while addressing the persistent challenge of price sensitivity in the global emollient market.
*Our forecasts treat driver/restraint impacts as directional, not additive. The impact forecasts reflect baseline growth, mix effects, and variable interactions.
Emollient Market Segment Analysis
By Form:
Liquid Oils Drive InnovationLiquid oils dominate the market with a 58.10% share in 2025, driven by their formulation flexibility and consumer preference for lightweight, fast-absorbing textures. The segment's prominence stems from the technical advantages of liquid emollients in modern cosmetic formulations, particularly in terms of spread ability and sensory properties. Semi-solid butters maintain a stable position in specialized applications requiring intensive moisturization, while waxes and pastes serve protective and long-lasting formulations. The powder and beads segment, though smaller, shows the highest growth rate at 6.07% CAGR through 2031, supported by advances in encapsulation technology and consumer interest in new application methods.
Manufacturing advances in powder-based emollients are creating new market opportunities, especially in color cosmetics and multifunctional products where liquid forms have limitations. BASF and other manufacturers are developing specialized production facilities for emollient innovations, including powder formulations with enhanced stability and controlled release properties. The integration of sustainability requirements is promoting the development of biodegradable powder emollients that maintain performance while meeting environmental standards. Smart delivery systems using powder and bead technologies enable personalized skincare applications where users can adjust emollient intensity to their specific needs.


By Source:
Bio-fermented Ingredients Gain MomentumPlant-derived emollients hold a 45.05% market share in 2025, driven by consumer demand for natural ingredients and regulatory support for sustainable sourcing practices. The segment's strength stems from established supply chains and proven safety profiles that enable regulatory approval across global markets. Petrochemical sources remain significant in cost-sensitive applications, while animal-derived ingredients experience declining use due to ethical concerns and regulatory restrictions. Bio-fermented emollients exhibit the highest growth rate at 5.74% CAGR, supported by technological advancements enabling consistent quality and scalable production.
Bio-fermentation technology is transforming ingredient sourcing strategies in the market. This transformation is evident in recent industry developments. For instance, in March 2025, Symrise AG introduced Mindera, a 100% plant-based product protection platform that provides multi-functional, broad-spectrum activity for personal care formulations. Manufacturers are increasingly adopting upcycled ingredients to meet sustainability requirements while maintaining cost efficiency. The combination of fermentation technology with traditional botanical extraction creates hybrid sourcing methods that balance performance and environmental considerations. Regulatory frameworks continue to evolve, with safety assessment protocols adapting to evaluate these new bio-fermented materials.
By Product Type:
Fatty Acid Esters Show PromiseIn the global emollient market, fatty alcohols maintain a commanding market position with a 29.15% share in 2025, attributed to their extensive industrial applications and established manufacturing infrastructure. Their market dominance is a result of validated formulation efficiency and widespread market acceptance across regions. Natural butters and oils command a significant presence in premium market segments where end-users demand identifiable, unprocessed ingredients. Despite market pressure from clean label trends, petrolatum and mineral oils maintain substantial market presence in pharmaceutical and therapeutic applications. Silicones and associated derivatives retain their market position in specialized applications requiring specific performance characteristics.
The fatty acid esters segment demonstrates substantial market expansion at 5.39% CAGR, driven by superior technical specifications and formulation capabilities across multiple industrial applications. These compounds exhibit enhanced stability parameters and active ingredient compatibility, positioning them as primary components in advanced formulations incorporating pharmaceutical-grade peptides, vitamins, and botanical extracts. Industrial manufacturers are implementing sustainable production methodologies for fatty acid esters while maintaining performance standards. Recent technological advancements in ester synthesis yield molecular structures that integrate conventional emollient functionality with enhanced active ingredient delivery mechanisms.
By Application:
Hair Care Accelerates GrowthSkin care applications account for 41.05% of the emollient market share in 2025, driven by their essential role in moisturizing and barrier protection formulations. The segment maintains its position through developments in anti-aging, sun protection, and therapeutic applications, which support premium pricing and consumer retention. Hair care applications demonstrate the highest growth rate at 5.08% CAGR through 2031, driven by consumer demand for targeted conditioning products addressing specific concerns such as dryness, frizz, and damage. Color cosmetics continue to generate consistent demand for emollients that enhance application and wear time.
Hair care growth reflects the shift toward products that target specific hair conditions rather than general conditioning. The pharmaceutical and over-the-counter (OTC) topical segments are expanding as cosmeceutical regulatory frameworks become more defined, creating opportunities for emollient manufacturers in therapeutic markets. The rise of multifunctional formulations is integrating traditional skin care and hair care categories, with emollients designed to deliver multiple benefits. Product development now focuses on creating specialized emollients for specific applications rather than general moisturization purposes.
Geography Analysis
APAC Emollient Market
Asia-Pacific commands 32.10% of the global emollients market in 2025. The region's middle-class population actively seeks skincare products, while rising disposable incomes in China, India, Japan, and Southeast Asia drive market expansion. Manufacturers benefit from robust production facilities and easy access to plant-based raw materials. Chinese consumers increasingly purchase premium skincare through digital platforms, while India's urban population demonstrates growing interest in personal care products. Japanese consumers demand innovative, high-performance emollient formulations, supporting the premium segment.
North America Emollient Market
North America leads regional growth with a 4.78% CAGR through 2031. Companies actively invest in premium product development and facility upgrades to meet MoCRA regulations. United States manufacturers implement extensive product reformulations to comply with new standards. Canadian consumers actively choose natural ingredients, creating a strong market for sustainable emollients. Mexico serves as a strategic manufacturing hub, benefiting from its growing middle class and proximity to the United States markets.
EMEA Emollient Market
European consumers actively demand premium and sustainable emollients, while strict regulations shape high-quality formulation standards. Manufacturers develop bio-based and circular economy emollients to meet sustainability requirements. REACH compliance drives companies to invest in safer alternatives to petrochemical ingredients. The Middle East and African markets show promise as urban populations embrace global beauty trends, though economic factors and distribution networks currently limit market expansion.

Regulatory Landscape
Regulation of emollients used in cosmetics and personal care continues to tighten across major markets, increasing documentation and reformulation work for global suppliers. In the United States, FDA implementation of the Modernization of Cosmetics Regulation Act of 2022 (MoCRA) expands oversight through facility registration, product listing, safety substantiation, and records access, with industry activity centered on meeting requirements that became effective from July 2024 onward.
In Europe, Regulation (EC) No 1223/2009 continues to be updated via substance-specific amendments, influencing ingredient selection and allowable use conditions for emollient-containing formulations. In 2026, the EU adopted Commission Regulation (EU) 2026/78 (January 2026) addressing substances classified as carcinogenic, mutagenic, or toxic for reproduction (CMRs), and Commission Regulation (EU) 2026/909 (April 2026) amending 1223/2009 to regulate or restrict substances including Benzyl Salicylate, Triphenyl Phosphate, Aluminium, water-soluble zinc salts, and DHHB. The United Kingdom also updated its cosmetics restrictions through The Cosmetic Products (Restriction of Chemical Substances) (No. 2) Regulations 2025, which came into force in January 2026 and amended conditions around benzophenone-3, reinforcing the need for region-specific compliance strategies.
Competitive Landscape
The emollients market exhibits moderate fragmentation. The market structure comprises specialized suppliers and established chemical companies operating across regions. Major participants include BASF SE, Cargill Incorporated, Croda International plc, Stepan Company, and Evonik Industries AG, which maintain manufacturing capabilities and distribution networks. This fragmentation enables large manufacturers to expand through acquisitions while allowing smaller companies to establish a presence in niche segments.
Market participants demonstrate significant research and development investments for technological advancement in emollient development. Companies focus on addressing consumer requirements for sustainable, effective, and multifunctional products. The implementation of vertical integration strategies and geographic expansion through distribution partnerships remains essential while maintaining production standards.
Market opportunities exist in bio-fermented ingredients, microbiome-friendly formulations, and specialized applications. New entrants utilize biotechnology and sustainable chemistry approaches to establish market positions, particularly in premium segments. The competitive environment is influenced by regulatory requirements, raw material accessibility, and regional consumer preferences, driving continuous product development and market adaptation.
Emollient Industry Leaders
-
BASF SE
-
Cargill, Incorporated
-
Croda International plc
-
Stepan Company
-
Evonik Industries AG
- *Disclaimer: Major Players sorted in no particular order
Emollient Market Companies Covered in this Report
- BASF SE
- Cargill, Incorporated
- Croda International plc
- Stepan Company
- Evonik Industries AG
- The Lubrizol Corporation
- AAK AB
- Ashland Inc.
- Avril Group
- Clariant AG
- Eastman Chemical Company
- Sasol Limited
- Emery Oleochemicals
- Sophim Iberia S.L
- Symrise AG
- Dow Chemical Company
- Kao Corporation
- Matangi Industries
- Vantage Specialty Chemicals, Inc.
- Esteem Industries Private Limited

Market Opportunities and Future Outlook
Opportunities are most visible in silicone-alternative and biodegradable emollient systems that help brands connect performance claims with tighter ingredient scrutiny and sustainability demands. Capacity and process investments support this shift, including Evonik's Steinau, Germany plant inaugurated in September 2024 that uses enzymatic esterification for cosmetic emollients with a reduced climate footprint, and BASF's confirmed specialty emollient and emulsifier capacity expansion at its Duesseldorf, Germany hub (April 2026), positioned around demand for silicone-alternative ingredients.
Innovation pathways are also opening room for suppliers that can combine sensory performance with delivery and barrier-support positioning in skin care and hair care. Amorepacific highlighted nano-delivery advances by developing a 20 nm system (Lipo3Ex) for cosmetic actives and integrating it into IOPE and Primera products (May 2026), supporting demand for emollients compatible with advanced delivery formats. On the customer-facing side, Cargill showcased nature-derived emulsification technologies at PCHi 2026 in Hangzhou (March 2026), reflecting increased formulation activity in Asia-Pacific where emollients are tuned for lightweight textures and clean-label narratives. Bio-fermented and biocatalysis-enabled emollients also provide a route to consistent quality and traceability that aligns with the documentation expectations created by MoCRA and the EU cosmetics framework.
Recent Industry Developments in Emollient Market
- June 2026: BASF launched SkinNexus Collag3n, a 100% human-identical recombinant Collagen III fragment developed with Bota Biosciences for personal care applications. The product expands the toolbox for premium formulations that combine sensorial benefits with bio-identical positioning, supporting differentiation in skin health and barrier-focused product concepts.
- November 2025: Croda shared performance data indicating Crodabond CSN can act as an SPF booster in sun care by improving film formation and UV filter distribution. This creates formulation leverage for brands targeting high-SPF and UVA performance while tuning sensory profile and potentially optimizing the overall UV filter system.
- April 2024: Cargill launched BotaniDesign, a 100% natural-origin, readily biodegradable emollient positioned as a 1:1 drop-in replacement for conventional petroleum jelly. The launch supports reformulation programs seeking to replace petro-based occlusives with plant-derived alternatives without sacrificing familiar texture and performance.


Emollient Market Report Scope and Research Methodology
Market Definition and Coverage
This market covers emollient ingredients used in personal care and related topical products to soften and smooth skin and hair. They are purchased as raw materials by formulators and brand owners. The sizing is done on the value of emollients sold into end-use formulations across major regions.
Scope exclusions: It excludes finished consumer product sales values, contract manufacturing fees, and most non-cosmetic industrial uses where the ingredient is not used for skin or hair feel performance.
Segments Covered in This Report
-
By Form
- Liquid Oils
- Semi-solid Butters
- Waxes and Pastes
- Powder and Beads
-
By Source
- Plant-derived
- Petro-chemical
- Animal-derived
- Bio-fermented
- Upcycled Ingredients
-
By Product Type
- Fatty Alcohols
- Fatty Acid Esters
- Natural Butters and Oils
- Petrolatum and Mineral Oils
- Silicones and Derivatives
-
By Application
- Skin Care
- Hair Care
- Color Cosmetics
- Pharmaceuticals/OTC Topicals
- Other Applications
-
By Geography
-
North America
- United States
- Canada
- Mexico
- Rest of North America
-
Europe
- Germany
- United Kingdom
- Italy
- France
- Spain
- Netherlands
- Poland
- Belgium
- Sweden
- Rest of Europe
-
Asia-Pacific
- China
- India
- Japan
- Australia
- Indonesia
- South Korea
- Thailand
- Singapore
- Rest of Asia-Pacific
-
South America
- Brazil
- Argentina
- Colombia
- Chile
- Peru
- Rest of South America
-
Middle East and Africa
- South Africa
- Saudi Arabia
- United Arab Emirates
- Nigeria
- Egypt
- Morocco
- Turkey
- Rest of Middle East and Africa
-
North America
Data Sources, Market Sizing, and Validation
Desk Research
Desk work started with clear boundary checks on what counts as an emollient in formulations and how it is traded and reported. We pulled foundational signals from public sources such as the US FDA cosmetics resources, the European Commission cosmetic ingredient and regulation pages, the US International Trade Commission trade data, and UN Comtrade for relevant chemical groups.
To keep assumptions realistic, we also reviewed company annual reports, investor presentations, and reputable press coverage on capacity additions and feedstock movements. Where needed, paid subscriptions for company financials and news intelligence, plus patent databases, were used to cross-check innovation activity and ingredient positioning. These examples are illustrative, and many other public and internal references were used for data collection, validation, and clarification.
Primary Interviews and Surveys
Primary work focused on speaking with people who influence emollient demand and pricing, including raw material suppliers, formulators, distributors, and procurement and product teams at personal care brands. We used these conversations to validate application splits (skin care, hair care, color cosmetics, and topical products), sanity-check price movements for key chemistries, and confirm where substitution is actually happening across regions.
Distribution of primary research fieldwork respondents
| Company type | Respondent position | Region |
|---|---|---|
| Top tier: 30% | CXOs: 12% | APAC: 43% |
| Mid tier: 51% | Functional/Unit leaders: 31% | EMEA: 36% |
| Smaller Players: 19% | Managers: 57% | Americas: 21% |
Market-Sizing & Forecasting
Sizing is built using a top-down approach where personal care manufacturing and consumption indicators are translated into an emollient demand pool, and then converted to value using region-wise pricing. The outputs are then corroborated with selective bottom-up approximations, such as supplier revenue exposure checks, channel conversations on volumes, and sampled price per kilogram ranges applied to estimated usage intensity.
A few practical inputs used in the model include skin care and hair care formulation activity, changes in natural versus synthetic preference, the mix shift between liquid oils and semi-solids, feedstock-linked pricing trends for common chemistry groups, and regional growth in beauty and topical care consumption. When gaps appear in bottom-up checks, they are handled through conservative ranges and then tightened using interview feedback on typical inclusion rates and substitution limits.
For forecasting, scenario analysis is used around price and mix, supported by regression-based relationships between end-use growth indicators and observed emollient demand direction. Assumptions are refreshed each cycle using what interviewees expect on reformulation pace, regulatory pressure, and cost pass-through behavior.
Data Validation & Update Cycle
Validation is done through triangulation across independent signals, where modeled demand, implied pricing, and regional growth are checked for consistency. Large variances trigger a deeper review of unit conversions, currency timing, and whether a specific chemistry or application was double counted or missed, and then we re-contact sources when a mismatch cannot be explained by public information.
Before sign-off, the model is reviewed in steps so outliers are caught early, followed by a final cross-check against recent news and trade movements. Reports are refreshed annually, with interim updates when material events occur such as major capacity changes, regulation shifts, or sharp feedstock moves. Right before delivery, a final pass is completed so the view reflects the latest available inputs.
Mordor Intelligence's Emollient Market Size Measured Against Other Published Estimates
Published market sizes for emollients often vary because the product boundary can be drawn in different ways, and because some studies lean more on broad cosmetics totals without clean ingredient conversion steps. Differences also show up when the base year is not aligned, or when currency and price progression are handled with simplified assumptions.
By tracking application-level demand signals and refreshing price and mix assumptions each update, Mordor Intelligence keeps the 2026 value anchored to what is actually consumed in skin care, hair care, cosmetics, and topical uses, instead of counting adjacent ingredient groups as automatic add-ons. Another common gap driver is the inclusion of wider chemical categories that are not primarily used for emolliency, which can inflate totals when mapped using generic shares rather than validated formulation usage.
Benchmark comparison
| Source | Market Size | Gaps in Research Methodology |
|---|---|---|
| Mordor Intelligence | USD 1.77 B (2026) | |
| Industry Publisher A | USD 1.50 B (2024) | Uses an earlier base year and a broader definition set, which can shift totals when ingredient inclusion is mapped with high-level category shares and limited validation on application splits. |
| Research Outlet B | USD 1.78 B (2024) | Anchors the size to 2024 and may apply uniform growth and pricing across regions, which can miss the impact of mix changes between liquid and semi-solid forms and chemistry substitution over time. |
The spread in the table mainly comes from timing and boundary choices, followed by how prices and application usage are converted into value. In our work, the assumptions are kept visible in the model, and the totals are repeatedly checked against trade, pricing direction, and interview feedback so the estimate stays traceable and repeatable.


Key Questions Answered in the Report
What is the current size of the emollients market?
The emollients market is valued at USD 1.77 billion in 2026 and is projected to reach USD 2.19 billion by 2031.
Which form segment dominates the emollients market?
Liquid oils lead, accounting for 58.10% of global revenue in 2025.
Which source category is growing the fastest?
Bio-fermented emollients are expanding at a 5.74% CAGR through 2031 due to sustainability and supply-security advantages.
Why is North America the fastest-growing region?
Premiumization trends and compliance spending linked to the MoCRA regulations drive a 4.78% CAGR in North America.
Page last updated on:


 Your data is secure and never sold or shared.


