Embedded Security Market Size and Share
Market Overview
| Study Period | 2020 - 2031 |
|---|---|
| Market Size (2026) | USD 10.11 Billion |
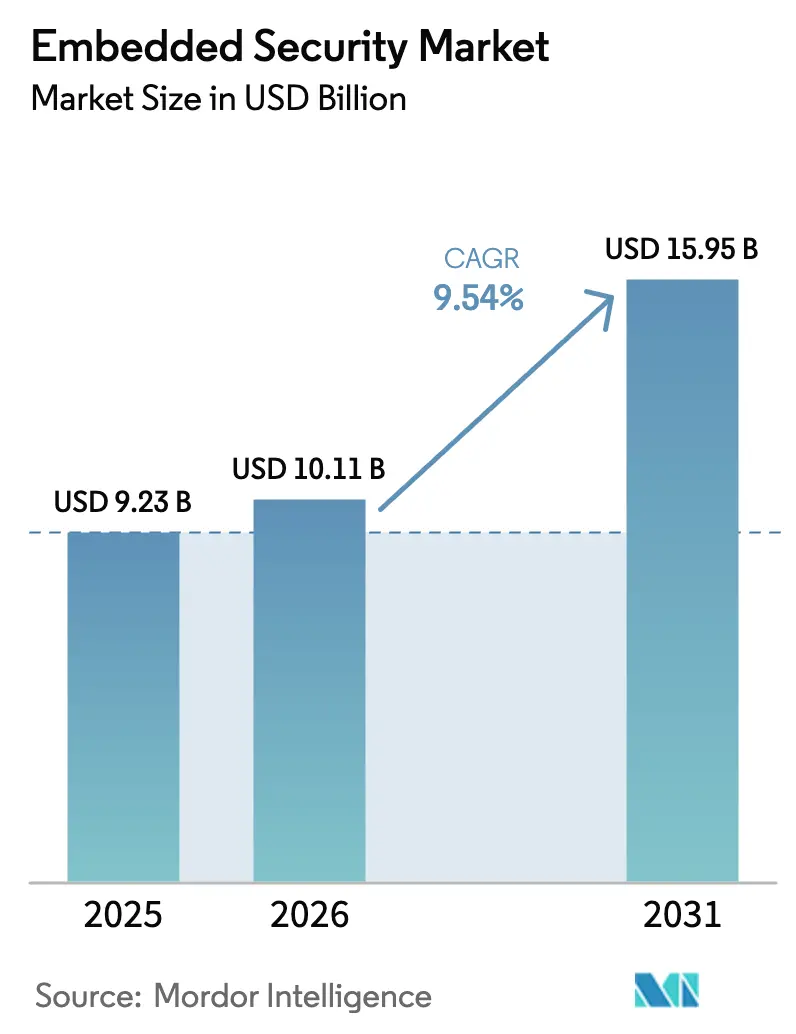
| Market Size (2031) | USD 15.95 Billion |
| Growth Rate (2026 - 2031) | 9.54% CAGR |
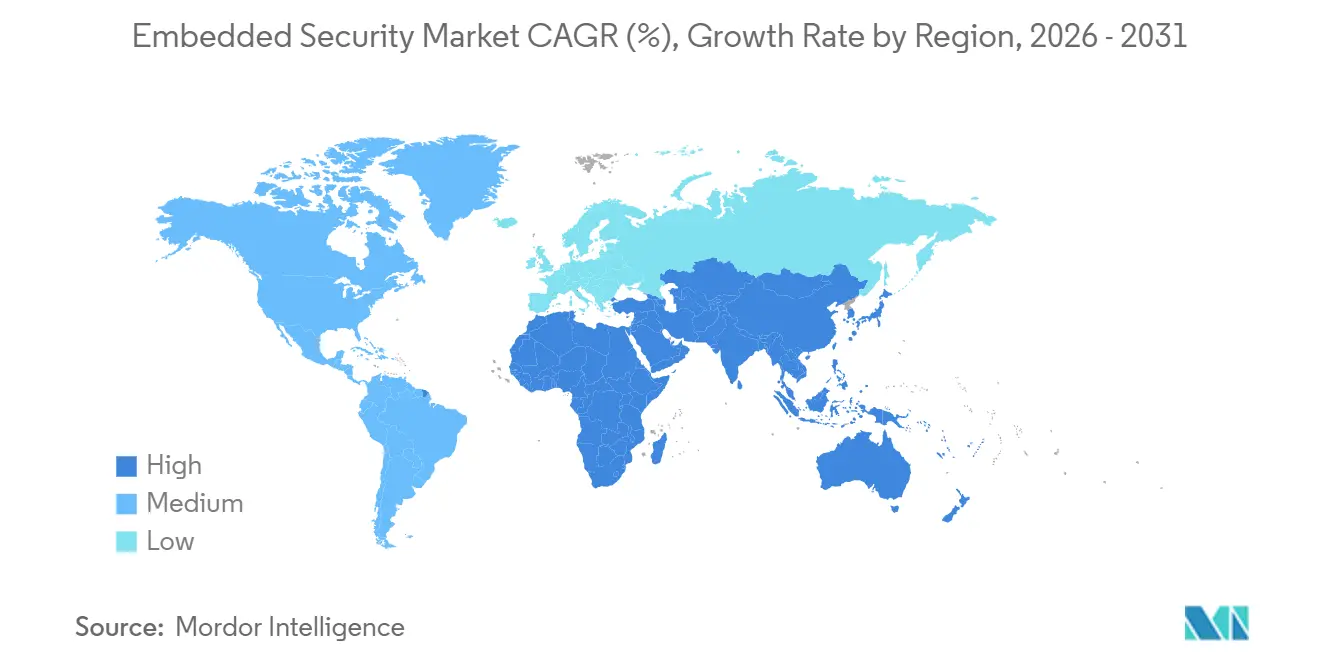
| Fastest Growing Market | Middle East |
| Largest Market | Asia Pacific |
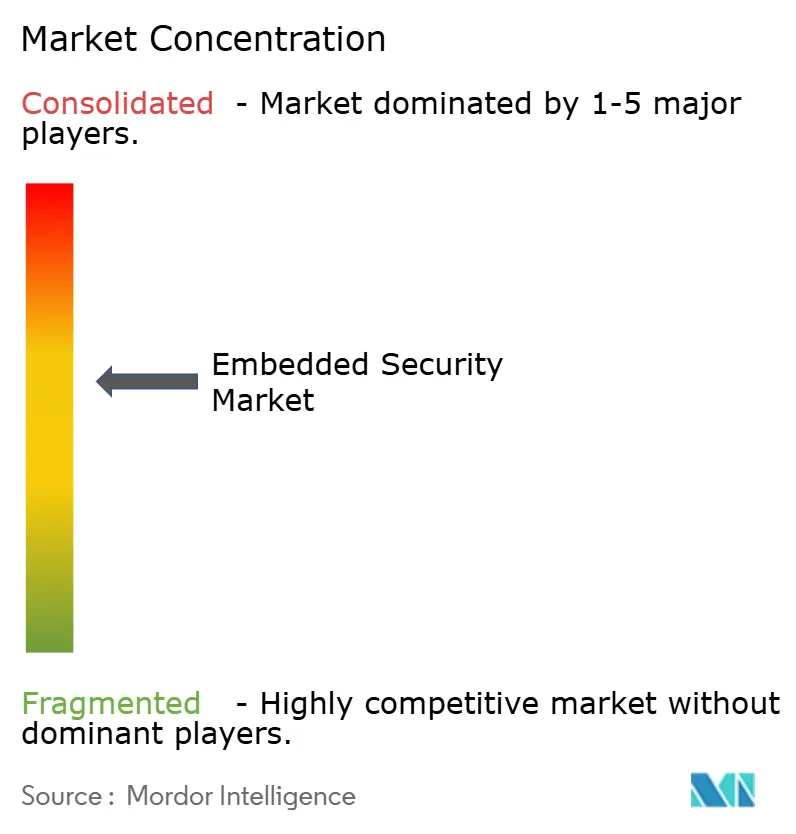
| Market Concentration | Medium |
Major Players *Disclaimer: Major Players sorted in no particular order Image © Mordor Intelligence. Reuse requires attribution under CC BY 4.0. | |
Embedded Security Market Analysis by Mordor Intelligence
The Embedded Security Market size is projected to expand from USD 9.23 billion in 2025 and USD 10.11 billion in 2026 to USD 15.95 billion by 2031, registering a CAGR of 9.54% between 2026 to 2031. Heightened data-sovereignty rules, the European Union’s Cyber Resilience Act, and UN Regulation 155 have transformed hardware-root-of-trust adoption from an optional safeguard into a design mandate, especially for edge devices inside connected vehicles and industrial controllers. Automotive electrification triples the number of electronic control units per vehicle, expanding silicon content while widening the attack surface. Cloud HSM instances keep growing because enterprises favor elastic capacity, yet the same customers embed secure elements locally to meet data-localization statutes. Demand also reflects the spread of FIDO passkeys, eSIM provisioning, and post-quantum cryptography pilots, each of which elevates hardware-based credential storage. Asia Pacific anchors fabrication capacity, while the Middle East’s smart-city build-outs make it the fastest-expanding geography.
Key Report Takeaways
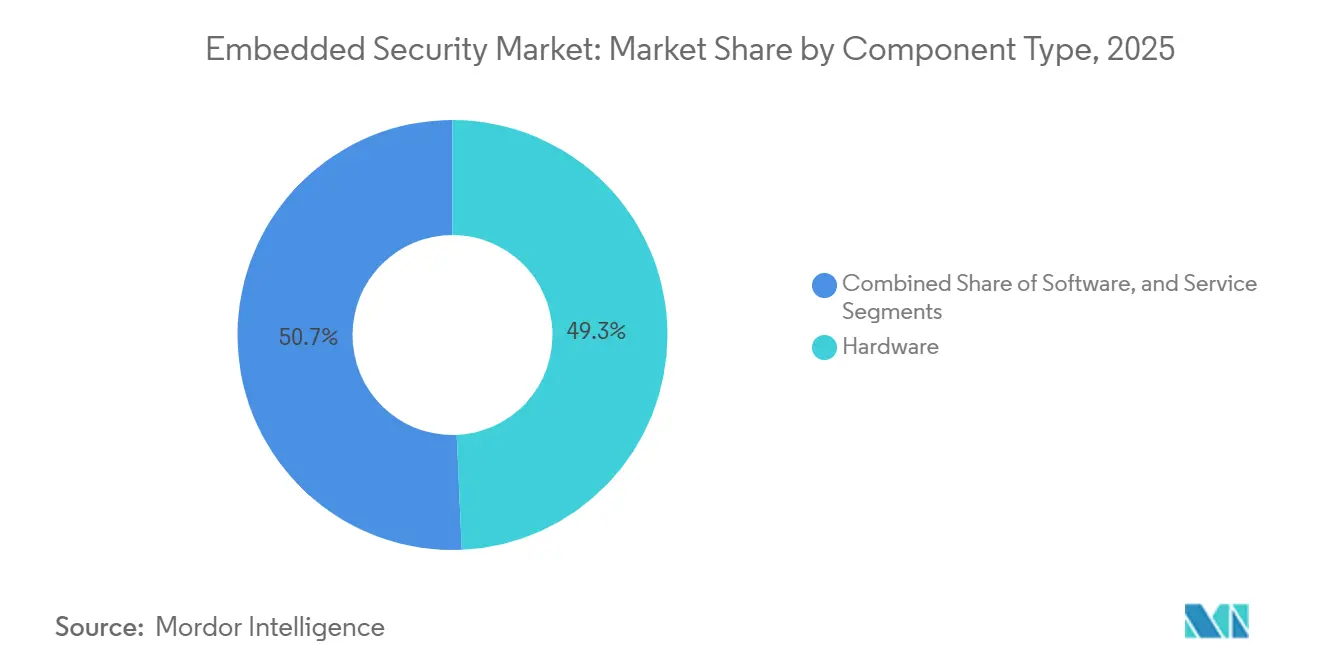
- By component type, hardware maintained a 49.32% embedded security market share in 2025, whereas services recorded the highest 11.42% CAGR to 2031.
- By deployment, cloud led with 57.52% revenue share in 2025, and it is advancing at a 12.62% CAGR through 2031.
- By application, payment captured 36.64% of the embedded security market size in 2025, while authentication is poised for a 10.64% CAGR to 2031.
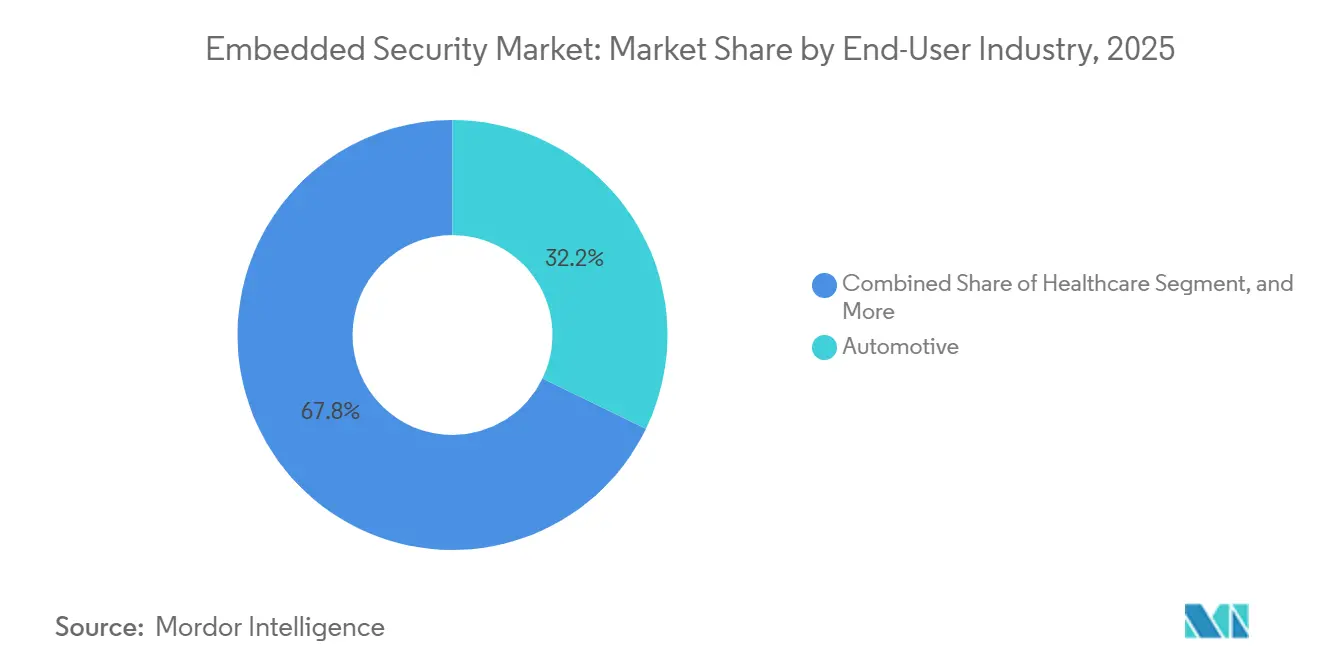
- By end-user industry, automotive held 32.18% of 2025 demand, whereas healthcare is forecast to expand at a 10.22% CAGR between 2026 and 2031.
- By geography, Asia Pacific commanded a 40.42% revenue share in 2025; the Middle East is on track for the fastest 11.52% CAGR to 2031.
Note: Market size and forecast figures in this report are generated using Mordor Intelligence’s proprietary estimation framework, updated with the latest available data and insights as of January 2026.
Global Embedded Security Market Trends and Insights
Drivers Impact Analysis*
| Driver | (~) % Impact on CAGR Forecast | Geographic Relevance | Impact Timeline |
|---|---|---|---|
| Rapid Electrification and ADAS Adoption in Automotive ECUs | +2.1% | Europe, China, North America | Medium term (2-4 years) |
| EMVCo Contactless Payment Mandates for Cards and POS Terminals | +1.8% | Europe and Asia Pacific | Short term (≤ 2 years) |
| Expanding IoT Edge Nodes in Smart-Home and Industrial Settings | +1.6% | Asia Pacific core, spill-over to North America and Europe | Medium term (2-4 years) |
| Post-Quantum-Crypto Migration Roadmaps for Long-Life Controllers | +1.3% | North America and EU, pilots in Asia Pacific | Long term (≥ 4 years) |
| EU Cyber-Resilience Act Requiring Hardware Roots of Trust | +1.5% | Europe, ripple to Middle East and Asia Pacific | Short term (≤ 2 years) |
| Digital Battery Passports Creating Secure-Element Demand | +1.2% | Europe, uptake in China and North America | Medium term (2-4 years) |
| Source: Mordor Intelligence | |||
Rapid Electrification And ADAS Adoption In Automotive ECUs
Battery-electric platforms integrate up to 100 electronic control units, each obligated to support secure boot, encrypted firmware updates, and authenticated over-the-air patches. Infineon confirmed 18% annual growth in automotive security-controller revenue as Tier-1 suppliers embed AURIX TC4x devices in battery-management and zonal architectures.[1]Infineon Technologies, “Annual Report 2024,” infineon.com Centralized compute designs such as Tesla’s Hardware 4 concentrate cryptographic workloads, lifting per-vehicle silicon value. Advanced driver-assistance sensors exchange safety-critical data over Ethernet backbones, so OEMs insert secure gateways with intrusion-detection firmware. Stellantis and STMicroelectronics are co-developing vehicle-to-grid modules that embed dedicated secure elements, signaling how bidirectional charging extends security beyond the cabin.
EMVCo Contactless Payment Mandates For Cards And POS Terminals
EMVCo’s Contactless Kernel 3.0 forces new payment terminals shipped after January 2025 to implement relay-attack mitigation and biometric verification, compelling dual-interface secure elements with NFC controllers. Mastercard reported 78% contactless penetration in Europe and 65% in Asia Pacific, leaving North America at 42% and primed for hardware refresh.[2]Mastercard, “Form 10-K Annual Report 2024,” mastercard.com PCI PTS 7.0 simultaneously tightens physical-tamper rules, pushing terminal vendors from generic processors toward certified secure chips. NXP saw a 12% sequential lift in secure-payment IC revenue on India’s RuPay card roll-out and Brazil’s Pix expansion. Embedded secure elements also power tokenized wallets in eSIM-enabled smartphones, a segment that shipped 1.2 billion units in 2024.
Expanding IoT Edge Nodes In Smart-Home And Industrial Settings
Matter-certified devices exceeded 500 models by September 2024, each storing onboarding keys inside secure elements to guarantee encrypted Thread and Wi-Fi sessions.[3]Mastercard, “Form 10-K Annual Report 2024,” mastercard.com Industrial vendors mirror the trend to comply with IEC 62443; Siemens integrated TPM 2.0 modules into new SIMATIC S7-1500 PLCs, enabling encrypted links to cloud analytics. Hardware-rooted identity boosts cyber-insurance eligibility and reduces compliance audits, offsetting a USD 2-5 component premium. AWS IoT Device Defender offers discounted tiers for hardware-verified endpoints, creating a virtuous cycle.
Post-Quantum-Crypto Migration Roadmaps For Long-Life Controllers
NIST finalized FIPS 203, 204, and 205 algorithms in August 2024, triggering redesigns for controllers that must remain secure through the 2040s. Infineon’s OPTIGA Trust M MTR and Qualcomm’s QCC730 audio SoC already integrate hybrid classical-quantum key exchange. The trade-off is heavier code and higher clock cycles, nudging OEMs toward Cortex-M33 cores with larger SRAM. U.S. federal agencies must inventory cryptographic systems by 2025, cascading quantum-safe requirements to contractors and utilities.
Restraints Impact Analysis*
| Restraint | (~) % Impact on CAGR Forecast | Geographic Relevance | Impact Timeline |
|---|---|---|---|
| High ASP Gap Versus Commodity Microcontrollers in Cost-Sensitive IoT | -1.4% | Global, acute in Asia Pacific consumer IoT | Short term (≤ 2 years) |
| Fragmented Standards Across Verticals (GlobalPlatform vs. TCG) | -0.9% | Global, regulatory divergence in major regions | Medium term (2-4 years) |
| Supply-Chain "Ghost-Foundry" Risk Limiting Qualified Sources | -0.7% | North America and Europe defense markets | Medium term (2-4 years) |
| Shortage of Secure-Element Firmware Verification Skill Sets | -0.6% | Global, pronounced in healthcare and industrial | Long term (≥ 4 years) |
| Source: Mordor Intelligence | |||
High ASP Gap Versus Commodity Microcontrollers In Cost-Sensitive IoT
Secure MCUs cost USD 1.50-3.00 compared with USD 0.30-0.50 generic parts, a premium that squeezes consumer-IoT gross margins. Attach rates stay below 25% in smart-home accessories despite available STM32L5 and STM32U5 devices that integrate Arm TrustZone. Higher quiescent current also shortens battery life by up to 30%. Microchip’s PIC32CM LS00, priced at USD 0.85, narrows the gap but still forces product re-certification.
Fragmented Standards Across Verticals
Payment and telecom ecosystems adopt GlobalPlatform, whereas automotive and PC suppliers lean on Trusted Computing Group TPM 2.0, fragmenting silicon roadmaps. Vendors like NXP must sustain both A71CH secure elements and discrete TPMs, duplicating inventory and qualification expense. China’s mandate for SM2/3/4 algorithms adds region-specific variants, further splitting volumes. FIDO Alliance’s Device Onboard aims to bridge gaps but had fewer than 50 certified products by late 2024.
*Our forecasts treat driver/restraint impacts as directional, not additive. The impact forecasts reflect baseline growth, mix effects, and variable interactions.
Segment Analysis
By Component Type: Services Outpace Hardware On Migration Complexity
The embedded security market size for hardware reached nearly half of total revenue in 2025, yet services are rising faster as organizations confront 12- to 18-month Common Criteria evaluations. Hardware margins compress in mature payment and SIM segments, while post-quantum-ready secure elements and TPMs keep absolute revenue solid. Software tools, such as static analyzers and key-management middleware, close gaps that once favored turnkey firmware and empower OEMs to retain intellectual property.
Services growth reflects a scarcity of side-channel experts and certified evaluators, driving consulting day rates above USD 2,000. Thales, Rambus, and Synopsys now wrap lifecycle management, certification artifacts, and security audits into recurring packages, blurring the line between silicon sale and subscription. As platform-as-a-service offerings mature, the embedded security market welcomes more hybrid revenue models that bundle chips, firmware, and cloud dashboards in a single contract.


By Application: Authentication Gains Momentum As Passwordless Logins Spread
Payment still leads the embedded security market with a 36.64% slice of revenue in 2025, but authentication posts a double-digit growth trajectory supported by phishing-resistant passkey mandates. Governments and cyber-insurers increasingly penalize single-factor logins, prompting enterprises to adopt FIDO2 hardware tokens and device-bound keys. Content-protection hardware stabilizes as studios pivot to software-based multi-DRM inside trusted execution environments, trimming demand for legacy set-top boxes.
Authentication’s ascent is amplified by cloud providers that require passkeys for administrative consoles and by healthcare reforms that call for multi-factor access to electronic health records. The shift aligns with hardware that can store both classical and lattice-based keys, future-proofing investment. As a result, the embedded security market size tied to authentication is set to narrow the gap with payment by the end of the decade, particularly in regions that lag in contactless penetration.
By End-User Industry: Healthcare Accelerates On FDA Guidance
Automotive captured 32.18% of 2025 revenue, reflecting deep ECU penetration, but growth is flattening as premium models reach saturation. Healthcare, by contrast, carries the fastest 10.22% CAGR as regulators push cryptographic device identity for networked pumps, ventilators, and imaging systems. Embedded secure elements reduce recall risk and support encrypted over-the-air therapy adjustments, lifting per-device silicon value.
Flagship phones integrate secure enclaves at near-100% attach rates, whereas budget handsets and smart-home accessories remain cost-pressured. Telecommunications infrastructure adopts hardware roots of trust for 5G base stations, yet long capital-replacement cycles curb growth. Defense and space payloads pay the highest ASPs, but export controls limit volumes, keeping their share small within the embedded security industry.
By Deployment: Cloud Dominates Yet Coexists With On-Premise Gateways
Cloud options owned 57.52% share in 2025 and clock a 12.62% CAGR, propelled by instant provisioning and elastic capacity. Amazon, Microsoft, and Google each rolled out FIPS 140-3 Level 3 HSM instances, luring regulated sectors that once favored data-center appliances. Even so, automotive plants and payment-network switches still host on-premise HSMs for root-key ceremonies and ultra-low-latency operations.
Firmware signing occurs on-premise, while distribution and certificate rotation move to the cloud. This dual model explains why the embedded security market continues to sell hardware modules for physical vaults even as cloud revenue accelerates. Vendors now differentiate by bundling tokens that operate seamlessly across both realms, cementing customer lock-in.
Geography Analysis
Asia Pacific controlled 40.42% of embedded security market revenue in 2025. Taiwan and South Korea supply leading-edge secure-element wafers, while China’s Multi-Level Protection Scheme forces domestic cryptographic IP, lifting local demand. Despite its size, the region’s growth moderates as mature smartphone and payment-card penetration reduces incremental volume.
The Middle East is the fastest-growing geography at 11.52% CAGR, fueled by Saudi Arabia’s NEOM smart-city contracts exceeding USD 500 million and the UAE Cybersecurity Decree that mandates hardware encryption for critical infrastructure. Projects span smart grids, autonomous transit, and national identity layers, creating a pipeline for secure elements across industrial, consumer, and civic devices.
North America and Europe jointly contribute roughly 45% of revenue. Both regions face slower growth due to mature automotive and payment ecosystems, but they lead post-quantum pilots and industrial-IoT retrofits. Europe’s Cyber Resilience Act forces secure-element integration yet depends on Asian fabs for supply, exposing geopolitical risk. In the United States, defense restrictions confine sourcing to DMEA-trusted foundries, tightening supply but ensuring provenance. South America and Africa remain early-stage markets; Brazil’s Pix payment and Nigeria’s eNaira CBDC offer pockets of opportunity yet lack scale to shift global rankings.

Competitive Landscape
The top five vendors, Infineon, NXP, STMicroelectronics, Qualcomm, and Samsung, command about 55-60% of revenue, indicating moderate concentration. These incumbents rely on broad certification libraries to cut customer time-to-market. Cloud hyperscalers, however, design custom security processors that offload cryptographic workloads from traditional secure elements, diluting share. Startups such as PQShield and Secure-IC focus on lattice-based accelerators, positioning themselves for post-quantum transitions.
Differentiation is moving from transistor counts to lifecycle services. NXP’s EdgeLock 2GO and Infineon’s subscription bundles tie silicon to cloud provisioning, generating recurring revenue and raising switching costs. FPGA vendors like Lattice add roots-of-trust to programmable logic, displacing discrete TPMs in telecom racks. Infineon logged 47 post-quantum-related patents in 2024, while Qualcomm submitted 32 covering mobile secure-enclave architectures.
Standards-body participation provides avenue for influence; Infineon and NXP chair work groups in both TCG and GlobalPlatform, enabling them to steer specifications toward their roadmaps. Meanwhile, Arm’s acquisition of Certus signals upstream integration of secure-boot IP directly into Cortex-M cores, a move that could marginalize low-end discrete secure elements in cost-sensitive IoT gear.
Embedded Security Industry Leaders
Infineon Technologies AG
NXP Semiconductors NV
STMicroelectronics NV
Microchip Technology Inc.
Samsung Electronics Co. Ltd.
- *Disclaimer: Major Players sorted in no particular order

Recent Industry Developments
- January 2026: Infineon earmarked EUR 200 million (USD 220 million) to expand its Regensburg fab, boosting automotive secure-microcontroller capacity by 30% for UN R155 demand. Production is slated for Q3 2027.
- December 2025: NXP and TSMC began joint development of 16 nm secure elements with integrated post-quantum accelerators, targeting engineering samples in Q2 2026.
- November 2025: Qualcomm introduced the QCC5181 Bluetooth audio SoC with a secure unit that supports FIDO Device Onboard and lattice-based key exchange; mass production began October 2025.
- October 2025: STMicroelectronics and Stellantis formed a USD 150 million joint venture to build secure vehicle-to-grid modules, with production at ST’s Catania fab from Q4 2026.


Research Methodology Framework and Report Scope
Market Definitions and Key Coverage
Our study defines the embedded security market as the global spend on hardware-anchored and companion software safeguards that are permanently built into microcontrollers, secure elements, trusted platform modules, or comparable silicon blocks, together with device-resident firmware that activates cryptographic, authentication, and secure-boot functions across connected products.
Scope Exclusions: Stand-alone network appliances, host-based antivirus suites, and purely cloud security services sit outside this definition.
Segmentation Overview
- By Component Type
- Hardware
- Software
- Services
- By Application
- Payment
- Authentication
- Content Protection
- Other Applications
- By End-User Industry
- Automotive
- Healthcare
- Consumer Electronics
- Telecommunications
- Aerospace and Defense
- Other End-User Industries
- By Deployment
- On-Premise
- Cloud
- By Geography
- North America
- United States
- Canada
- Mexico
- South America
- Brazil
- Argentina
- Rest of South America
- Europe
- Germany
- United Kingdom
- France
- Italy
- Spain
- Russia
- Rest of Europe
- Asia Pacific
- China
- Japan
- India
- South Korea
- Australia
- Rest of Asia Pacific
- Middle East
- Saudi Arabia
- United Arab Emirates
- Turkey
- Rest of Middle East
- Africa
- Nigeria
- Egypt
- Rest of Africa
- North America
Detailed Research Methodology and Data Validation
Primary Research
Multiple discussions with chip vendors, tier-1 module suppliers, OEM firmware leads, compliance auditors, and regional regulators helped us verify use-case penetration, average selling prices, and regulation-driven replacement cycles across North America, Europe, Asia-Pacific, and Latin America. Insights from these interviews corrected early volume assumptions and clarified adoption lags in mid-tier consumer electronics.
Desk Research
We reviewed authoritative, open datasets such as NIST IR 8259A guidance, ETSI EN 303 645 baseline requirements, UN R155 automotive cyber rules, Eurostat customs flows for secure ICs, and ENISA threat-landscape notes, which are then matched with shipment series from WSTS, IDC handset trackers, and OICA vehicle production tallies. Our analysts further extracted company revenue splits and fabrication capacities from D&B Hoovers, plus patent intensity cues from Questel to map innovation hotspots. A similar scan of annual reports, FCC filings, and industry association white papers rounded out the secondary picture. The sources listed are illustrative; many additional references support data validation.
Market-Sizing & Forecasting
We built a top-down model that starts with annual secure-IC production, cross-border trade values, and connected-device stock, which are then segmented by application pools (payment, authentication, content protection). Select bottom-up checks, supplier roll-ups, and sampled ASP × unit pairings anchor reality inside acceptable error bands. Key variables include secure MCU unit shipments, average ASP erosion rates, IoT device install base, electric-vehicle production, and regulatory compliance deadlines. Multivariate regression links these drivers to historical market revenue before scenario curves (base, high-regulation, and cost-down) project 2025-2030 outcomes. Data gaps in emerging regions are bridged through prevalence ratios taken from comparable device classes.
Data Validation & Update Cycle
Modeled outputs pass three rounds of anomaly screening, peer review, and senior sign-off. Variances above predefined thresholds trigger a re-contact of select experts. Reports refresh each year, with mid-cycle tweaks when material events, such as chip bans or new cyber legislation, shift demand signals.
Why Our Embedded Security Baseline Commands Reliability
Published estimates often diverge because firms pick different component mixes, refresh cadences, and currency bases, which can inflate or suppress totals before the analyst even runs a forecast.
Key gap drivers include whether services revenue is bundled, how far down the supply chain device counts are sampled, the treatment of one-time programming fees, and in some studies, the omission of fast-growing Asia-Pacific volumes. Mordor analysts report 2025 as the anchor year and adjust every value to constant 2024 USD, while several peers use earlier baselines or wider cyber scopes that blur comparability.
Benchmark comparison
| Market Size | Anonymized source | Primary gap driver |
|---|---|---|
| USD 9.25 B (2025) | Mordor Intelligence | - |
| USD 10.20 B (2024) | Global Consultancy A | Bundles device-lifecycle services and secure-software royalties |
| USD 5.60 B (2024) | Trade Journal B | Excludes cloud-connected modules and uses limited geography |
| USD 7.40 B (2023) | Industry Association C | Older base year and slower refresh cadence |
Taken together, the comparison shows that Mordor Intelligence offers a balanced, up-to-date baseline tied to transparent variables and repeatable steps, giving decision-makers a dependable starting point for strategic planning.


Key Questions Answered in the Report
What is driving the current growth of the embedded security market?
Rapid IoT expansion, automotive cybersecurity mandates, and new regulations such as the EU Cyber Resilience Act are collectively pushing demand for hardware-rooted trust and lifecycle security services.
How fast is revenue growing for embedded security solutions?
Market revenue is set to climb from USD 10.11 billion in 2026 to USD 15.95 billion by 2031, reflecting a 9.54% CAGR.
Which component category is expanding the quickest?
Services, driven by certification consulting and lifecycle-management subscriptions, record an 11.42% CAGR through 2031.
What role do cloud deployments play?
Cloud held 57.52% share in 2025 and grows 12.62% annually because managed HSM instances offer elastic capacity and compliance certifications.
Why is healthcare demand accelerating?
FDA draft guidance from 2024 encourages cryptographic device identity and secure updates, pushing healthcare equipment toward embedded secure elements at a 10.22% CAGR.
Which region delivers the fastest growth?
The Middle East leads with an 11.52% CAGR, fueled by mega-projects like NEOM and new cybersecurity mandates in the Gulf states.
How concentrated is vendor competition?
The top five players control just over half of revenue, yielding a moderate 6/10 concentration score amid rising hyperscaler and startup activity.
Page last updated on:


