
Elemental Analysis Market Size and Share
Market Overview
| Study Period | 2022 - 2031 |
|---|---|
| Market Size (2026) | USD 2.11 Billion |
| Market Size (2031) | USD 2.86 Billion |
| Growth Rate (2026 - 2031) | 6.31 % |
| Fastest Growing Market | Asia Pacific |
| Largest Market | North America |
| Market Concentration | Medium |
Major Players
*Disclaimer: Major Players sorted in no particular order Image © Mordor Intelligence. Reuse requires attribution under CC BY 4.0. |
|
Elemental Analysis Market Analysis by Mordor Intelligence
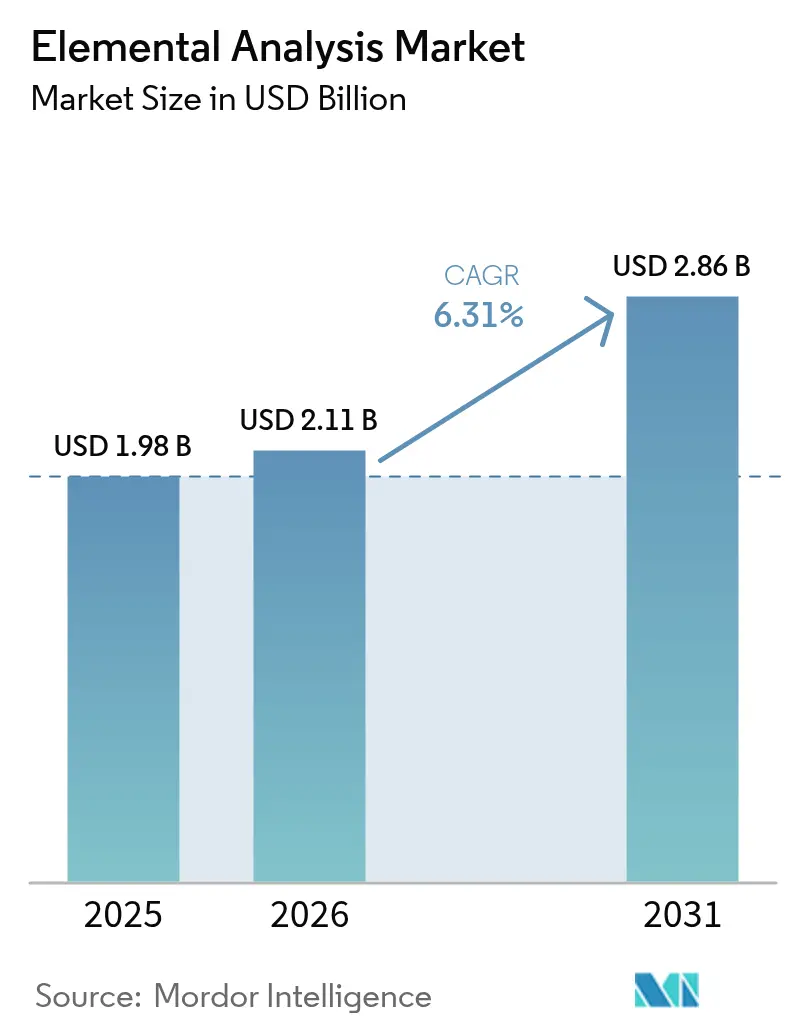
The elemental analysis market size was valued at USD 1.98 billion in 2025 and estimated to grow from USD 2.11 billion in 2026 to reach USD 2.86 billion by 2031, at a CAGR of 6.31% during the forecast period (2026-2031). Growth reflects a shift from routine quality control toward ultra-trace characterization demanded by semiconductor fabs, stringent pharmaceutical impurity limits, and widening environmental regulations. Investments in AI-enabled automation, helium-saving workflows, and hybrid multi-technique platforms strengthen vendor differentiation. Rapid semiconductor buildouts across Asia, expanding PFAS and nitrosamine limits, and robust life-science R&D budgets reinforce long-term demand. Meanwhile, capital intensity, skilled-labor shortages, and volatile carrier-gas markets temper near-term momentum.
Key Report Takeaways
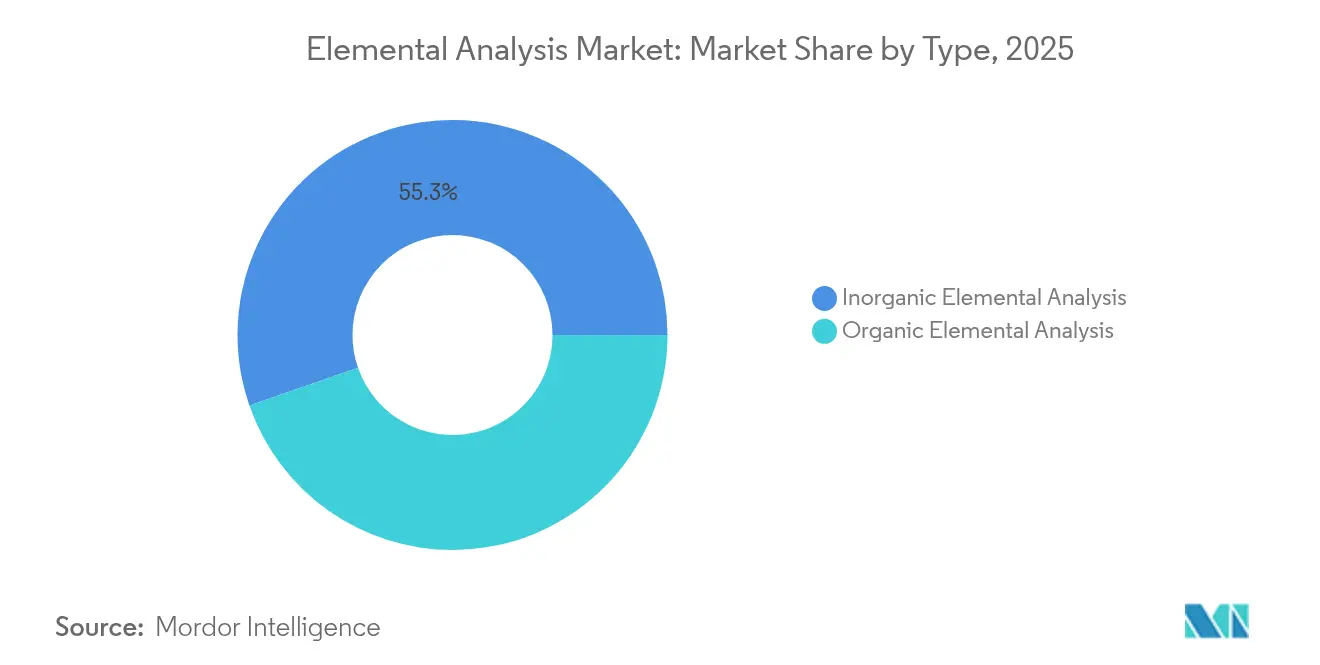
- By type, inorganic analysis led with 55.32% revenue share in 2025; organic analysis posts the fastest 7.55% CAGR to 2031.
- By technology, X-ray fluorescence held 48.85% of the elemental analysis market share in 2025, while ICP-MS is projected to grow at 8.08% CAGR through 2031.
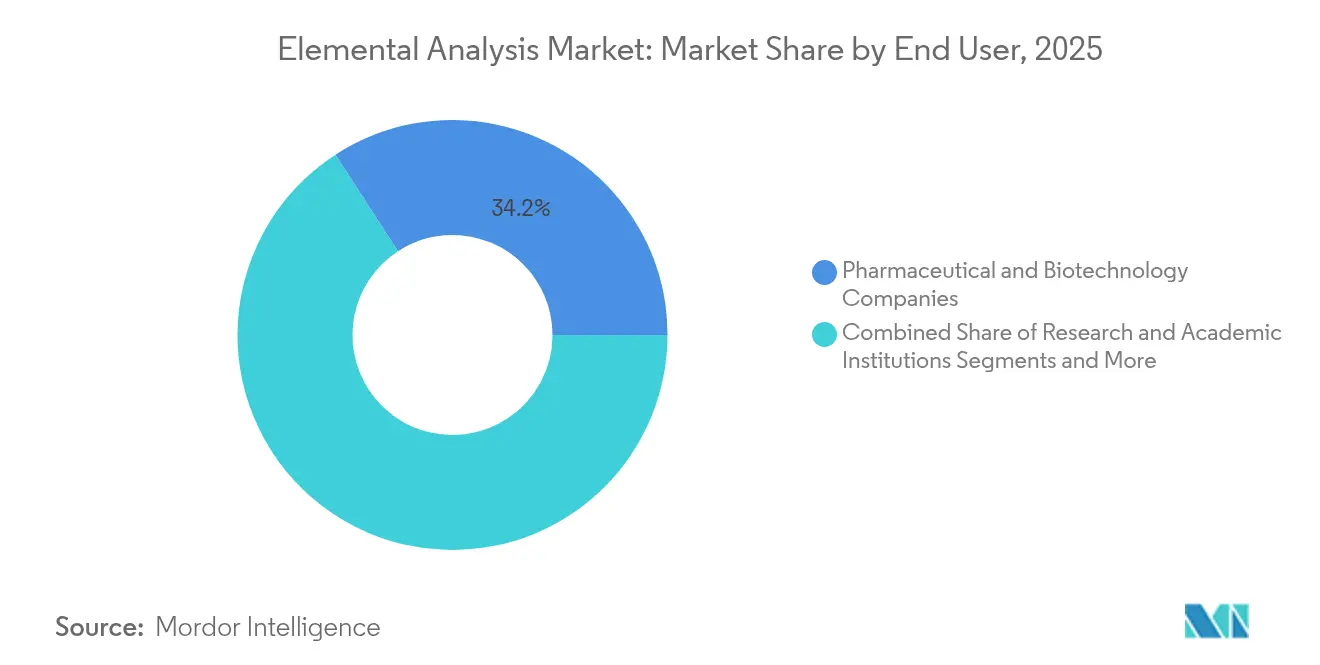
- By end user, pharmaceutical & biotechnology companies accounted for 34.17% of elemental analysis market size in 2025; environmental & food laboratories are advancing at an 8.46% CAGR.
- By geography, North America commanded 35.12% revenue share in 2025; Asia-Pacific is set to deliver the highest 7.18% CAGR to 2031.
Note: Market size and forecast figures in this report are generated using Mordor Intelligence’s proprietary estimation framework, updated with the latest available data and insights as of 2026.
Global Elemental Analysis Market Trends and Insights
Drivers Impact Analysis*
| Driver | (~) % Impact on CAGR Forecast | Geographic Relevance | Impact Timeline |
|---|---|---|---|
| Growing R&D funding in life sciences | +1.20% | North America, Europe, emerging Asia | Medium term (2-4 years) |
| Stringent elemental-impurity limits | +1.50% | Global, led by US FDA & EMA | Short term (≤ 2 years) |
| Expanding food & environmental rules | +0.80% | Global, strongest acceleration in Asia-Pacific | Medium term (2-4 years) |
| Semiconductor-grade purity demands | +1.10% | Asia-Pacific core; spill-over into North America | Long term (≥ 4 years) |
| AI-based multi-element mapping | +0.70% | Early adoption in developed markets | Medium term (2-4 years) |
| Battery-recycling ultratrace detection | +0.60% | Europe & North America lead; Asia-Pacific following | Long term (≥ 4 years) |
| Source: Mordor Intelligence | |||
Growing R&D Funding in Life Sciences
Global pharma-biotech R&D spending crossed USD 200 billion in 2024, intensifying demand for elemental impurity testing under ICH Q3D guidelines. Thermo Fisher’s multi-year USD 40-50 billion M&A pipeline underscores vendor confidence in sustained instrumentation demand. The pharmaceutical analytical-testing market itself is projected to rise from USD 9.74 billion in 2025 to USD 14.58 billion by 2030 at 8.41% CAGR, outpacing broader analytical chemistry spending. These investments solidify long-term orders for ICP-MS, ICP-OES, and combustion analyzers. Automation modules that shrink turnaround times and lower per-sample cost are increasingly bundled with spectrometers. Vendors also roll out compliance-ready software that aligns reporting directly with USP 232/233 limits.
Stringent Elemental-Impurity Limits in Global Pharmacopeias
The US FDA’s 2024 nitrosamine update created immediate compliance pressure as it tightened classification systems for trace metals. USP expanded its pharmaceutical analytical impurity library to nearly 1,000 PAIs spanning 300 APIs, compelling laboratories to broaden multi-element panels. In March 2025, the FDA launched the Chemical Contaminants Transparency Tool, signaling a persistent agency focus on metals monitoring in foods.[1]U.S. Food & Drug Administration, “Chemical Contaminants Transparency Tool,” fda.gov Rapid adoption of ready-to-use calibration standards and cloud-based reference libraries has followed. Instrument makers increasingly certify systems per 21 CFR Part 11 to reduce validation overhead for drug manufacturers. These trends keep the elemental analysis market firmly linked to evolving pharmacopeial directives.
Expanding Food & Environmental Safety Regulations
EPA Method 1633 formalized PFAS testing across matrices in 2024, joining Canada’s 30 ng/L drinking-water objective for 25 PFAS and the EU’s pending PFHxA restrictions. Analysts estimate US remediation liabilities exceeding USD 220 billion, creating an unprecedented flow of samples to contract labs. Environmental testing laboratories therefore record the quickest revenue climb at 8.9% CAGR. Technique demand is shifting toward high-throughput ICP-MS equipped with collision/reaction cells to mitigate interferences. Portable XRF and LIBS units are also making inroads in field screening to prioritize samples. Trace-metal screening in fresh produce and rice has expanded in India and Vietnam under new food-code amendments, broadening the addressable elemental analysis market.
Semiconductor-Grade Purity Requirements for Advanced Chips
Government incentives across Japan, India, and the United States continue to accelerate 3-nm and 4-nm fab construction. Achieving 9N to 11N purity in silicon, copper, and process chemicals requires detection limits below 10 ppt. Thermo Fisher’s Vulcan Automated Lab, launched in March 2025, combines robotics with ICP-MS to process 200 wafers nightly at <100 ng/L detection limits. Agilent’s Advanced Valve System adds 100 extra samples per day to the 7850 line, directly addressing fab throughput targets. These innovations feed sustained double-digit spending on ultratrace instrumentation, keeping the elemental analysis market on its current growth trajectory.
Restraints Impact Analysis*
| Restraint | (~) % Impact on CAGR Forecast | Geographic Relevance | Impact Timeline |
|---|---|---|---|
| High capital & maintenance costs | −0.9% | Global, pronounced in emerging markets | Short term (≤ 2 years) |
| Shortage of cross-trained analytical chemists | −0.6% | North America & Europe | Medium term (2-4 years) |
| Complex sample-prep workflows | −0.4% | Application-dependent global impact | Short term (≤ 2 years) |
| Global helium shortages | −0.8% | Severe in North America | Short term (≤ 2 years) |
| Source: Mordor Intelligence | |||
High capital & maintenance costs
Single-quadrupole ICP-MS units typically list between USD 100,000 and USD 200,000, while triple-quadrupole or high-resolution models can exceed USD 400,000, placing a heavy upfront burden on mid-size laboratories. Annual operating expenses compound the challenge: gas, power, and consumables push yearly running costs for an ICP-MS to about USD 13,250, more than double the bill for an ICP-OES setup. Vendors generally recommend full-service contracts priced at 10% of the purchase value each year to cover detector replacement, preventive maintenance, and software updates. Even where financing spreads capital outlays, hidden costs such as facility upgrades for exhaust handling and clean power can add another 15-20% to project budgets, slowing adoption in emerging markets. As helium prices rise and supply tightens, labs face further escalation in direct operating expenditures, prompting many to postpone instrument refresh cycles or pivot to rental models.
Global Helium Shortages Inflating ICP-MS Operating Budgets
Helium spot prices climbed to USD 14 per m³ in 2023, with labs receiving only 45-65% of allocations, causing downtime in trace-metal workflows. Peak Scientific reports a 70% rise in helium-generator inquiries as users seek independence from bulk supply. Shimadzu publishes method-translation kits that swap helium for hydrogen or nitrogen, cutting carrier-gas costs by up to 90% without sacrificing detection limits. Vendors are also shipping collision-cell ICP-MS models optimized for argon/hydrogen mixes, mitigating operating risk and sustaining sample throughput.
*Our forecasts treat driver/restraint impacts as directional, not additive. The impact forecasts reflect baseline growth, mix effects, and variable interactions.
Segment Analysis
By Type: Inorganic Analysis Dominance Meets Organic Growth Acceleration
Inorganic analysis captured 55.32% of the elemental analysis market share in 2025, buoyed by USP 232/233 compliance and semiconductor contamination control. ICP-MS and ICP-OES platforms dominate this segment, delivering sub-ng/L detection of As, Pb, and Cd in drug products and high-purity chemicals. Semiconductor foundries demand routine certification of 9N-grade process chemicals, further anchoring instrument placements. Vendor emphasis is shifting toward hybrid systems that bundle inorganic metals detection with options for halogen and sulfur mapping, extending platform utility across QA labs. Capital expenditure is sustained by extended service contracts that guarantee <1 ppt baseline drift, assuring fabs of long-term analytical reproducibility.
Organic elemental analysis, while smaller, is growing at 7.55% CAGR—faster than the overall elemental analysis market. Combustion-based CHNSO analyzers address drug-development needs for molecular formula confirmation and are now equipped with 90-position autosamplers offering 5-minute cycle times. Food-safety labs adopt the same platforms to quantify protein, fat, and moisture, expanding the customer base beyond pharma and petrochemicals. Vendors introduce dual oven configurations that measure high-temperature polymers alongside low-temperature agro-samples, reducing idle time. Coupled software allows seamless import of LIMS metadata, trimming post-run validation.


By Technology: XRF Leadership Challenged by ICP-MS Innovation
X-ray fluorescence sustained a 48.85% share of the elemental analysis market in 2025 owing to its non-destructive character and broad matrix tolerance. Petrochemical refineries use benchtop XRF for sulfur in fuels, while art conservators rely on handheld-units for pigment screening. The latest Vanta Element handheld incorporates a graphene window and IP65 sealing for harsh-field deployments. Ongoing advances in silicon-drift detectors now extend sensitivity down to Mg and Al, expanding coverage to light-element geoscience applications.
ICP-MS records the fastest 8.08% CAGR to 2031, pushing elemental analysis market size for ultratrace detection to new records. Collision-cell designs, triple-quadrupole geometries, and new dry-plasma introduction systems drive detection limits below 1 ng/L even in high-matrix samples. Semiconductor customers increasingly bundle robots for unattended overnight runs, boosting daily sample counts above 400. Pharmaceutical QC labs value the technique’s ability to report 24 ICH metals in a single two-minute scan, cutting per-sample reagent costs in half. As helium shortages intensify, vendors add hydrogen mode that maintains low backgrounds, protecting long-term throughput.
By End User: Pharmaceutical Dominance Versus Environmental Testing Surge
Pharmaceutical & biotechnology companies generated 34.17% revenue in 2025, anchored by mandatory elemental-impurity limits and a surging biologics pipeline. This clientele prioritizes 21 CFR Part 11-ready software, instrument uptime guarantees, and service-level agreements aligning with batch-release cycles. Regulatory harmonization across the FDA, EMA, and PMDA accelerates analytic method transfers among global sites, driving multi-instrument roll-outs inside big pharma networks.
Environmental & food laboratories post an 8.46% CAGR as PFAS limits, micro- and nano-plastics surveillance, and heavy-metal scrubbing in baby food expand test menus. Eurofins alone operates 900 labs with 200,000 accredited methods, signaling the scale of outsourced demand. These labs increasingly procure turnkey containerized ICP-MS suites for pop-up deployment near remediation hotspots, minimizing sample hold times. Automated dilution stations and barcode-driven chain-of-custody modules curb labor costs and compliance risks.
Geography Analysis
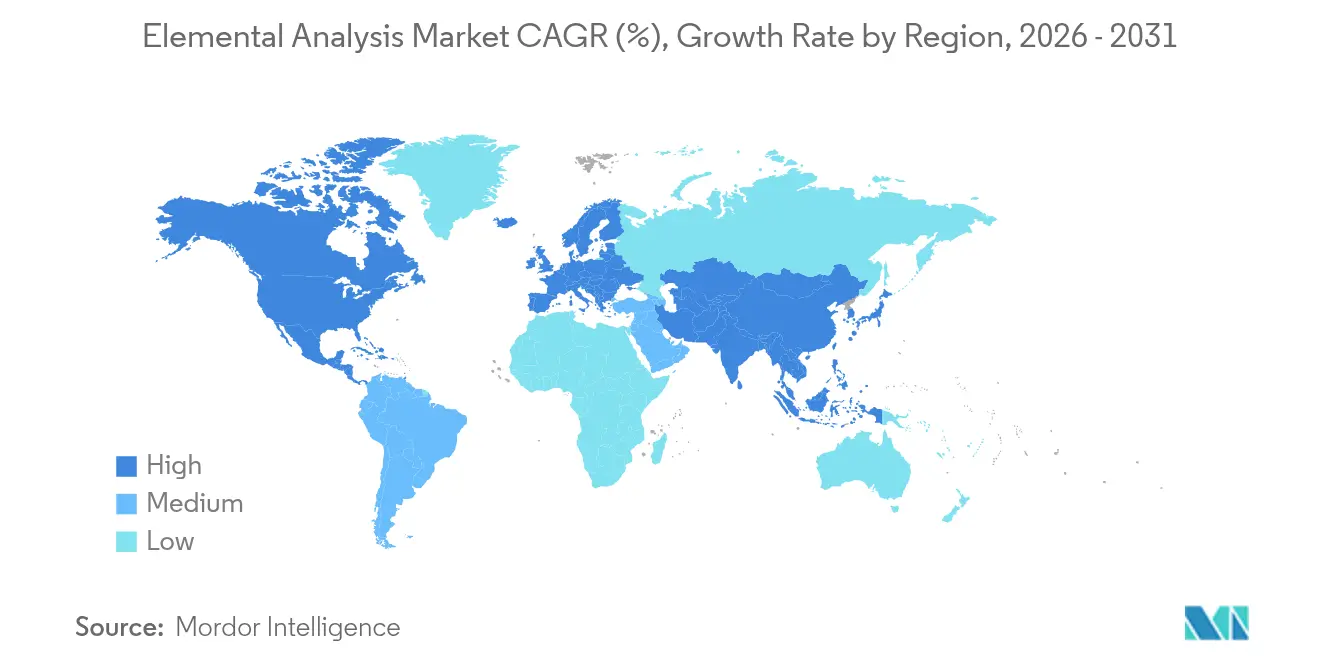
North America held 35.12% of revenue in 2025 on the strength of FDA impurity guidelines, EPA PFAS mandates, and world-leading pharma output.]US drugmakers account for over 40% of global clinical pipelines, sustaining steady instrument orders, while Canada’s mining sector fuels XRF placements for grade control. Mexico’s rising contract-manufacturing activity, supported by Shimadzu’s new subsidiary, widens the regional user base.
Asia-Pacific is projected to deliver a 7.18% CAGR, the fastest worldwide, as governments subsidize advanced chip fabs and domestic drug production capabilities. Japan’s 2-nm pilot lines and India’s USD 100.2 billion semiconductor roadmap enlarge the addressable elemental analysis market through ultratrace purity specifications. China’s push for materials self-sufficiency drives demand for ICP-MS, while South Korea’s battery gigafactories purchase LIBS systems for inline cathode inspection. Australia’s mining exports sustain XRF sales for bulk-ore screening.
Europe grows steadily on the back of stringent PFAS restrictions and strong vaccine manufacturing clusters in Germany and France. The EU’s battery-recycling directive, targeting a 50-fold capacity increase by 2030, lifts orders for ultratrace metals analyzers. The United Kingdom emphasizes nitrogen-pressurized ICP-MS to mitigate helium volatility, and Nordic nations deploy LIBS for rapid slag monitoring in green-steel pilot plants. Eastern European mining expansions in Poland and Serbia add new sales channels, while Middle East copper projects and South American lithium brine operations open supplementary opportunities.

Regulatory Landscape
Elemental analysis in regulated labs is anchored by pharmaceutical impurity limits and harmonized pharmacopoeial expectations. Compliance-driven workflows rely on USP 232 and 233 for elemental contaminants, and aligned European Pharmacopoeia expectations. In food and environmental testing, EPA Method 1633 (2024) formalized PFAS testing across matrices, expanding validated, multi-element analysis in accredited laboratories.
On the informatics and quality-system side, regulatory updates in 2026 shape software lifecycle expectations. The FDA Quality Management System Regulation (QMSR) became effective for medical devices, and the FDA issued final guidance on Computer Software Assurance (CSA) for production and quality management system software, reinforcing data integrity controls and audit trails aligned with 21 CFR Part 11 environments. The ONC Standards Version Advancement Process (SVAP) opens in 2026 for voluntary adoption of newer standard versions beginning August 29, 2026, increasing pressure for lab software connected to instrumentation to stay current with evolving data standards.
Competitive Landscape
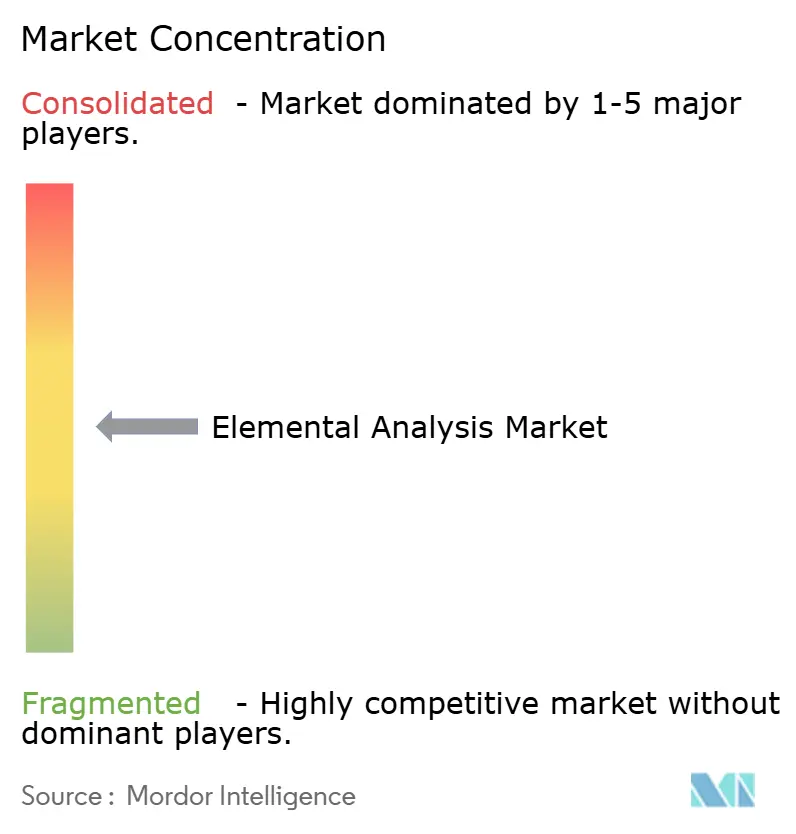
The elemental analysis market shows moderate concentration, with the top five companies controlling a significant portion of global revenue. Thermo Fisher Scientific, Agilent Technologies, and Bruker Corporation combine scale, broad product portfolios, and embedded software ecosystems to anchor market leadership. ICP-MS innovation and AI-enabled XRF mapping form the core battlegrounds for differentiation.
M&A activity remained brisk in 2024-2025. Thermo Fisher’s USD 4.1 billion acquisition of Solventum’s purification & filtration unit enlarges its bioprocessing reach and cross-sells analytical hardware. Analytik Jena consolidated an ICP-MS line to deepen environmental-lab penetration. Bruker purchased Optimal Group, adding automation software that integrates mass spectrometry and optical spectroscopy on a single control layer.
Strategic roadmaps emphasize helium-free carrier modes, robotic sample preparation, and cloud analytics. Vendors pilot subscription models bundling hardware, consumables, and software, smoothing customer CapEx and unlocking recurring revenue. Portable analyzers gain attention for process industries seeking real-time decision loops. While established players guard IP through aggressive patent filings, niche firms target specific use-cases such as LIBS for battery raw materials or CHNSO analyzers for biofuels, keeping innovation cycles vibrant.
Elemental Analysis Industry Leaders
-
Eurofins Scientific
-
Agilent Technologies, Inc.
-
Rigaku Corporation
-
Verder Scientific GmbH & Co. KG (ELTRA GmbH)
-
PerkinElmer Inc
- *Disclaimer: Major Players sorted in no particular order

Market Opportunities and Future Outlook
A broader deployment path centers on automation and standardized connectivity between instruments and laboratory information systems, especially where compliance and turnaround time shape purchasing decisions. LIVD mappings to LOINC and USCDI v7, together with active interoperability efforts in Pathology and Laboratory Medicine domains and ONC work on USCDI v7, create room for vendors to package elemental analysis instruments with compliant software, standardized result messaging, and easier LIS integration.
Within the market, vendor and lab evidence points to automation and sample throughput as differentiators in high-volume testing. Agilent's May 2026 introduction of the 9500 Triple Quadrupole ICP-MS with Air Cell and Advanced Helium Mode targets shorter acquisition time and supports ambient-air usage in semiconductor, environmental, and pharma labs. Eurofins WEJ Contaminants' December 2025 automated metal and element analysis robot also highlights automation-driven throughput gains, and interoperability work continues to support instrument-to-LIS software packaging.
Recent Industry Developments
- June 2026: Eurofins WEJ Contaminants GmbH highlighted use of ICP-MS following a modified DIN EN ISO 15763 approach to quantify rare earth elements in food and feed. The update signals expanding test menus beyond classic heavy metals toward emerging elemental risk assessments, supporting continued investment in high-sensitivity, interference-managed ICP-MS workflows in routine food safety labs.
- March 2026: Rigaku launched the NEX QC II Series benchtop XRF analyzers at Pittcon 2026, targeting industrial quality control and production environments. This strengthens the nondestructive, on-site QC use case where rapid screening and simplified operation drive instrument selection outside traditional central laboratories.
- December 2025: Eurofins inaugurated a laboratory robot at Eurofins WEJ Contaminants for automated metal and element analysis, described as enabling up to 250 samples per day and simultaneous analysis of up to 27 elements. The move underscores how lab-scale robotics is being applied to elemental analysis to ease skilled-labor constraints and standardize throughput for high-volume compliance testing.


Research Methodology Framework and Report Scope
Market Definition and Coverage
This market covers the revenue generated from instruments, related consumables, and enabling software that are used to quantify elemental composition in samples for research and quality testing across major end users.
Scope exclusions: Contract testing service revenue and general lab outsourcing fees are excluded from the market total.
Segmentation Overview
-
By Type
- Organic Elemental Analysis
- Inorganic Elemental Analysis
-
By Technology
-
Destructive Technologies
- ICP-Atomic Emission Spectroscopy (ICP-AES)
- ICP-Mass Spectrometry (ICP-MS)
- Combustion Analysis (CHNS/O)
- Others
-
Nondestructive Technologies
- X-Ray Fluorescence Spectroscopy (XRF)
- Fourier Transform Infrared Spectroscopy (FTIR)
- Laser-Induced Breakdown Spectroscopy (LIBS)
- Others
-
Destructive Technologies
-
By End User
- Pharmaceutical & Biotechnology Companies
- Research & Academic Institutions
- Environmental & Food Testing Laboratories
- Industrial & Manufacturing
- Others
-
By Geography
-
North America
- United States
- Canada
- Mexico
-
Europe
- Germany
- United Kingdom
- France
- Italy
- Spain
- Rest of Europe
-
Asia Pacific
- China
- Japan
- India
- South Korea
- Australia
- Rest of Asia Pacific
-
Middle East & Africa
- GCC
- South Africa
- Rest of Middle East & Africa
-
South America
- Brazil
- Argentina
- Rest of South America
-
North America
Data Sources, Market Sizing, and Validation
Desk Research
Desk research is used to build the base structure of the model, especially the demand drivers and the industry boundary, before numbers are finalized. We refer to public sources such as U.S. FDA guidance and recalls databases (for impurity and contamination focus), the USGS minerals statistics (for metals and mining testing activity), the EPA and ECHA public pages (for environmental compliance signals), and the USP and ICH public standards pages (for elemental impurities methods and thresholds).
Along with this, we review annual reports, investor presentations, product brochures, and validated press coverage to understand instrument replacement cycles and common purchasing bundles. Where it helps, subscriptions covering company financials and intelligence, patent databases, and shipment-level import and export data are used to check directional movement and to avoid relying on one single proxy. The sources listed here are illustrative only, and many other public references were also used for data collection, cross-checks, and clarification.
Primary Interviews and Surveys
Primary interviews and surveys are used to pressure-test the desk assumptions and to fill gaps that are hard to observe from public data, such as typical pricing ranges, adoption of ICP and XRF workflows, and replacement timing. We speak with a mix of instrument suppliers, channel partners, lab managers, and end-user teams across APAC, EMEA, and the Americas so regional purchasing behavior and compliance intensity are reflected in the final view.
Distribution of primary research fieldwork respondents
| Company type | Respondent position | Region |
|---|---|---|
| Top tier: 30% | CXOs: 12% | APAC: 38% |
| Mid tier: 56% | Functional/Unit leaders: 29% | EMEA: 35% |
| Smaller Players: 14% | Managers: 59% | Americas: 27% |
Market-Sizing & Forecasting
The core sizing logic uses a top-down approach where lab testing intensity and regulated end-use activity are translated into an addressable demand pool for elemental quantification systems, and then converted into value using typical price bands. Results are then corroborated with selective bottom-up checks, such as sampled supplier revenue splits, channel feedback on unit shipments, and an ASP times volume sanity check by technique. This helps us adjust totals when a single indicator looks overstated.
Key inputs that shape the model include the installed base and replacement cycle of lab analyzers, the share of compliance-driven testing versus research use, typical utilization rates in high-throughput labs, consumables attachment behavior, and the mix shift between destructive techniques (such as ICP-OES and ICP-MS) and nondestructive methods (such as XRF and LIBS). Forecasts are built using scenario analysis supported by expert views on funding cycles, tightening impurity limits, and environmental monitoring trends, and then a conservative base case is selected when ranges remain wide. If a country-level data point is missing, the gap is handled through proxy indicators like regulated industry output and laboratory density, and it is rechecked during primary follow-ups.
Data Validation & Update Cycle
Validation is done through multiple checks so the final numbers do not depend on any single source or one assumption. Model outputs are compared against independent signals such as reported instrument revenue direction, public procurement and lab expansion activity, and trade movements for relevant equipment categories. When outliers appear, we review them and rerun the analyst calculations to correct the totals.
Before sign-off, the assumptions are reviewed in steps, first within the project team and then through a separate internal pass that challenges scope and year alignment. Reports are refreshed annually, and interim updates are done when a material event changes demand visibility, such as a major regulatory change or an abrupt pricing swing in key inputs. Right before delivery, we do a final freshness check so clients receive the most current view available at that time.
Mordor Intelligence's Elemental Analysis Market Size Measured Against Other Published Estimates
Published market sizes for elemental analysis often look different because the boundary of what gets counted is not the same across studies, even if the topic name looks identical. In our experience, the biggest differences usually come from whether services are included, how broad the instrument set is, and which year is treated as the starting point.
For this market, the main gap drivers are commonly the inclusion of contract testing revenue, broader analytical instrumentation being grouped under elemental analysis, and different ways of handling ASP progression as labs upgrade from routine testing to trace-level work. The evidence points to these scope decisions because shipment signals and technique-level adoption checks keep Mordor Intelligence's estimate aligned to lab-grade elemental quantification systems and their recurring consumables, rather than wider laboratory services spending.
Benchmark comparison
| Source | Market Size | Gaps in Research Methodology |
|---|---|---|
| Mordor Intelligence | USD 2.11 B (2026) | |
| Global Consultancy A | USD 1.86 B (2024) | Uses an earlier base year and may apply a narrower instrument boundary that undercounts consumables and software attachments, which can pull the total down when only core systems are valued. |
| Industry Publisher B | USD 4.29 B (2025) | Likely applies a broader revenue pool that can blend in adjacent analytical categories and parts of lab services spending, and it may also use a different currency timing and inflation treatment for pricing. |
The spread across sources becomes easier to explain once the scope and the counting rules are made explicit. When instruments, consumables, and software are tied back to elemental quantification use cases and then checked against real-world adoption and purchase patterns, the resulting total becomes more traceable and easier to repeat year to year.


Key Questions Answered in the Report
What is the current size of the elemental analysis market?
The elemental analysis market is valued at USD 2.11 billion in 2026 and is forecast to hit USD 2.86 billion by 2031.
Which technology segment is growing fastest?
ICP-MS is projected to post the highest 8.08% CAGR because of ultratrace detection needs in semiconductors and pharmaceuticals.
Why is Asia-Pacific the fastest-growing region?
Aggressive semiconductor investments in Japan, India, and China, coupled with expanding pharma manufacturing, propel a 7.18% CAGR for the region.
How are helium shortages affecting laboratories?
Helium prices have surged, prompting labs to adopt hydrogen or nitrogen carrier gases and invest in gas generators to maintain ICP-MS operations.
Which end-user group dominates spending?
Pharmaceutical and biotechnology companies accounted for 34.17% of 2025 revenue due to mandatory elemental impurity testing requirements.
Page last updated on:


 Your data is secure and never sold or shared.


