
Electrophoresis Reagents Market Size and Share
Market Overview
| Study Period | 2020 - 2031 |
|---|---|
| Market Size (2026) | USD 1.34 Billion |
| Market Size (2031) | USD 1.72 Billion |
| Growth Rate (2026 - 2031) | 5.05 % |
| Fastest Growing Market | Asia-Pacific |
| Largest Market | North America |
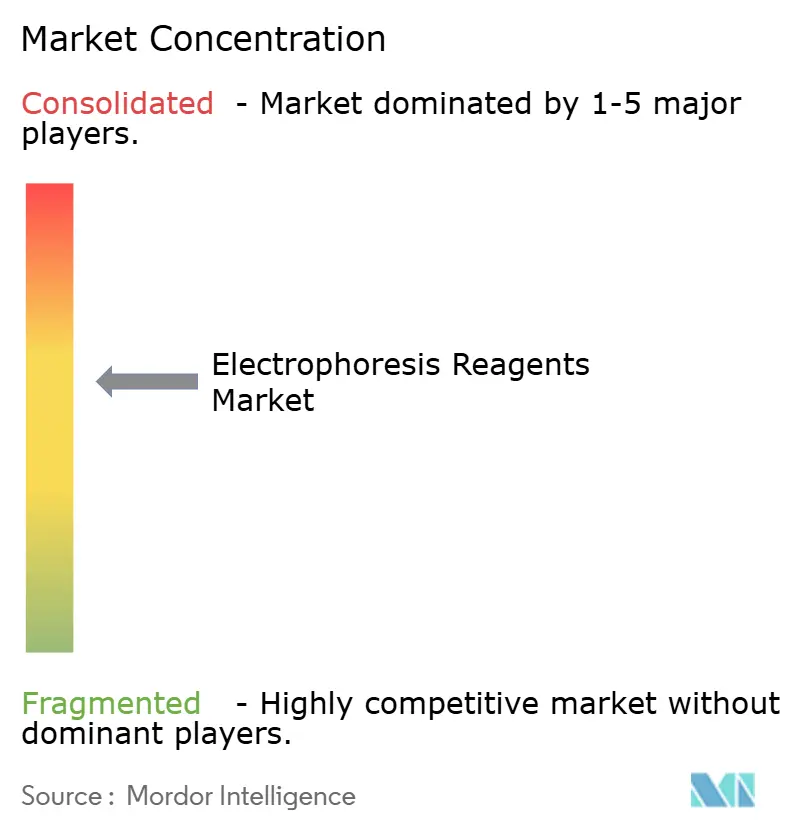
| Market Concentration | Medium |
Major Players *Disclaimer: Major Players sorted in no particular order Image © Mordor Intelligence. Reuse requires attribution under CC BY 4.0. | |
Electrophoresis Reagents Market Analysis by Mordor Intelligence
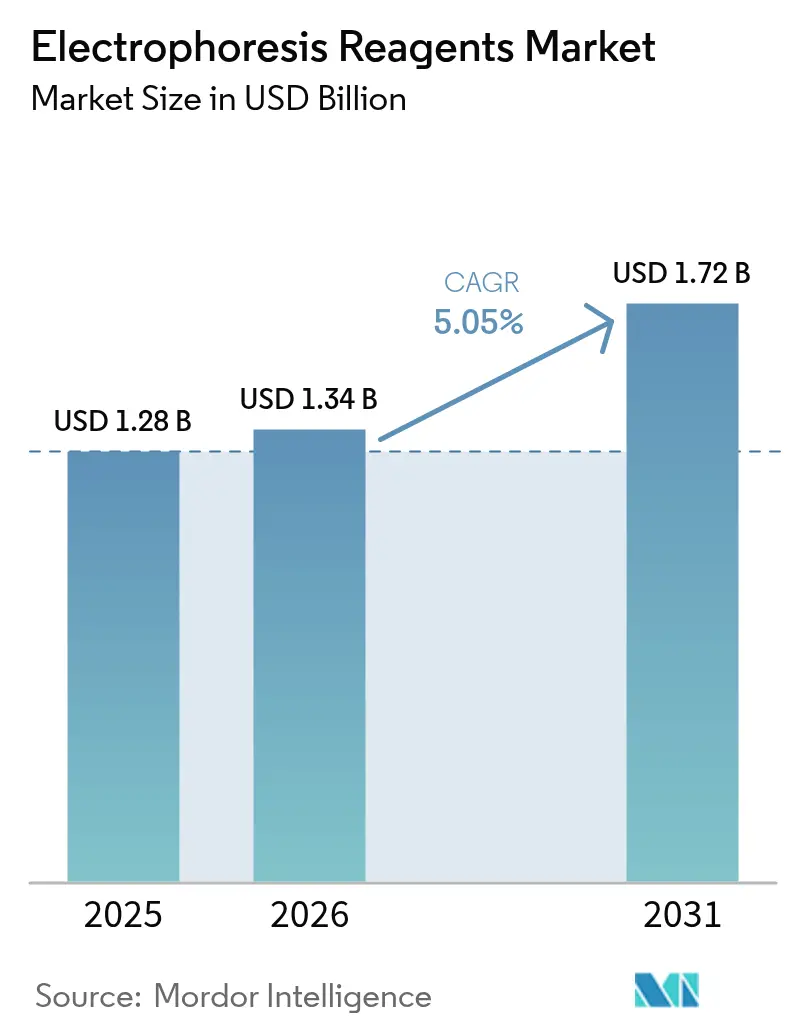
The electrophoresis reagents market size is expected to grow from USD 1.28 billion in 2025 to USD 1.34 billion in 2026 and is forecast to reach USD 1.72 billion by 2031 at 5.05% CAGR over 2026-2031. Demand is now driven by long-term shifts toward precision medicine, stricter regulatory oversight, and sustained federal research funding. The United States Food and Drug Administration’s May 2024 laboratory-developed-test rule introduced a USD 566 million–USD 3.56 billion compliance burden over two decades, elevating quality thresholds that favor established reagent suppliers fda.gov. Asia-Pacific is poised to rebalance global growth as regional research hubs expand despite recent venture-financing softness. Rising adoption of greener stains, integration of AI-enabled gel analytics, and automation-heavy capillary systems further reinforce structural demand drivers for the electrophoresis reagents market.
Key Report Takeaways
- By product, gels led with 43.12% revenue share of the electrophoresis reagents market in 2025, whereas dyes are projected to grow at a 7.74% CAGR to 2031.
- By technique, traditional gel electrophoresis commanded 69.02% of the electrophoresis reagents market share in 2025, while capillary electrophoresis is advancing at a 7.55% CAGR through 2031.
- By end user, academic institutions held 46.32% share of the electrophoresis reagents market size in 2025; pharmaceutical and biotechnology companies are forecast to expand at an 8.42% CAGR between 2026-2031.
- By geography, North America contributed 39.78% of global revenue in 2025, but Asia-Pacific is projected to post the fastest 6.32% CAGR through 2031.
Note: Market size and forecast figures in this report are generated using Mordor Intelligence’s proprietary estimation framework, updated with the latest available data and insights as of 2026.
Market Trends and Insights
Drivers Impact Analysis of Electrophoresis Reagents Market*
| Driver | (~) % Impact on CAGR Forecast | Geographic Relevance | Impact Timeline |
|---|---|---|---|
| Increasing funding for genomic & proteomic research | +1.2% | North America, Europe, and selected Asia-Pacific economies | Medium term (2-4 years) |
| Rising prevalence of chronic diseases | +0.9% | Global, especially aging industrialized regions | Long term (≥ 4 years) |
| Technological advances in high-throughput electrophoresis | +1.1% | North America & Europe core, spill-over to Asia-Pacific | Short term (≤ 2 years) |
| Growing adoption of personalized medicine | +0.8% | North America & Europe, emerging Asia-Pacific urban centers | Medium term (2-4 years) |
| Lab-on-a-chip reagent kits for point-of-care molecular testing | +0.7% | Global, early uptake in resource-constrained settings | Medium term (2-4 years) |
| Shift toward greener, non-toxic dyes & buffers | +0.4% | European Union leads; North America follows; Asia-Pacific selective | Long term (≥ 4 years) |
| Source: Mordor Intelligence | |||
Increasing Funding for Genomic & Proteomic Research
The National Institutes of Health allocated USD 50.3 million in 2024 to its Multi-Omics for Health and Disease Consortium, signaling a sustained preference for integrated analytical platforms that require electrophoresis reagents for reliable biomarker validation[1]. Expanded public funding compels suppliers to offer comprehensive, workflow-compatible product suites instead of stand-alone consumables. Private-sector co-investment magnifies these tailwinds, as pharmaceutical sponsors leverage public infrastructure for drug-discovery programs. Computational genomics now consumes 30% of the National Human Genome Research Institute’s FY2023 budget, underscoring how data-intensive research favors high-throughput electrophoresis systems capable of generating reproducible quantitative outputs for algorithmic pipelines. Together, these funding models lengthen demand visibility across the electrophoresis reagents market by anchoring purchases to multiyear research grants.
Rising Prevalence of Chronic Diseases
The global shift toward aging populations elevates diagnostic complexity, favoring high-resolution separation techniques that can detect subtle proteomic variations in early disease states. Capillary electrophoresis supports charge-variant analysis of therapeutic proteins, a critical requirement in regulatory submissions for biopharmaceuticals. In oncology, electrophoretic separation of circulating tumor DNA enables minimally invasive liquid-biopsy assays that replace tissue-based diagnostics, thereby increasing test frequency per patient episode. Preventive-care models in developed markets convert one-off diagnostic events into recurring reagent demand, translating epidemiological trends directly into higher reagent volumes for the electrophoresis reagents market.
Growing adoption of personalized medicine
Companion-diagnostic requirements tether electrophoresis demand to every targeted-therapy launch. QIAGEN’s QIAstat-Dx platform delivers one-hour genotyping, supporting real-time treatment decisions and driving point-of-care reagent consumption. Regulatory agencies mandate validated molecular characterization methods, embedding electrophoresis reagents into drug-approval dossiers and guaranteeing baseline volumes for compliant manufacturers. As individual therapy regimens replace population-based protocols, test counts per patient increase, bolstering reagent turnover across the electrophoresis reagents market.
Lab-on-a-chip reagent kits for point-of-care molecular testing
Miniaturized chip-based electrophoresis systems pack separation matrices, buffers, and detection elements into disposable cartridges. Early adoption in low-resource settings demonstrates clinical viability where traditional labs are scarce, widening geographic reach and introducing recurrent cartridge-driven revenue models. Diagnostic NGOs that deploy portable PCR and electrophoresis boxes for tuberculosis or HIV screening underscore how consumable-centric business models open incremental volumes in the electrophoresis reagents market.
Restraints Impact Analysis of Electrophoresis Reagents Market*
| Restraint | ( ~ ) % Impact on CAGR Forecast | Geographic Relevance | Impact Timeline |
|---|---|---|---|
| Time-consuming workflows & manual gel preparation | -0.8% | Global high-volume labs | Short term (≤ 2 years) |
| Availability of alternative separation technologies | -0.6% | North America & Europe lead; Asia-Pacific follows | Medium term (2-4 years) |
| Acrylamide feedstock shortages inflating reagent costs | -0.4% | Global impact, regional variance | Short term (≤ 2 years) |
| Strict disposal rules for ethidium-bromide stains | -0.3% | EU leads; North America tightening; Asia-Pacific emerging | Long term (≥ 4 years) |
| Source: Mordor Intelligence | |||
Time-consuming workflows & manual gel preparation
Casting polyacrylamide gels, loading samples, and post-run staining can require up to 8 hours, making labor the most significant variable cost in high-throughput environments. Bio-Rad’s Stain-Free gels remove the staining step, but premium pricing and new-equipment needs deter adoption in budget-constrained labs. Global shortages of skilled technicians intensify workflow bottlenecks, prompting procurement teams to scrutinize total-cost-of-ownership and consider alternative technologies.
Availability of alternative separation technologies
Mass-spectrometry and chromatographic systems offer comparable sensitivity with higher multiplexing and faster run times, eroding electrophoresis’s historical process advantage. Instruments such as SIFT-MS deliver direct VOC analysis without the sample-preparation overhead intrinsic to electrophoresis. Falling MS hardware prices and AI-driven data-interpretation modules lower adoption barriers, siphoning potential growth from the electrophoresis reagents market.
*Our forecasts treat driver/restraint impacts as directional, not additive. The impact forecasts reflect baseline growth, mix effects, and variable interactions.
Electrophoresis Reagents Market Segment Analysis
By Product:
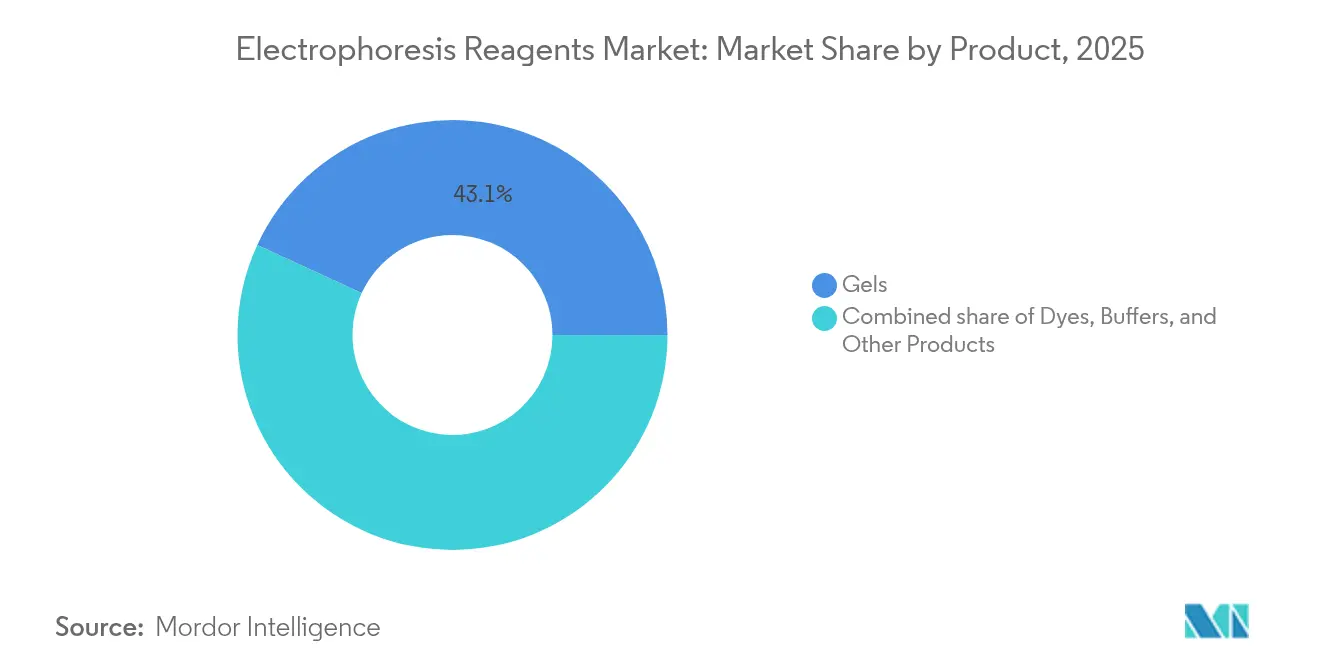
Gels Dominate Despite Dye InnovationGels accounted for 43.12% of the electrophoresis reagents market in 2025, underpinning virtually every separation workflow across DNA, RNA, and protein applications. Agarose remains a staple for nucleic-acid analysis thanks to low cost and straightforward casting, whereas polyacrylamide supports high-resolution protein work. Dye sales, though smaller, are set to climb at a 7.74% CAGR as ethidium-bromide replacements gain regulatory traction, reshaping the electrophoresis reagents market. Suppliers are differentiating gels through throughput-oriented formats; a 96-well polyacrylamide prototype published in 2024 demonstrated simultaneous horizontal electrophoresis with transfer compatibility, hinting at future multi-sample mainstream offerings. Buffer systems such as Tris/Acetate/EDTA remain entrenched industry standards because performance and cost stability outweigh incremental gains from proprietary modifications. Concurrently, newer dye platforms like Biotium’s One-Step Lumitein series integrate staining directly into gel matrices, removing wash steps and shortening protocols—a direct response to labor-shortage challenges.

By Technique:
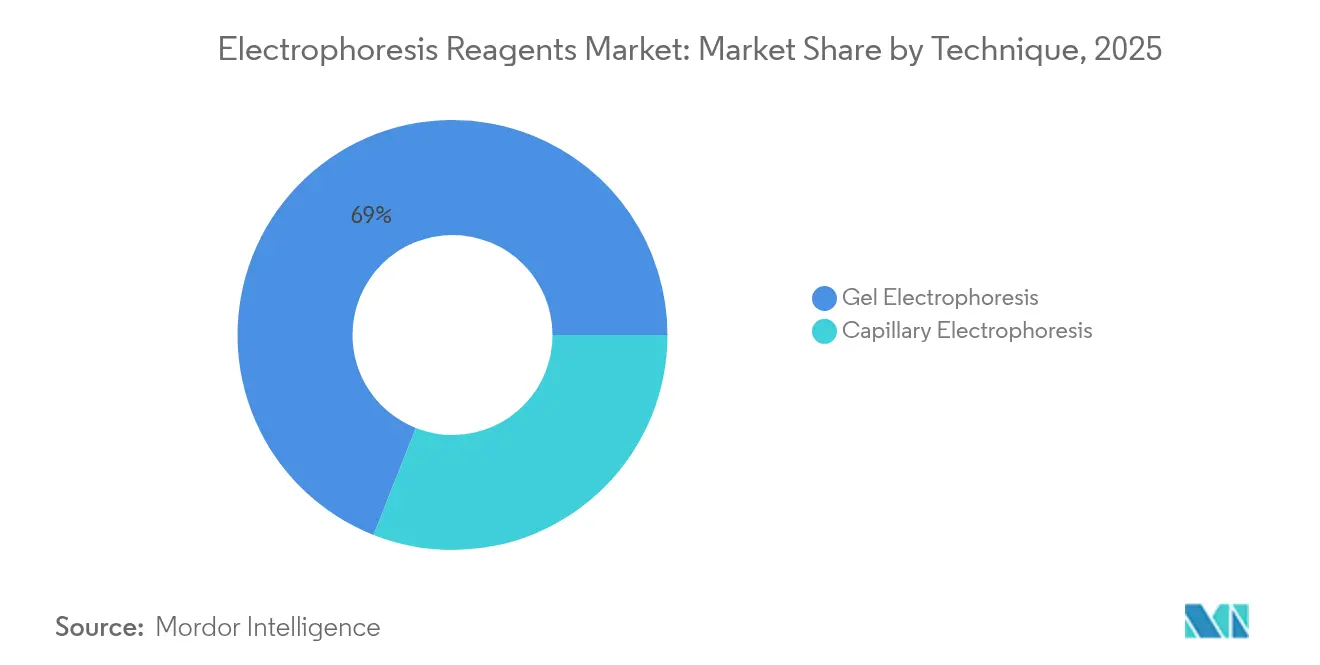
Automation Drives Capillary GrowthConventional gels still constitute 69.02% of global technique revenue in 2025 due to legacy equipment bases and minimal operating costs, yet capillary electrophoresis is forecast at a 7.55% CAGR through 2031. The electrophoresis reagents market size for capillary systems is projected to expand as pharmaceutical developers prioritize high-resolution charge-variant analysis that meets regulatory‐filing standards. Bio-Techne’s Maurice platform automates method development and sample runs in a CFR-compliant package, reflecting workflow expectations in GMP labs. Multi-capillary instruments narrow historical throughput gaps, making capillary platforms viable for batch screening workflows previously dominated by gels. Integration with MS detection further elevates capillary-based data richness, supporting structural confirmation needs in biologic-drug development.
By End User:
Pharmaceutical Acceleration Reshapes DemandAcademic and research labs retained 46.32% of 2025 revenue within the electrophoresis reagents market, driven by grant-funded exploration and training needs. Yet pharmaceutical and biotechnology companies are tracking an 8.42% CAGR to 2031, aided by expanded biologics pipelines and heavier regulatory burdens that require validated, high-throughput methods. The electrophoresis reagents market share commanded by pharmaceutical users is set to climb as FDA LDT regulations favor large diagnostic organizations capable of meeting validation and documentation costs. Clinical and reference labs form a middle tier, balancing throughput with cost controls; consolidation in this segment may shift purchase volumes toward fewer high-capacity buyers. Contract research organizations follow pharmaceutical trends, adopting capillary or microchip platforms once sponsor demand justifies capex investments.
Geography Analysis
North America and Europe Electrophoresis Reagents Market
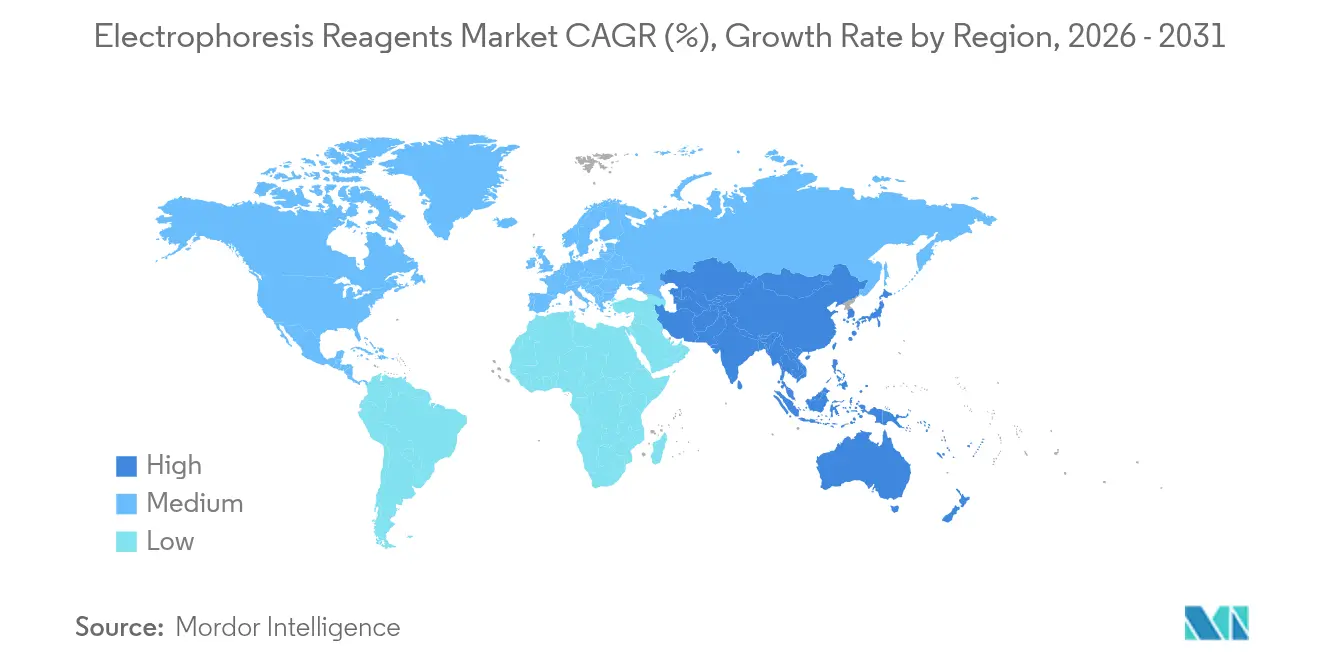
North America generated 39.78% of 2025 revenue for the electrophoresis reagents market, anchored by robust NIH funding and a dense pharmaceutical manufacturing base. The USD 15.4 million NIH–NSF RNA research program exemplifies the public-funding mechanism that sustains reagent consumption irrespective of macroeconomic volatility. Thermo Fisher’s USD 2 billion domestic investment through 2029 underscores supplier commitment to on-shore manufacturing and R&D capacity expansion in anticipation of tax credits and reshoring incentives. Europe remains a mature yet regulation-intensive region; the Corporate Sustainability Due Diligence Directive accelerates substitution of hazardous chemicals, driving demand for greener formulations. Carl Roth’s SOLVAGREEN line of recycled solvents and bioethanol illustrates how European vendors align portfolios with regulatory commitments.
APAC, MEA and South America Electrophoresis Reagents Market
Asia-Pacific is the fastest-growing sub-market with a 6.32% projected CAGR to 2031, fueled by rising government life-science budgets and expanding biopharmaceutical capacity despite a 22% venture-finance decline since 2021. China’s domestic-equipment subsidies and India’s production-linked incentives further tilt capital spending toward regional suppliers, though intellectual-property and supply-chain security concerns encourage multinationals to pursue joint ventures or local manufacturing branches. QIAGEN’s establishment of a Riyadh hub and its memorandum with the Saudi Ministry of Health reveal how Middle East governments leverage strategic partnerships to build molecular-diagnostics ecosystems. Africa and South America remain smaller contributors; targeted donor and government health programs create episodic reagent spikes rather than smooth growth trajectories.
Regulatory Landscape
Regulation affecting electrophoresis reagents is increasingly shaped by IVD quality-system and traceability requirements in major markets. In the United States, the FDA Quality Management System Regulation (QMSR) aligning with ISO 13485:2016 took effect for medical device and IVD manufacturers, increasing documentation, process control, and supplier-qualification expectations that flow down to consumables used in regulated workflows. At the clinical-lab level, New York State Department of Health General Systems Standards (effective February 2026) include requirements that affect verification and the use of reagents and media, reinforcing routine QC and verification practices.
In Europe, the In Vitro Diagnostic Regulation (IVDR) continues to tighten obligations for manufacturers serving clinical and diagnostic use cases, including database and transition milestones in 2026. For legacy Class C IVDs, manufacturers needed to lodge formal applications for conformity assessment with an EU Notified Body by May 26, 2026 to maintain IVDR transition eligibility, and EUDAMED-related obligations became mandatory for IVD manufacturers placing new devices under IVDR from May 28, 2026. In China, publication of standards such as GBZ136-2026 (user guide for reagents for staining biological specimens in medical laboratories) and GB/T 602-2026 (preparation of solutions for impurity determination in chemical reagents) reflects country-specific technical and quality requirements that suppliers typically address through localized specifications and labeling.
Competitive Landscape
The electrophoresis reagents market is moderately consolidated. Thermo Fisher Scientific has averaged USD 3.09 billion per acquisition across 54 transactions, most recently agreeing to buy Solventum’s purification unit for USD 4.1 billion in February 2025, thereby integrating upstream sample clean-up with downstream separation workflows. Agilent Technologies reorganized into market-focused business groups in 2024 and opened a California companion-diagnostics lab, reflecting a solutions-centric go-to-market approach. Bio-Rad’s pending purchase of Stilla Technologies deepens its digital-PCR capability, complementing its Stain-Free gel line for seamless end-to-end protein analysis. Competitive intensity centers on automation and ESG-aligned consumables: suppliers with AI analytics and low-toxicity chemistries secure differentiation and margin premiums. Niche entrants target white-space opportunities such as smartphone-integrated microchip electrophoresis or solvent-free gel matrices, yet patent walls and validation costs temper new-entrant scale-up prospects.
Electrophoresis Reagents Industry Leaders
-
Thermo Fisher Scientific Inc.
-
Merck KGaA
-
Bio-Rad Laboratories Inc.
-
Agilent Technologies Inc.
-
Qiagen N.V.
- *Disclaimer: Major Players sorted in no particular order
Electrophoresis Reagents Market Companies Covered in this Report
- Agilent Technologies
- Analytik Jena GmbH
- BioAtlas
- Bio-Rad Laboratories
- Cleaver Scientific Ltd.
- Cytiva
- Greiner Bio-One GmbH
- Helena Laboratories Corp.
- Hoefer Inc. (Harvard Bioscience)
- Labnet International Inc.
- Lonza Group
- Merck KGaA / Sigma-Aldrich
- New England Biolabs
- NIPPON Genetics Co., Ltd.
- PerkinElmer
- Promega
- QIAGEN
- Randox Laboratories
- Sebia
- SERVA Electrophoresis
- Takara Bio
- Thermo Fisher Scientific
Market Opportunities and Future Outlook
Workflow automation and integrated systems create room for reagent suppliers to bundle validated, instrument-matched consumables that reduce manual gel casting, buffer preparation, and post-run handling. In March 2026, Shimadzu launched the MultiNA II MCE-301 microchip electrophoresis system that automates gel creation, reagent and sample dispensing, separation, dyeing, and cleaning, and it introduced new kits that improved DNA detection sensitivity to 5 pg/uL, supporting demand for system-compatible reagents. Thermo Fisher Scientific followed with the Invitrogen E-Gel Power Snap Lite Electrophoresis System in May 2026, combining gel electrophoresis and imaging for routine nucleic acid verification and shifting purchase decisions toward standardized, ready-to-run consumables and simplified workflows.
Biopharmaceutical characterization needs are also widening the addressable space for specialized buffers, dyes, and method-development kits for high-resolution charge-variant analysis and CZE-MS workflows. Peer-reviewed 2026 research on background electrolyte (BGE) platforms for monoclonal antibody charge heterogeneity method development and refined CZE-MS conditions for antibody and hemoglobin characterization points to an active pipeline of application-specific chemistries where suppliers can differentiate on reproducibility, detection limits, and compatibility with regulated documentation. There is also a near-term substitution opportunity in staining chemistries for labs constrained by technician time, supported by Abbkine's March 2026 announcement of a fast protein gel staining solution with a 30-minute stain and 10-minute destain workflow, which aligns with the market push toward quicker, lower-touch protocols where disposal and safety constraints tighten around legacy stains.
Recent Industry Developments in Electrophoresis Reagents Market
- May 2026: Thermo Fisher Scientific launched the Invitrogen E-Gel Power Snap Lite Electrophoresis System, combining gel electrophoresis and imaging in a compact platform for routine nucleic acid verification. By reducing manual gel casting and buffer preparation steps, the launch supports more standardized, ready-to-run reagent consumption and tighter workflow reproducibility in high-throughput labs.
- March 2025: Thermo Fisher Scientific introduced the Applied Biosystems SeqStudio Flex Dx genetic analyzer, positioned as an IVDR-compliant capillary electrophoresis system for clinical and research applications. The introduction strengthens regulated-lab demand for validated, traceable consumables and reinforces vendor lock-in around compliant CE workflows.
- September 2024: Thermo Fisher Scientific introduced the Applied Biosystems InnoviGene Suite, a browser-based software platform aimed at streamlining capillary electrophoresis data analysis. Adding more automation and audit-friendly handling for CE data supports broader adoption in regulated environments and increases the emphasis on consistent reagent performance for reproducible, software-analyzed outputs.
Electrophoresis Reagents Market Report Scope and Research Methodology
Market Definition and Coverage
This market covers reagents consumed during electrophoresis workflows to separate and visualize DNA, RNA, and proteins, including gels, buffers, dyes, and molecular weight markers, measured as sales value in USD across the covered countries and regions.
Scope exclusions: The sizing excludes electrophoresis instruments, software, and contract testing services.
Segments Covered in This Report
- By Product
- Gels
- Agarose Gels
- Polyacrylamide Gels
- Starch Gels
- Dyes
- Ethidium Bromide (EtBr)
- Bromophenol Blue
- SYBR Dyes
- Other Dyes
- Buffers
- Tris/Acetate/EDTA
- Tris/Borate/EDTA
- Other Buffers
- Other Products
- Gels
- By Technique
- Gel Electrophoresis
- Capillary Electrophoresis
- By End User
- Academic & Research Institutions
- Pharmaceutical & Biotechnology Companies
- Clinical & Diagnostic Laboratories
- Other End Users
- Geography
- North America
- United States
- Canada
- Mexico
- Europe
- Germany
- United Kingdom
- France
- Italy
- Spain
- Rest of Europe
- Asia-Pacific
- China
- Japan
- India
- Australia
- South Korea
- Rest of Asia-Pacific
- Middle East & Africa
- GCC
- South Africa
- Rest of Middle East & Africa
- South America
- Brazil
- Argentina
- Rest of South America
- North America
Data Sources, Market Sizing, and Validation
Desk Research
Desk work starts by mapping what gets consumed in routine electrophoresis runs and where demand comes from, then aligning that with public signals that can be tracked each year. We reviewed sources such as the US FDA and NIH publications, CDC and OECD health and science indicators, UN Comtrade trade statistics for relevant chemical and lab consumables categories, and peer reviewed journals that discuss electrophoresis usage in molecular biology workflows.
To make assumptions more realistic, we used company annual reports, product catalogs, investor presentations, and credible press releases to understand pricing direction, packaging formats, and reagent mix shifts (for example, safer dyes and ready to use buffers). Where helpful, we referenced paid subscriptions for company financials and patent databases, plus an import export shipment level database to sanity check supply movement patterns in major hubs. The sources listed here are illustrative, and many other public references were used during data collection, validation, and clarification.
Primary Interviews and Surveys
Primary work focused on validating how demand gets created and purchased across academic labs, hospitals and diagnostic labs, and pharma and biotech users, because purchase frequency and pack size can vary by setting. We spoke with manufacturers, distributors, lab procurement stakeholders, and workflow specialists across APAC, EMEA, and the Americas to check reagent mix, typical run rates, and price movement assumptions. After that, we adjusted the model where responses showed consistent gaps.
Distribution of primary research fieldwork respondents
| Company type | Respondent position | Region |
|---|---|---|
| Top tier: 31% | CXOs: 16% | APAC: 42% |
| Mid tier: 50% | Functional/Unit leaders: 41% | EMEA: 32% |
| Smaller Players: 19% | Managers: 43% | Americas: 26% |
Market-Sizing & Forecasting
The model is built using a top-down approach where reagent demand is reconstructed from the active lab and clinical testing base, typical electrophoresis run frequency, and the average reagent basket consumed per run, which is then translated into USD using observed price bands. Once that view is formed, we corroborate it with selective bottom-up approximations, such as sampled price per pack times estimated volume by key reagent groups, distributor channel checks, and supplier side revenue splits to correct for over or under counting.
Inputs are kept practical and market-specific, including research funding direction, growth in molecular biology and proteomics activity, adoption of gel versus capillary workflows, movement toward safer stains and premixed buffers, and the share of routine diagnostics versus research driven usage. Where country level data is thin, we handle gaps using proxy indicators like lab infrastructure growth, import intensity for relevant consumables, and expert based penetration assumptions, then cross-check them against regional totals.
Forecasts are produced using multivariate regression supported by scenario checks, so the outlook responds to drivers like funding cycles, testing volumes, and expected pricing changes rather than only extending the past trend. Assumptions that showed high sensitivity were re-tested with primary feedback before finalizing the yearly path.
Data Validation & Update Cycle
Outputs are checked against independent signals such as country level lab spend direction, trade flows for relevant categories, and the observed pace of new assay adoption, then variances are investigated before the numbers are signed off. We run consistency checks across regions and end users, so totals do not grow faster than the underlying demand pool without a clear reason.
Each report is refreshed annually, and interim updates are triggered when there is a material event that can move demand or pricing, such as major regulatory changes, supply disruptions, or step changes in research funding. Before delivery, a final review pass is completed to confirm that the latest public updates and recent interview learnings are reflected in the model.
Mordor Intelligence's Electrophoresis Reagents Market Estimate Compared With Other Published Estimates
Published totals for electrophoresis reagents can look different across sources, even when the market name is the same, because the scope boundary and the pricing basis are not always aligned. Differences also come from the chosen base year, the regions and countries counted, and whether the estimate is tied to consumption signals or mainly to supplier revenue narratives.
Key gap drivers in this market usually come from whether electrophoresis software or adjacent supplies are blended into the definition, how gel and capillary workflows are treated when pricing differs by format, and whether the value is captured at manufacturer invoice level versus a channel or end user spend view. Currency timing and refresh cadence also matter, because small changes in lab consumables inflation and procurement cycles can shift a single-year number.
Benchmark comparison
| Source | Market Size | Gaps in Research Methodology |
|---|---|---|
| Mordor Intelligence | USD 1.34 B (2026) | |
| Trade Publisher A | USD 1.22 B (2024) | Uses an earlier base year and appears to allow a broader technique scope that can mix in software related line items, which changes what is counted as a reagent purchase and can compress the reagent-only total. |
| Industry Report B | USD 1.31 B (2024) | Factory gate sizing is close in concept, but the time cut differs and the forward curve uses a higher near-term growth profile, which can shift how 2024 to 2026 is bridged when pricing and volume trends are updated. |
By tracking run rate and reagent basket assumptions and refreshing the scope checks annually, Mordor Intelligence keeps the count limited to consumable gels, buffers, dyes, and markers, which reduces the risk of quietly adding equipment or software value into the same total. Overall, the spread across publishers mainly reflects definition boundaries and the year chosen for the snapshot, and our approach stays traceable because each uplift is tied back to a clear demand driver or price input.
Key Questions Answered in the Report
What is the current value of the electrophoresis reagents market?
The electrophoresis reagents market stands at USD 1.34 billion in 2026 and is projected to reach USD 1.72 billion by 2031.
Which product category leads the electrophoresis reagents market?
Gels lead with 43.12% revenue share in 2025, remaining indispensable for DNA, RNA, and protein separations.
Which technique is growing fastest in the electrophoresis reagents market?
Capillary electrophoresis is expanding at a 7.55% CAGR to 2031, driven by automation and regulatory compliance needs.
Why is Asia-Pacific important for future electrophoresis reagent sales?
Asia-Pacific is forecast to post a 6.32% CAGR through 2031 as regional research funding rises and local biopharma capacity expands.
How are sustainability trends shaping product development?
Strict disposal rules and ESG mandates are boosting demand for greener dyes and buffers, propelling specialty-dye growth within the electrophoresis reagents market.
Which end-user segment is set to outpace others by 2031?
Pharmaceutical and biotechnology companies are projected to grow at an 8.42% CAGR, reflecting lengthening biologic-drug pipelines and stringent quality requirements.