
Electronically Scanned Array Radar Market Size and Share
Market Overview
| Study Period | 2020 - 2031 |
|---|---|
| Market Size (2026) | USD 11.02 Billion |
| Market Size (2031) | USD 15.48 Billion |
| Growth Rate (2026 - 2031) | 7.05 % |
| Fastest Growing Market | Asia Pacific |
| Largest Market | North America |
| Market Concentration | Medium |
Major Players *Disclaimer: Major Players sorted in no particular order Image © Mordor Intelligence. Reuse requires attribution under CC BY 4.0. | |
Electronically Scanned Array Radar Market Analysis by Mordor Intelligence
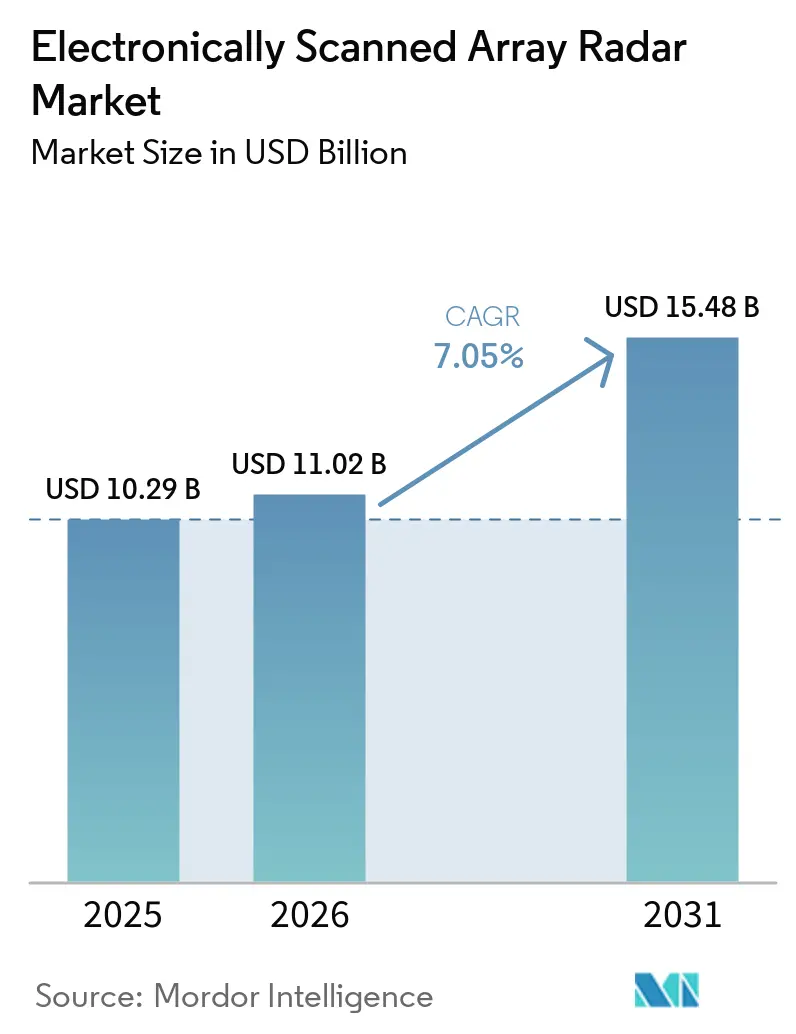
The electronically scanned array (ESA) radar market size was valued at USD 10.29 billion in 2025 and estimated to grow from USD 11.02 billion in 2026 to reach USD 15.48 billion by 2031, at a CAGR of 7.05% during the forecast period (2026-2031). Robust defense spending, especially across the Indo-Pacific and Eastern Europe, is accelerating the shift from mechanically steered units to AESA architectures. Persistent demand for multi-function 4D situational-awareness radars, expanding adoption of gallium-nitride (GaN) transmit/receive modules, and rapid maturation of software-defined beam-forming are reshaping procurement priorities. The market also benefits from AI-enabled threat classification, while retrofit activity on legacy platforms keeps near-term volumes stable. Supply-chain exposure to critical minerals and stringent export-control frameworks temper growth momentum, yet platform diversification and international partnerships continue to broaden addressable demand.
Key Report Takeaways
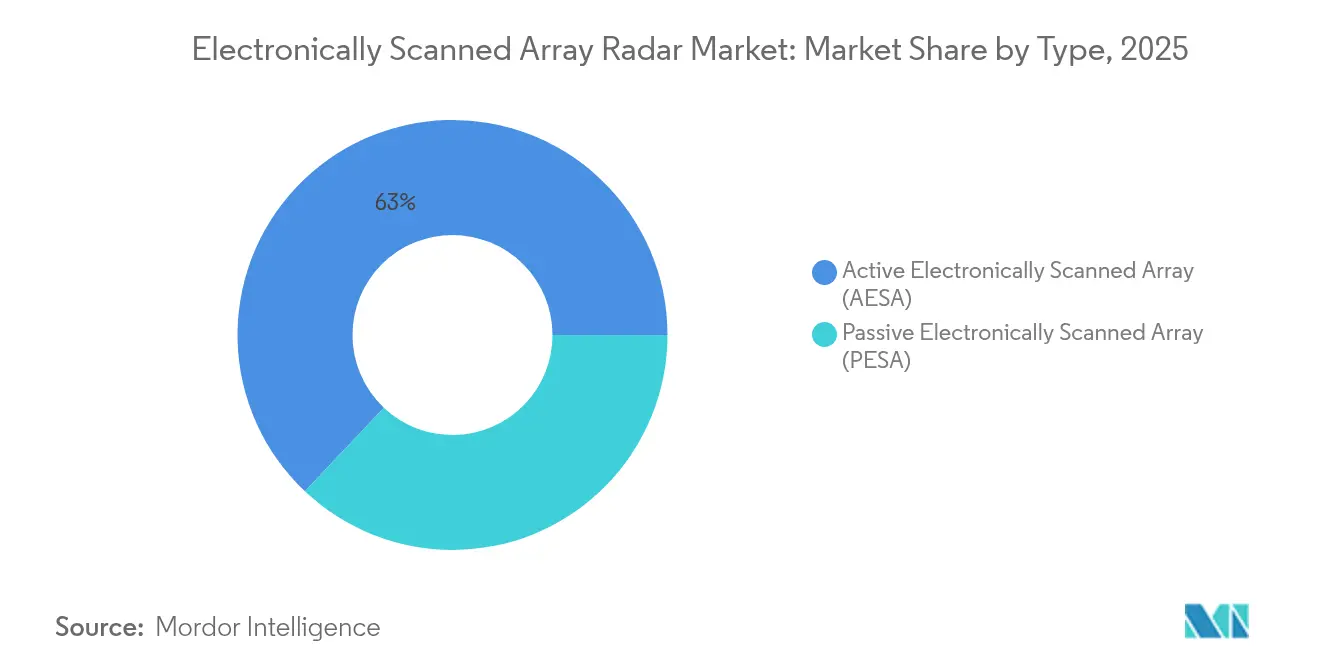
- By type, Active Electronically Scanned Array (AESA) systems led with 62.96% revenue share in 2025, while the segment is set to expand at a 9.32% CAGR to 2031.
- By platform, land-based deployments captured 45.12% of the electronically scanned array radar market share in 2025, while naval platforms recorded the fastest 10.62% CAGR through 2031.
- By fit, line-fit installations commanded 68.23% of the electronically scanned array radar market size in 2025, whereas retrofit solutions grew at a 10.21% CAGR from 2026 to 2031.
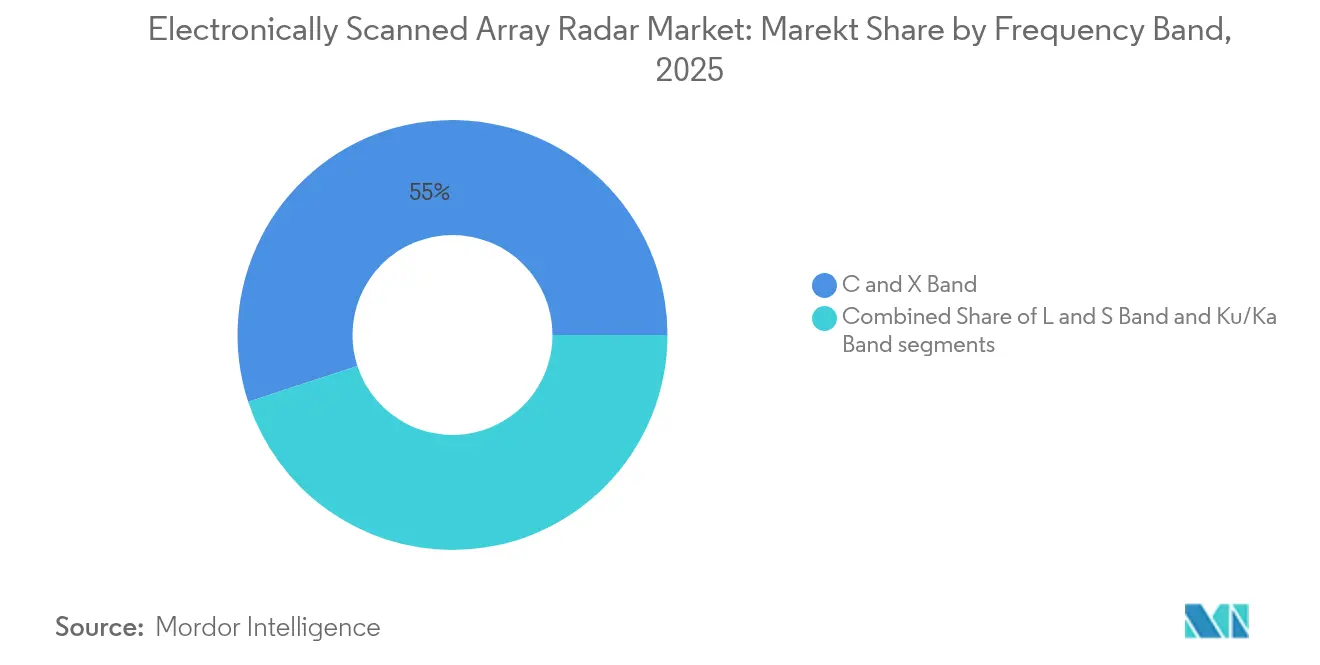
- By frequency band, the C and X band segment accounted for 55.02% share of the market in 2025, while Ku/Ka band products posted an 8.26% CAGR to 2031.
- By application, surveillance and early warning represented a 42.11% share in 2025, and electronic warfare use cases advance at a 10.02% CAGR over the forecast horizon.
- By end-user, defense forces held a 49.35% share in 2025, yet homeland security agencies registered a 9.05% CAGR through 2031.
- By component, antenna aperture and radome hardware contributed 38.41% of revenue in 2025; digital signal processors led growth at 8.14% CAGR.
- By geography, North America maintained a 35.12% share in 2025, whereas Asia-Pacific is projected to post a 9.61% CAGR up to 2031.
Note: Market size and forecast figures in this report are generated using Mordor Intelligence’s proprietary estimation framework, updated with the latest available data and insights as of 2026.
Global Electronically Scanned Array Radar Market Trends and Insights
Drivers Impact Analysis*
| Driver | (~) % Impact on CAGR Forecast | Geographic Relevance | Impact Timeline |
|---|---|---|---|
| Military modernization programs accelerating AESA procurement | +2.1% | Global; North America, Europe, Asia-Pacific | Medium term (2-4 years) |
| Demand for multi-function 4D situational-awareness radars | +1.8% | Global; contested regions | Long term (≥ 4 years) |
| Geopolitical tension–fueled defense budget expansion | +1.5% | North America, Europe, Asia-Pacific | Short term (≤ 2 years) |
| Transition to GaN T/R modules lowering lifecycle cost | +1.2% | Advanced defense markets | Medium term (2-4 years) |
| AI-enabled software-defined beam-forming capabilities | +0.8% | North America, Europe, select Asia-Pacific | Long term (≥ 4 years) |
| Lightweight ESA retrofits for UAVs and attritable platforms | +0.6% | All regions | Medium term (2-4 years) |
| Source: Mordor Intelligence | |||
Military Modernization Programs Accelerating AESA Procurement
AESA capability has shifted from desirable to mandatory for next-generation assets. The US Air Force fielded Northrop Grumman’s AN/TPS-80 G/ATOR, combining five legacy functions into one platform.[1] European states follow, with the UK integrating an advanced Typhoon radar and Estonia procuring Thales GM400α systems. Procurement velocity reflects recognition that legacy mechanically scanned radars cannot support multi-domain operations. AI-enabled modes further magnify mission value. Consequently, defense agencies now treat AESA as foundational infrastructure for network-centric warfare.
Demand for Multi-Function 4D Situational-Awareness Radars
Operators require instantaneous azimuth, elevation, range, and Doppler data. Thales’ NS200 offers full digital beam-forming up to 400 km while supporting swarm defense and missile guidance.[2] Lockheed Martin’s Long-Range Discrimination Radar tracks targets beyond 2,000 km for ballistic-missile defense.[3] Civil aviation’s NextGen program similarly propels demand for advanced surveillance. Convergence of military and civilian needs lowers per-unit cost. The ability to cover multiple missions with one aperture transforms platform design economics.
Geopolitical Tension–Fueled Defense Budget Expansion
Regional flashpoints accelerate spending. Japan raised its defense allocation by 16%, Germany 28 28% in 2024, and Israel lifted outlays by 65% amid active conflict. China placed counter-stealth radar on South China Sea reefs, prompting allied investments. NATO interoperability requirements reinforce standardised AESA procurement. High outlays create virtuous volume effects, pushing system prices down and widening market access for the electronically scanned array radar market.
Transition to GaN T/R Modules Lowering Lifecycle Cost
GaN devices deliver double the power density of GaAs while tolerating higher operating temperatures. Raytheon supplied the first GaN-equipped AN/TPY-2 to the Missile Defense Agency in May 2025.[4] India’s Uttam radar boasts a 25% range uplift thanks to GaN modules. Improved thermal efficiency eases cooling and enables smaller form factors. Commercial automotive radar volumes further compress semiconductor costs, though gallium supply dependence on China remains a strategic concern.
Restraints Impact Analysis*
| Restraint | (~) % Impact on CAGR Forecast | Geographic Relevance | Impact Timeline |
|---|---|---|---|
| High program CAPEX versus legacy systems | -1.8% | Emerging markets | Short term (≤ 2 years) |
| ITAR and export-control constraints | -1.2% | Technology-transfer markets | Long term (≥ 4 years) |
| Thermal-management limits of dense GaN arrays | -0.9% | High-power applications | Medium term (2-4 years) |
| Rare-earth supply-chain fragility for T/R modules | -0.7% | China-dependent markets | Long term (≥ 4 years) |
| Source: Mordor Intelligence | |||
High Program CAPEX Versus Legacy Systems
AESA upgrades carry steep upfront costs. The B-52 radar replacement has surpassed initial estimates and slowed schedules. Northrop Grumman’s USD 121.5 million contract to refurbish B-1 antennas highlights the investment intensity. Complex integration work on power, cooling, and data buses inflates budgets. Smaller defense agencies defer adoption, sustaining a two-tier market for the electronically scanned array radar market.
ITAR and Export-Control Constraints
US export rules classify electronically scanned array radar as Category XI. Licences, technical-assistance agreements, and compliance audits extend project timelines and raise transaction costs. Allies often face delays in replenishing stocks during crises. Restrictions open doors for non-US suppliers, potentially fragmenting technology standards across theatres in the electronically scanned array radar market.
*Our forecasts treat driver/restraint impacts as directional, not additive. The impact forecasts reflect baseline growth, mix effects, and variable interactions.
Segment Analysis
By Type: AESA Dominance Drives Innovation
AESA technology accounted for 62.96% revenue in 2025 as distributed T/R modules eliminated single-point failure, while the segment promises a 9.32% CAGR through 2031. The electronically scanned array radar market benefits as each module scales independently, allowing graceful degradation under battle damage. Passive electronically scanned arrays (PESA) persist in cost-sensitive ground roles, yet falling GaN device pricing narrows the cost gap. AI-driven waveform agility further widens AESA’s performance edge.
Growing demand for resilience against sophisticated jamming favours AESA configurations that can hop frequency and steer beams within microseconds. As volumes rise, manufacturing economies drive unit pricing closer to PESA equivalents, reshaping procurement calculus. Software-defined updates lengthen service life and accelerate capability upgrades. Consequently, the electronically scanned array radar market size for AESA platforms is forecast to reach USD 9.75 billion by 2031, reinforcing its position as the baseline architecture across airborne, maritime, and ground systems.

By Platform: Naval Surge Outpaces Traditional Domains
Land-based systems held a 45.12% share in 2025, yet naval installations are tracking an 10.62% CAGR, the highest across platforms. New-build destroyers, frigates, and amphibious vessels integrate SPY-6, CERETRON, and GhostEye systems, replacing mechanically scanned arrays. Raytheon’s USD 1.18 billion SPY-6 series contract exemplifies volume potential.
The maritime up-cycle reflects Indo-Pacific fleet modernization and the need for distributed missile-defense coverage. Onshore, counter-UAS demand sustains ground segment sales, while airborne upgrades to F-15EX and Gripen E remain robust. Space and high-altitude pseudo-satellites add incremental demand, albeit from a small base. Altogether, the electronically scanned array radar market share for naval platforms is projected to rise four percentage points by 2031 as sea-based ballistic-missile defense becomes a top priority.
By Fit: Retrofit Market Accelerates Modernization
Line-fit deliveries represented 68.23% of 2025 revenue owing to F-35, Type 26, and Constellation-class procurement pipelines. Retrofit activity, however, grows faster at 10.21% CAGR as forces extend legacy fleet life. The APG-79 integration on F/A-18 and SPY-6 back-fit for Nimitz-class carriers illustrates scale.
Modular arrays and common back-end processors simplify insertion, curbing downtime. Digital-through-digital interfaces reduce cabling while embedded cooling plates lower structural modification needs. Retrofitting, therefore, offers near-new performance without the capital outlay of platform replacement, bolstering the electronically scanned array radar market through mid-decade.
By Frequency Band: C and X Band Versatility Prevails
C and X band units generated 55.02% of revenue in 2025. They are prized for their multi-mission flexibility and minimal rain fade. They enable single-aperture execution of air-to-air and surface-search tasks, streamlining topside real estate.
Ku/Ka band arrays expand at 8.26% CAGR on the back of high-resolution imaging and small-drone tracking. Higher frequencies shorten antenna length, allowing mast-mounted or podded solutions on space-constrained platforms. L and S bands remain relevant for long-range early warning. Collectively, the electronically scanned array radar market size for Ku/Ka variants should exceed USD 2.17 billion by 2031 as tactical-UAV proliferation continues.
By Application: Electronic Warfare Capabilities Surge
Surveillance and early warning contributed 42.11% of revenue in 2025, yet electronic warfare (EW) applications clock a 10.02% CAGR through 2031. AESA enables simultaneous radar and jamming, with each module addressing different frequencies. Jane's reports multi-role arrays disrupting adversary data links while retaining search capacity.
Fire-control systems adopt AESA for improved track-while-scan, supporting networked shooters. Civil air traffic control transitions to digitally networked systems under the FAA NextGen roadmap. Growing EW demand ensures the electronically scanned array radar market maintains double-digit growth despite cyclical defense budgets.
By End-User: Homeland Security Adoption Accelerates
Military organizations accounted for 49.35% of revenue in 2025, but homeland security stakeholders expanded fastest at 9.05% CAGR. Border agencies deploy gap-filling radars with unmanned integration to counter low-slow-small threats.
Dual-use procurement leverages common logistics between defense and civil authorities, aiding budget approval. As drone incursions intensify, coastal and critical-infrastructure operators procure cost-efficient AESA units, lifting the electronically scanned array radar industry’s non-military share yearly.
By Component: Digital Processing Drives Innovation
Antenna and radome elements generated 38.41% of the 2025 turnover. However, demand for high-throughput processors positions the DSP segment for an 8.14% CAGR, reflecting AI insertion.
GaN T/R modules remain a pivotal investment area. Supply-chain localization projects in the US, Japan, and India target resilience despite raw-material constraints. Improved thermal-interface materials and direct-to-liquid cooling are under development, ensuring the electronically scanned array radar market remains at the forefront of semiconductor innovation.
Geography Analysis
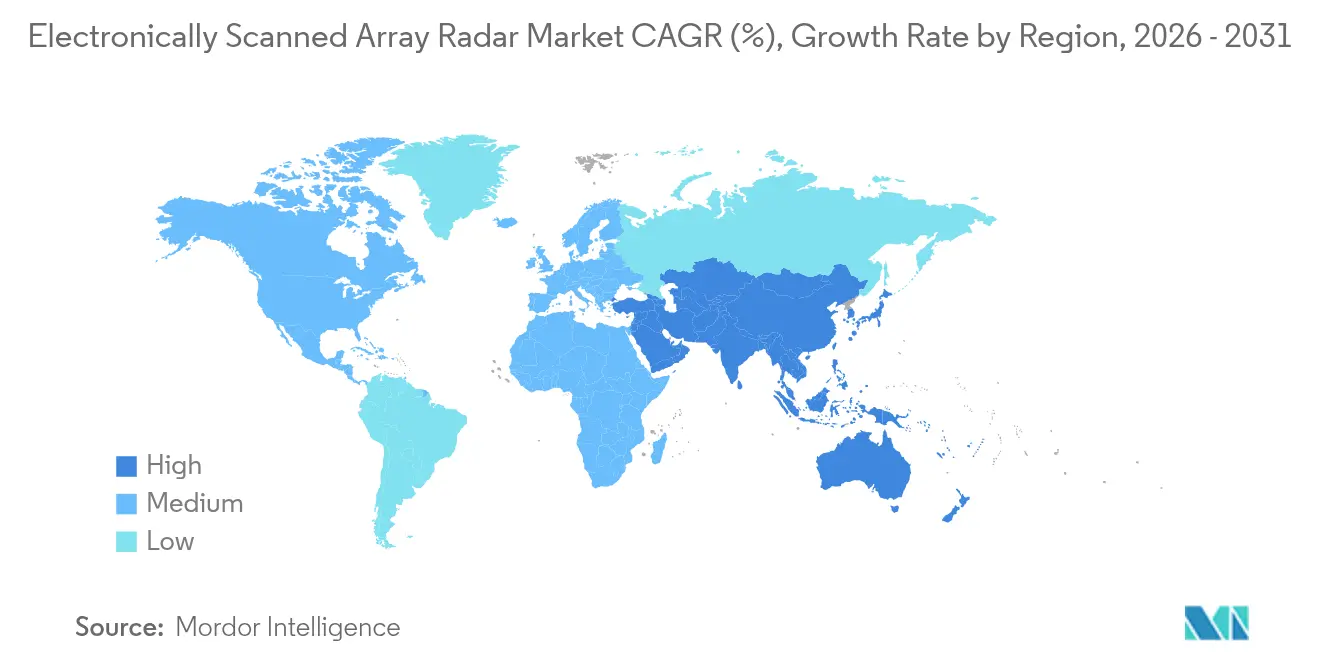
North America retained a 35.12% share in 2025, buoyed by the world’s largest defense budget and a mature industrial base. Multi-year production of SPY-6 and TPY-4 systems underpins regional demand, while artificial-intelligence upgrades to legacy radars lock in aftermarket revenue. Canadian NORAD modernization and Mexican border-security programs provide supplemental orders. Continuous investment in GaN fab capacity positions the region to secure export competitiveness despite rising global rivalry.
Asia-Pacific posts the strongest 9.61% CAGR to 2031. China’s KJ-3000 AEW platform and phased-array coverage on reclaimed South-China-Sea outposts spur neighbours to accelerate buys. Japan’s transfer of FPS-3ME radars to the Philippines and Mongolia demonstrates deepening defense cooperation. India’s indigenously developed Uttam radar showcases ambitions for sovereignty, while South Korea’s Hanwha Systems equips FFX-III frigates with domestic GaN arrays. These combined initiatives elevate the electronically scanned array radar market across the region.
Europe continues to grow steadily as NATO’s integrated-air-and-missile-defense strategy mandates the adoption of standardised AESA. HENSOLDT’s EUR 6.929 billion (USD 8.06 billion) backlog exemplifies continental scale. The EISNET consortium integrates multi-sensor data for real-time command, emphasising software-defined interoperability. Influenced by the Ukraine conflict, Eastern European states prioritise ground-based air-defense radar, while the UK’s Eurofighter upgrades anchor airborne spending. Collectively, European procurement sustains the electronically scanned array radar market share above 25% through the forecast window.
Regulatory Landscape
Electronically scanned array radars operate under dual-use and defense export-control regimes that shape cross-border programs and component sourcing. In the United States, many AESA/ESA radar technologies fall under ITAR (USML Category XI), and depending on configuration, can also trigger Export Administration Regulations controls administered by the Bureau of Industry and Security (BIS). For certain national-security controlled items, this includes worldwide license requirements introduced in late 2024 under 15 CFR 742.4.
In Europe, surveillance radar implementation and associated avionics integration are influenced by equipment and interoperability requirements tied to the Single European Sky framework. International coordination through the Wassenaar Arrangement dual-use control lists continues to guide licensing approaches for sensitive radar-related technologies, including the 2025 list correction published in early 2026. On the funding and industrial-policy side, the European Defence Fund (EDF) 2026-2027 indicative perspective flags collaborative development priorities for multifunction RF systems, reinforcing compliance-driven preferences for sovereign and interoperable architectures alongside exportable configurations.
Value Chain Analysis
The ESA radar value chain begins with upstream materials and semiconductor fabrication for GaN/GaAs, then extends into wafer processing, RF power devices, packaging, and thermal-interface solutions that feed transmit/receive module manufacturing. Midstream suppliers provide high-reliability microelectronics, specialized PCBAs, power-supply line-replaceable units, and timing/control components, which primes and integrators then combine into antenna apertures/radomes, back-end receivers/exciters, and digital signal processing for airborne, land, naval, and space/HAPS platforms.
Downstream, primes deliver line-fit radars to OEM and shipyard new-build programs and execute retrofit/upgrade kits through depot-level integration, supported by long-life sustainment that includes spares, software updates, and obsolescence management. Recent supply-chain actions highlight concentration around the GaN and module stack: HENSOLDT entered a long-term agreement with United Monolithic Semiconductors (UMS) to secure 900,000 GaN components by 2030, while Neways signed a long-term partnership with Thales (10-year duration) to secure radar-related electronic solutions. Localization and partner sourcing have also become more visible, including Lockheed Martin and Fujitsu contracting for SPY-7 subarray-suite power supply LRUs to support a Japan-based supply chain for Japan Maritime Self-Defense Force Aegis System Equipped Vessels.
Competitive Landscape
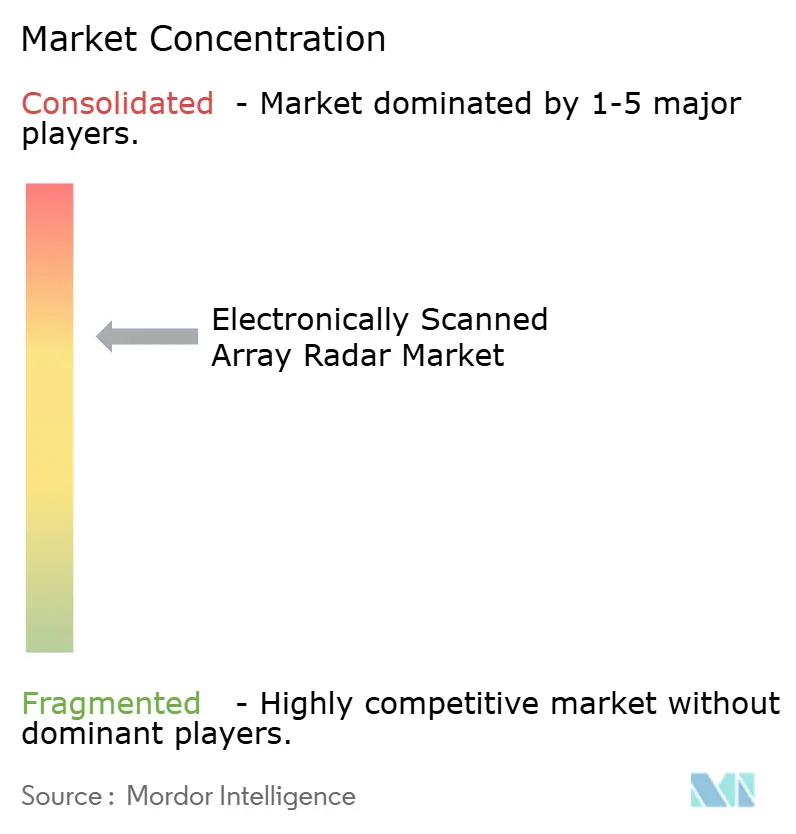
The market exhibits moderate concentration. Lockheed Martin Corporation, Northrop Grumman Corporation, and RTX Corporation collectively account for a major share of global revenue through multi-decade portfolios and vertically integrated R&D pipelines. Raytheon’s real-time cognitive-radar algorithms and GaN manufacturing scale offer competitive moats. Northrop Grumman leverages ground-based multi-mission arrays such as G/ATOR, while Lockheed Martin fields long-range discrimination capability and maritime systems.
Regional champions mature rapidly. HENSOLDT sustains record order intake with TRML-4D and CERETRON software-defined architectures. Saab expands Giraffe production in the UK, while ASELSAN and Hanwha Systems capture domestic naval programs. Partnerships like Norway’s GhostEye collaboration with Raytheon and Kongsberg illustrate co-development as an export-control workaround.
Emerging entrants focus on software-first models, offering modular backends to host third-party waveforms. Such openness appeals to militaries seeking sovereign control over updates. Meanwhile, demand for counter-UAS radars invites smaller firms to use cost-effective digital beam-forming solutions, averting over-engineering. New procurement models, including capability-as-a-service subscriptions for surveillance hotspots, further diversify the electronically scanned array radar market.
Electronically Scanned Array Radar Industry Leaders
-
Northrop Grumman Corporation
-
Lockheed Martin Corporation
-
RTX Corporation
-
Thales Group
-
Leonardo S.p.A
- *Disclaimer: Major Players sorted in no particular order
Market Opportunities and Future Outlook
A meaningful opportunity sits in legacy platform modernization, where AESA retrofits can deliver multi-mission capability without full platform replacement, which aligns with the report scope that excludes software-only upgrades. Program traction includes Northrop Grumman reaching its 1,000th AN/APG-83 SABR delivery (May 2026), plus additional U.S. Department of Defense contracting for AN/APG-83 sets for USAF F-16s (June 2026). Together, these orders support continued demand for retrofit-capable AESA hardware and the installation and support ecosystems around it.
In Europe, near-term demand is closely tied to Typhoon and broader NATO interoperability-driven upgrades, supported by funded production and test activity rather than conceptual roadmaps. The UK Ministry of Defence placed a GBP 453 million contract to manufacture 40 ECRS Mk2 AESA radars for RAF Typhoon (January 2026), and Indra with HENSOLDT commenced live operational testing of ECRS Mk1 for German and Spanish Eurofighter fleets (June 2026). This expands the addressable market for multifunction apertures and software-defined modes across allied fleets. India adds a parallel opportunity track through indigenous development and program-specific radar creation, supported by Centum Electronics securing a contract from Hindustan Aeronautics Ltd to design and develop an AESA radar for the Utility Helicopter-Maritime program (February 2026), which extends demand for domestic module supply, packaging, and qualification capacity.
Recent Industry Developments
- June 2026: RTX (Raytheon) secured a USD 515 million U.S. Navy contract for production and support of the SPY-6 family of radars. The award strengthens multi-year maritime air and missile defense radar throughput and reinforces demand for GaN-enabled arrays and associated subassemblies across ship classes.
- February 2026: Lockheed Martin and Fujitsu signed an initial procurement contract for SPY-7 Subarray Suite Power Supply Line Replaceable Units tied to Japan’s Aegis System Equipped Vessels program. Establishing Japan-based sourcing for critical power-supply hardware supports local industrial participation and reduces program execution risk for in-country radar production and sustainment.
- July 2024: Mitsubishi Electric engaged with RTX (Raytheon) to supply components for the SPY-6(V) radar family for U.S. Navy vessels. The supplier insertion expands the qualified component base for a high-volume naval AESA program and reflects continued diversification of the upstream electronics chain.
Research Methodology Framework and Report Scope
Market Definition and Coverage
For this study, the electronically scanned array (ESA) radar market covers radar systems where beam steering is done electronically through a phased antenna array, and the value is captured as revenue generated from complete radar system sales and major hardware-led upgrades.
Scope exclusions: Mechanical-scan radars, passive RF sensors, and software-only upgrades that do not add new transmit/receive modules are not counted.
Segmentation Overview
- By Type
- Active Electronically Scanned Array (AESA)
- Passive electronically scanned array (PESA)
- By Platform
- Airborne
- Land
- Naval
- Space and High-Altitude Pseudo-Satellites (HAPS)
- By Fit
- Line-fit (new-build)
- Retrofit/Upgrade
- By Frequency Band
- L and S Band
- C and X Band
- Ku/Ka Band
- By Application
- Surveillance/Early-warning
- Fire-control and Weapon-Guidance
- Electronic Warfare and SIGINT
- Weather and Air-Traffic Control
- By End-User
- Defense Forces
- Homeland Security and Border Agencies
- Commercial Aviation and ATC
- By Component
- T/R Module
- Digital Signal Processor
- Antenna Aperture and Radome
- Other Components
- By Geography
- North America
- United States
- Canada
- Mexico
- Europe
- United Kingdom
- France
- Germany
- Russia
- Rest of Europe
- Asia-Pacific
- China
- India
- Japan
- South Korea
- Rest of Asia-Pacific
- South America
- Brazil
- Rest of South America
- Middle East and Africa
- Middle East
- Saudi Arabia
- United Arab Emirates
- Turkey
- Rest of Middle East
- Africa
- South Africa
- Rest of Africa
- Middle East
- North America
Data Sources, Market Sizing, and Validation
Desk Research
Desk research is used to build the base structure of the model and to set realistic guardrails on demand and supply. We reviewed public defense budget documents and procurement releases (such as US DoD budget justification books), parliamentary or audit reports on major programs, and defense trade and customs statistics where applicable.
To anchor technical and deployment context, we also relied on NATO and national MoD publications, aviation and maritime regulator data for platform fleets, peer-reviewed radar and RF engineering journals, and patent databases for AESA and related antenna technologies. Company annual reports, contract announcements, and investor presentations were used to map program timing, delivery waves, and upgrade cycles, and then cross-checked with a paid subscription database for company financials and a global contracts and tenders feed. These examples are not exhaustive, and other public sources were also used for collection, validation, and clarification.
Primary Interviews and Surveys
Primary work was done through interviews and structured surveys with radar OEM-facing stakeholders, subsystem suppliers, defense procurement and sustainment personnel, and domain experts covering air, land, and naval radar deployments. Because the market is global, we balanced inputs across the main buying regions so that platform demand, upgrade pacing, and pricing assumptions could be checked against observed program behavior.
Distribution of primary research fieldwork respondents
| Company type | Respondent position | Region |
|---|---|---|
| Top tier: 29% | CXOs: 17% | APAC: 39% |
| Mid tier: 54% | Functional/Unit leaders: 25% | EMEA: 34% |
| Smaller Players: 17% | Managers: 58% | Americas: 27% |
Market-Sizing & Forecasting
Market sizing starts with a top-down build where defense and aerospace procurement outlays, program counts, and platform fleet inventories are used to reconstruct the addressable radar demand pool by year, and then filtered to electronically steered arrays. Where the data becomes thin, selective bottom-up checks are applied, such as sampled program values, shipment timing from contract awards, and an average selling price range built from configuration clues and upgrade content.
Key inputs that regularly move the totals include the active versus passive ESA mix, retrofit versus new-build share, radar unit counts per platform (for example, fighters and naval combatants), delivery and upgrade cadence tied to modernization plans, and module intensity proxies that track how much hardware is refreshed. For forecasting, scenario analysis is used so that procurement delays, budget reallocations, and accelerated replacement cycles can be stress-tested before the final growth path is set. When a platform or region lacks transparent program disclosure, we fill gaps using comparable fleet sizes and procurement patterns, and then re-check the implied spend against public budget lines.
Data Validation & Update Cycle
Validation is handled through multi-step checks where model outputs are compared against independent signals like annual procurement spending, major contract award totals, and platform delivery schedules, and then reviewed for year-to-year spikes that do not match program timelines. We also run currency and inflation consistency checks so that pricing drift does not get mistaken for real unit growth.
Before sign-off, assumptions that materially change the totals are re-tested through follow-up calls, and the full workbook is peer-reviewed to catch formula errors and scope leakage. The report is refreshed annually, and interim updates are made when major awards, cancellations, or export approvals materially shift the expected delivery profile. Right before delivery, a final analyst pass is done so clients receive the latest updated view.
Mordor Intelligence's Electronically Scanned Array Radar Market Size Measured Against Other Published Estimates
Published market sizes for ESA radars often differ because each publisher sets its own definition for what counts as ESA content, and because program visibility varies across countries and platforms. Differences also come from how upgrade revenue is handled, whether values are stated in nominal or constant dollars, and how currency timing is applied.
Software-only radar upgrades sit outside Mordor Intelligence's scope, which is one reason the 2025 total can look higher or lower than estimates that blend in signal processing refresh work without new transmit/receive hardware. Other gaps usually come from mixing broader electronically scanned arrays that include non-radar applications, or from using aggressive program acceleration assumptions that are not supported by budget documents and delivery schedules.
Benchmark comparison
| Source | Market Size | Gaps in Research Methodology |
|---|---|---|
| Mordor Intelligence | USD 10.29 B (2025) | |
| Industry Research Publisher A | USD 8.70 B (2024) | Uses a broader electronically scanned array market framing, which can blend radar and adjacent non-radar array uses, and the base year is different, making direct comparison sensitive to defense procurement timing. |
| Industry Research Publisher B | USD 6.17 B (2025) | Appears to focus on a narrower radar subset by application (air, land, sea) and may exclude space and HAPS-related deployments, which can reduce the captured revenue pool in years with active program awards. |
The table shows that most of the spread is explained by scope width and what gets counted as revenue-bearing hardware versus broader array activity. When the same year, platform coverage, and upgrade rules are aligned, the range typically tightens, and the remaining difference is mostly due to procurement timing and currency conversion choices that move year-specific totals.
Key Questions Answered in the Report
What is the current electronically scanned array radar market size?
The market is valued at USD 11.02 billion in 2026 and is projected to reach USD 15.48 billion by 2031, advancing at a 7.05% CAGR.
Which platform segment will expand the fastest?
Naval platforms lead growth with an 10.62% CAGR to 2031, driven by fleet modernization and maritime ballistic-missile defense investments.
Why is GaN technology important for AESA radars?
GaN transmit/receive modules offer double the power density of GaAs, lower cooling needs and longer service life, which together cut lifecycle costs and enhance performance.
How significant is Asia-Pacific to future growth?
Asia-Pacific records a 9.61% CAGR thanks to sustained Chinese, Japanese and Indian procurement plus regional partnership programs.
What role does artificial intelligence play in next-generation radars?
AI enables real-time beamforming, threat prioritization and adaptive waveforms, boosting resilience against complex jamming and reducing operator workload.
How do export-control regulations affect international sales?
ITAR and other export rules extend approval timelines and restrict technology transfer, pushing some nations to source from non-US suppliers or develop indigenous solutions.