Electronic Warfare Market Size and Share
Market Overview
| Study Period | 2019 - 2030 |
|---|---|
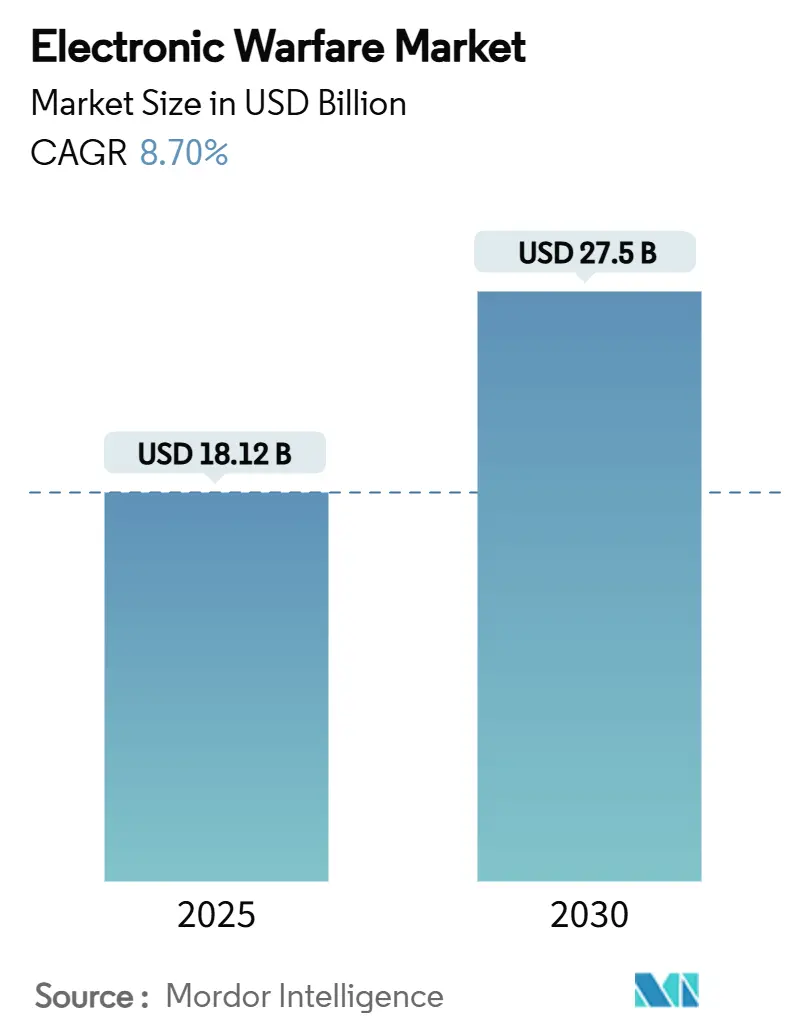
| Market Size (2025) | USD 18.12 Billion |
| Market Size (2030) | USD 27.5 Billion |
| Growth Rate (2025 - 2030) | 8.70% CAGR |
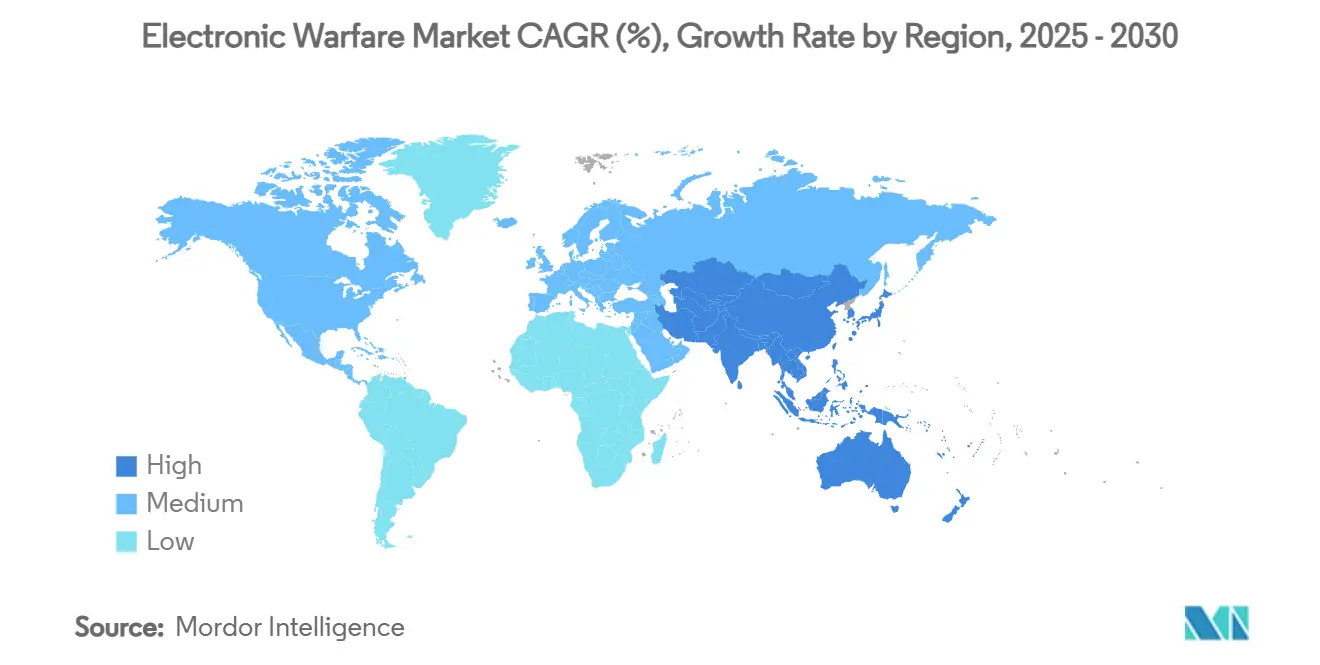
| Fastest Growing Market | North America |
| Largest Market | Asia Pacific |
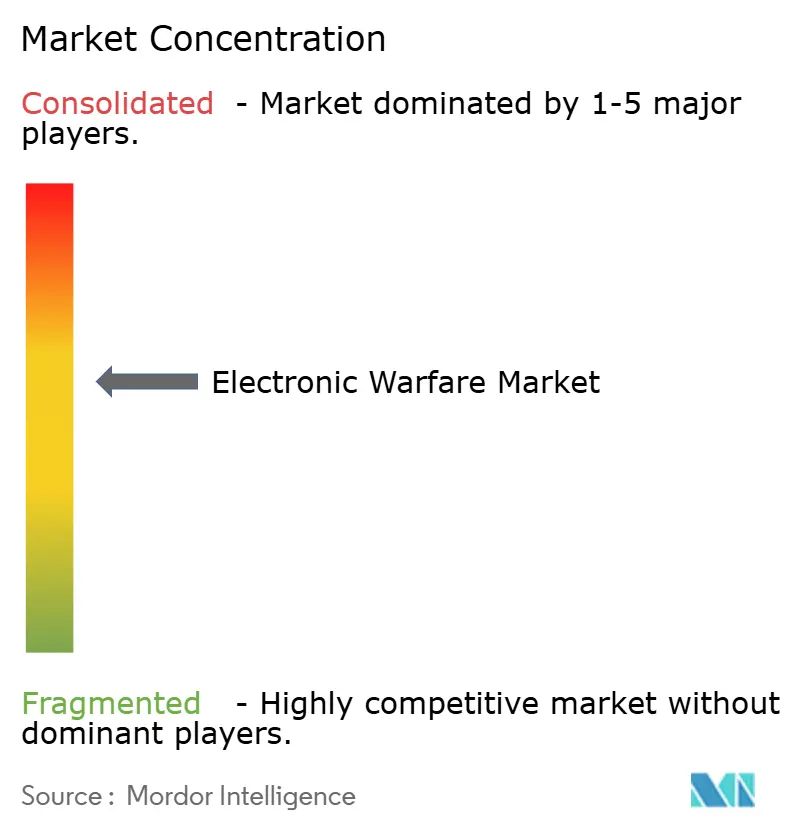
| Market Concentration | Medium |
Major Players *Disclaimer: Major Players sorted in no particular order Image © Mordor Intelligence. Reuse requires attribution under CC BY 4.0. | |
Electronic Warfare Market Analysis by Mordor Intelligence
The electronic warfare market size is USD 18.12 billion in 2025 and is projected to reach USD 27.50 billion by 2030, representing an 8.70% CAGR. Demand is driven by rapid defense modernization cycles, the spread of GaN semiconductors, AI-driven cognitive jamming, and the first operational moves toward space-based EW constellations. Heightened geopolitical tensions in Eastern Europe and the Indo-Pacific are accelerating procurement programs as armed forces race to secure spectrum dominance. Airborne platforms remain the prime battleground, yet directed-energy payloads and counter-unmanned aerial system (counter-UAS) suites open additional value pools. Supply-chain risks around gallium and tightening semiconductor export rules inject volatility and stimulate reshoring strategies across North America and Europe. Competitive intensity is moderate, with legacy primes defending incumbent positions while smaller entrants exploit open-architecture mandates to field software-defined products that cut size, weight, and power (SWaP).
Key Report Takeaways
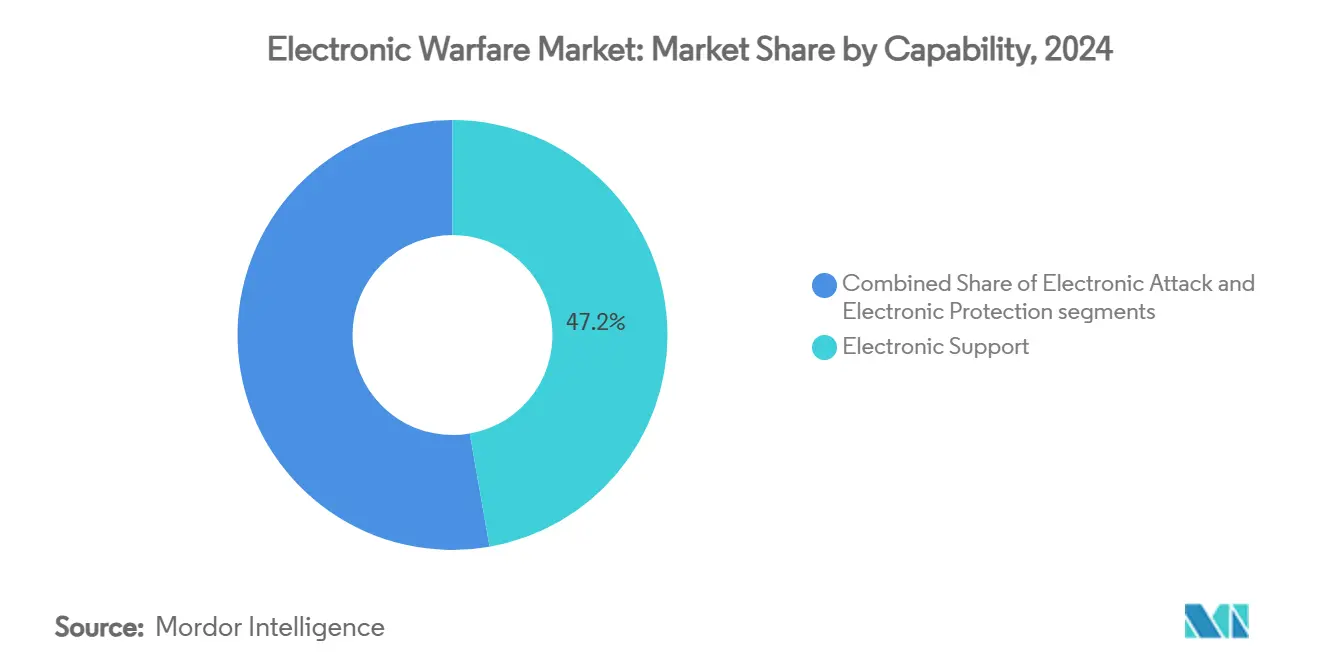
- By capability, electronic support captured 47.24% of the electronic warfare market share in 2024 and is expanding at a 9.39% CAGR through 2030, underscoring its role as the sensory backbone of spectrum operations.
- By platform, air assets accounted for 48.12% of 2024 revenue, whereas space assets are projected to rise at an 11.80% CAGR to 2030 as countries fund satellite-based electronic intelligence constellations.
- By equipment, jammer systems accounted for 39.23% of the electronic warfare market in 2024; directed energy weapons (DEWs) led growth with a 9.45% CAGR, driven by high-power microwave deployments.
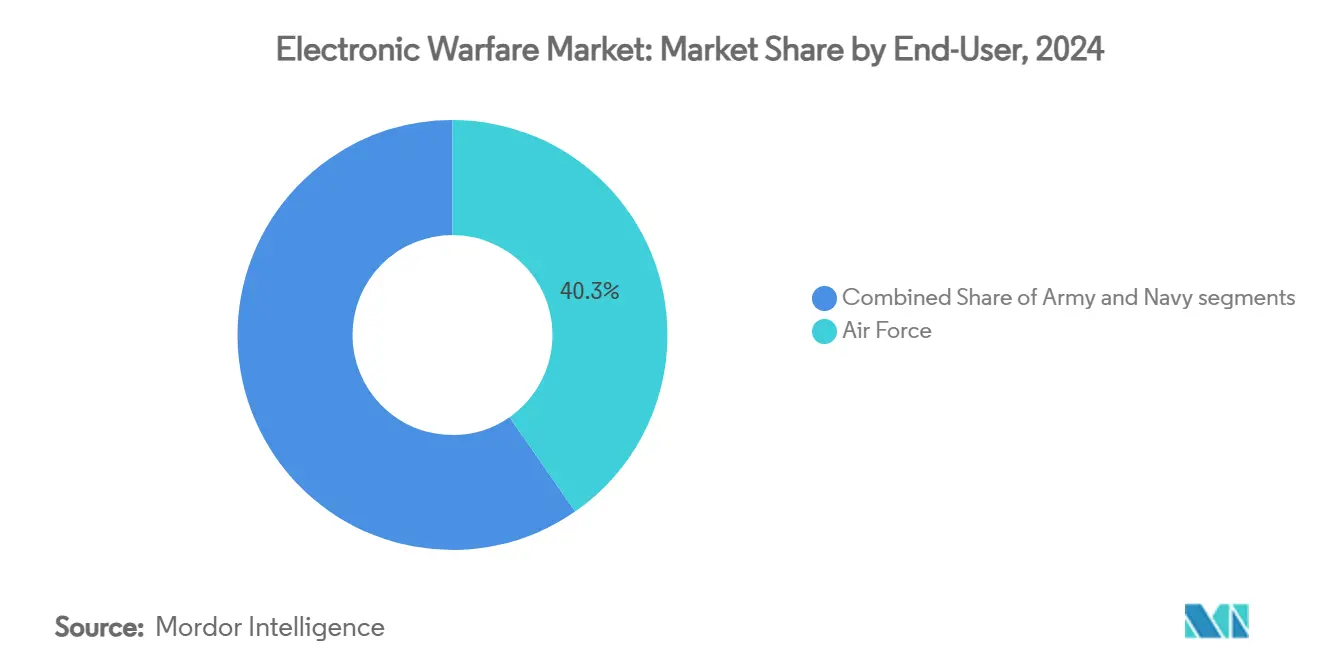
- By end user, the air force segment retained a 40.34% share in 2024, while naval programs posted the fastest 9.54% CAGR through 2030, amid fleet-wide EW upgrades.
- By fit, retrofit and upgrade projects commanded 59.39% of 2024 spending, while OEM installations advanced at a 10.32% CAGR.
- By geography, North America commanded 40.33% in 2024, while the Asia-Pacific region advances at a 9.91% CAGR, as China’s assertiveness prompts counter-investments from its allies.
Note: Market size and forecast figures in this report are generated using Mordor Intelligence’s proprietary estimation framework, updated with the latest available data and insights as of January 2026.
Global Electronic Warfare Market Trends and Insights
Drivers Impact Analysis
| Driver | (%) Impact on CAGR Forecast | Geographic Relevance | Impact Timeline |
|---|---|---|---|
| Escalating geopolitical tensions and defence modernization | + 1.50% | North America, Europe, Asia-Pacific | Medium term (2-4 years) |
| Surge in unmanned platforms requiring EW payloads | + 1.20% | North America, Asia-Pacific | Short term (≤ 2 years) |
| Evolution of radar/comm threats necessitating advanced EW | + 1.80% | Europe, Asia-Pacific | Long term (≥ 4 years) |
| COTS GaN enabling low-SWaP EW on small drones | + 0.90% | North America, Europe | Medium term (2-4 years) |
| AI/ML-driven cognitive EW for adaptive jamming | + 1.10% | North America, Europe, advanced Asia-Pacific | Long term (≥ 4 years) |
| Orbital opportunities from satellite mega-constellations | + 0.80% | Global | Long term (≥ 4 years) |
| Source: Mordor Intelligence | |||
Escalating Geopolitical Tensions and Defense Modernization
EW proved decisive during the Russia–Ukraine conflict, prompting NATO members to realign budgets toward spectrum-dominance programs. Germany is converting 15 Eurofighters and an A400M variant for dedicated electronic-attack duties. Parallel pressure in the South China Sea spurred Japan and South Korea to accelerate indigenous electronic-warfare roadmaps. Procurement now follows an urgent cadence independent of traditional multi-year cycles. Defense ministries are increasingly bundling cyber and EW line items to secure joint funding, thereby cementing a demand pathway through 2030. Governments also prioritize sovereign supply chains to mitigate gallium scarcity, channeling grants into domestic semiconductor fabs.
Surge in Unmanned Platforms Requiring EW Payloads
Medium-altitude long-endurance (MALE) UAVs fly with modular pods such as Angry Kitten, enabling real-time jamming against peer threats. Commercial gallium-nitride chips allow high-power output without breaching strict weight envelopes, opening the electronic warfare market to small UAV classes. Loyal-wingman concepts generate an installed-base multiplier effect because each crewed fighter may team with several autonomous escorts, all of which need self-protective suites. Operators field swarms for maritime surveillance, compelling equivalent counter-programs among US and Australian forces under AUKUS. The trend compresses development cycles, shifting value from hardware to agile firmware updates delivered over secure links.
Evolution of Radar and Communication Threats
Adversaries deploy agile waveforms and quantum-resilient links that defeat legacy noise jamming. Programs such as DARPA’s Adaptive Radar Countermeasures utilize ML libraries that can recognize unknown emitters within milliseconds, then tailor response waveforms accordingly.[1]Stephen Frahm, “Adaptive Radar Countermeasures,” Rand.org Emerging quantum radar further challenges stealth assets, forcing investments in broader-band decoys and digital-radio-frequency-memory techniques. The military integration of 5G and early 6G introduces complexities because EW suites must simultaneously cover sub-6 GHz through mm-wave bands. Consequently, research budgets emphasize software-defined architectures capable of remote re-parameterization via over-the-air (OTA) updates.
COTS GaN Enabling Low-SWaP EW on Small Drones
GaN devices deliver higher power density than gallium arsenide and silicon, enabling broadband electronic-attack payloads in footprints suitable for quadcopters or loitering munitions.[2]Duncan Tift, “GaN broadens low-SWaP horizons,” IEEE.org Commercial availability compresses cost curves, letting mid-tier suppliers enter the electronic warfare industry with niche solutions. One obstacle is China’s 98% hold on gallium supply, which prompts Western allies to stockpile and seek alternate refining hubs. Despite supply-risk hedging, GaN adoption remains pivotal for extending electronic-warfare coverage to every echelon, from squad-level drones to hypersonic glide vehicles.
Restraints Impact Analysis
| Restraint | (%) Impact on CAGR Forecast | Geographic Relevance | Impact Timeline |
|---|---|---|---|
| High program cost and long development cycles | -0.70% | Global, harsher on smaller budgets | Long term (≥ 4 years) |
| Spectrum management and regulatory hurdles | -0.60% | Global, varying by region | Medium term (2-4 years) |
| Cyber-enabled spoofing vulnerability of EW suites | -0.40% | Advanced-threat environments | Short term (≤ 2 years) |
| Tightening export controls on advanced semiconductors | -0.50% | US–China technology flow | Medium term (2-4 years) |
| Source: Mordor Intelligence | |||
High Program Cost and Long Development Cycles
Complex multi-band architectures require decade-long R&D efforts to pass electromagnetic compatibility tests across air, sea, land, and space. Subsystems often outlive semiconductor production runs, forcing mid-life component re-designs that inflate total ownership cost. Smaller defense ministries struggle to fund comprehensive solutions, opting instead for incremental retrofits that dilute their capabilities. Consequently, the electronic warfare market is tilting toward modular, open-systems approaches to shorten certification loops and rein in budgets.
Spectrum Management and Regulatory Hurdles
Civil-5G expansion encroaches on historically military bands, requiring real-time spectrum-sharing protocols that add design complexity. Cross-border operations need diplomatic coordination to prevent collateral interference, elongating deployment schedules. Mega-constellation satellites introduce further congestion, compelling electronic-warfare planners to incorporate sophisticated interference-avoidance algorithms that escalate program cost and delay fielding.
Segment Analysis
By Capability: Electronic Support Dominates Intelligence Gathering
Electronic support generated 47.24% of 2024 revenue and is expected to expand at a 9.39% CAGR, representing the largest slice of the electronic warfare market size for capabilities. The segment’s growth is anchored in AI-enabled detection arrays that geolocate emitters in complex urban canyons. Demand also benefits from joint-all-domain concepts that fuse radio-frequency data with cyber-intelligence feeds for unified situational awareness.
Electronic attack follows as the next-largest slice, fueled by cognitive jammers able to retune in microseconds when adversaries hop frequencies. Electronic protection gains renewed relevance because forces must harden communications against noise jamming and deceptive spoofing. Together, the three pillars create a virtuous upgrade cycle that sustains wider electronic warfare market expansion through 2030.
Note: Segment shares of all individual segments available upon report purchase


By Platform: Air Superiority Drives Space Expansion
Air platforms generated 48.12% of 2024 revenue, confirming fixed-wing aircraft as the prime theater for spectrum dominance initiatives.[3] L3Harris Technologies, “Behavioral Learning for Adaptive EW advances,” L3harris.com Fleet upgrades now favor lighter, software-defined pods that link directly with active electronically scanned array (EASA) radars and share threat libraries across joint networks. Rotary-wing fleets follow suit, adopting low SWaP self-protect suites to survive short-range air-defense ambushes.
Although still nascent, space assets are projected to post the highest 11.80% CAGR as mega-constellations move electronic-support receivers into low-Earth orbit (LEO) for global geolocation coverage. Sea and land platforms maintain steady procurement: navies focus on submarine electronic-support masts that patrol littorals. At the same time, armies field truck-mounted counter-UAS jammers to protect maneuver brigades against low-cost drone swarms.
By Equipment: Jammers Lead While Directed Energy Surges
Jammer systems accounted for 39.23% of 2024 spending, reflecting their role as frontline offensive tools that now utilize GaN transistors for broadband coverage within compact, drone-ready housings. Digital radio frequency memory (DRFM) modules enhance deception techniques by replaying falsified echoes rather than simple noise pulses. Radar-warning receivers remain indispensable, alerting crews within microseconds of hostile illumination, and they increasingly share data with cyber-defense cells for unified threat hunting.
Directed energy weapons (DEWs) are projected to grow at a 9.45% CAGR, buoyed by the USD 250 million raised for the Leonidas microwave array, which can neutralize multiple drones in a single pulse. Counter-UAS EW suites close the loop, providing commanders with a layered toolset that combines kinetic and non-kinetic defeat options against low-altitude incursions.
By End-User: Air Force Leads Naval Modernization
Air force customers owned 40.34% of 2024 revenue, underscoring sustained investment in podded systems for fifth-generation fighters and autonomous wingmen that must survive GPS-denied missions. Digital backbones push firmware updates over encrypted links while jets remain on the flight line, compressing sustainment timelines.
Navies are expected to record the fastest 9.54% CAGR through 2030, with a USD 587 million surface-fleet contract illustrating the carrier group's urgency to defeat over-the-horizon missile salvos. Armies pivot toward mobile anti-drone batteries tied to electronic-support vehicles that scout spectrum hot spots ahead of mechanized advances.
Note: Segment shares of all individual segments available upon report purchase
By Fit: Upgrades Dominate OEM Growth
Retrofit and upgrade programs captured 59.39% of the 2024 value, as legacy hulls and airframes receive modular apertures that drop into existing wiring and share power buses with minimal structural change. Software-defined waveforms enable operators to add new threat libraries without requiring depot-level hardware swaps, making upgrades a cost-effective hedge against agile adversaries.
However, original-equipment-manufacturer (OEM) installations climb at a 10.32% CAGR because sixth-generation fighters, optionally manned surface vessels, and hybrid VTOL drones embed EW apertures from day one. Standardized open-system interfaces ensure aftermarket competition, compressing lifecycle costs and enabling plug-and-play refresh cycles every 18 to 24 months.
Geography Analysis
North America retained 40.33% of 2024 revenue, anchored by the US’s USD 21 billion five-year outlay and a FY 2025 RDT&E budget of USD 141 billion. Canada’s NORAD modernization and Mexico’s nascent defense upgrades provide ancillary lift, but US procurements dominate regional totals. Robust local industrial capacity ensures secure supply chains, though gallium sourcing remains an external vulnerability.
Asia-Pacific is the fastest-growing geography, with a 9.91% CAGR between 2025 and 2030. China’s satellite-rich Guowang network and EW deployments in the South China Sea encourage countermoves from Japan, South Korea, Australia, and India.[4]Northrop Grumman, “Mitsubishi Electric partnership strengthens Japan EW,” Northropgrumman.com Regional collaborations, including AUKUS technology exchanges, accelerate indigenous capability while diversifying supplier bases. Combined, these dynamics broaden the electronic warfare market in a region where maritime disputes set high operational stakes.
Europe registers steady expansion as NATO acknowledges capability gaps exposed in Ukraine. Germany’s Eurofighter conversions and the UK’s acquisitions, such as Kirintec, push sovereign development, while Franco-Italian frigate programs integrate new jamming suites. EU initiatives to pool procurement funds further stabilize demand amid fiscal constraints. The Middle East and Africa contribute to supplemental growth; Gulf states increased their defense budgets by 21.80% to USD 195.40 billion in 2024, with a focus on counter-missile and UAV defenses.

Competitive Landscape
The competitive field is moderately fragmented. Lockheed Martin Corporation, Northrop Grumman Corporation, RTX Corporation, and L3Harris Technologies, Inc. anchor long-standing relationships and full-service sustainment agreements. L3Harris secured a USD 587 million US Navy contract for shipboard EW upgrades, reinforcing its prime position. Yet, smaller firms exploit commercial off-the-shelf (COTS) semiconductors and open architectures to win subsystem spots; Epirus’s Leonidas microwave array and Shield AI’s cognitive-jamming modules exemplify the disruptor wave.
Mergers reshape scale advantages. AeroVironment’s USD 4.1 billion purchase of BlueHalo expands drone-swarm expertise while BAE Systems’ acquisition of Kirintec bolsters counter-UAS portfolios.[5]Tim Martin, “Italy opts for EA-37A export,” Breakingdefense.com Strategic partnerships bridge capability gaps: L3Harris and Shield AI pair EW pedigree with advanced autonomy, while Joby Aviation joins L3Harris to adapt VTOL aircraft for spectrum operations. Software-defined roadmaps shift revenue emphasis from hardware sales to lifecycle firmware update contracts, benefiting agile vendors.
Western companies confront supply-chain uncertainty as China controls gallium production, a critical component for GaN devices. Firms respond via stockpiling and co-investments in alternative refining hubs. Meanwhile, open-system mandates and modular hardware invite niche providers to enter specific frequency bands, ensuring the electronic warfare market remains dynamic.
Electronic Warfare Industry Leaders
Lockheed Martin Corporation
Northrop Grumman Corporation
RTX Corporation
L3Harris Technologies, Inc.
BAE Systems plc
- *Disclaimer: Major Players sorted in no particular order

Recent Industry Developments
- August 2025: L3Harris and Joby Aviation launched a hybrid VTOL demonstrator to host EW payloads, with flight tests slated for the fourth quarter of 2025.
- July 2025: Italy signed the first EA-37A export agreement with L3Harris, signaling a European appetite for advanced standoff jamming suites.
- April 2025: UAE-based EDGE Group expanded its Brazilian presence through counter-drone and missile-defense agreements, broadening its EW reach in South America.
- February 2025: L3Harris teamed with Shield AI to co-develop AI-powered EW systems for adaptive jamming.


Global Electronic Warfare Market Report Scope
Electronic Warfare involves using electromagnetic spectrum signals such as radio, infrared, or radar to attack or impede enemy operations. Moreover, electronic warfare can help disrupt, deny, and degrade the ability of enemy forces to use such electromagnetic signals.
The electronic warfare market is segmented by capability, platform, and geography. By capability, the market is segmented into electronic attack, electronic protection, and electronic support. By platform, the market is segmented into air, sea, land, and space. The report also covers the market sizes and forecasts for the electronic warfare market in major countries across different regions. For each segment, the market size is provided in terms of value (USD).
| Electronic Attack |
| Electronic Protection |
| Electronic Support |
| Air |
| Sea |
| Land |
| Space |
| Jammer Systems |
| Radar Warning Receivers |
| Directed Energy Weapons |
| Counter-UAS EW Suites |
| Other Equipments |
| Air Force |
| Navy |
| Army |
| OEM |
| Retrofit/Upgrades |
| North America | United States | |
| Canada | ||
| Mexico | ||
| Europe | United Kingdom | |
| France | ||
| Germany | ||
| Russia | ||
| Rest of Europe | ||
| Asia-Pacific | China | |
| India | ||
| Japan | ||
| South Korea | ||
| Rest of Asia-Pacific | ||
| South America | Brazil | |
| Rest of South America | ||
| Middle East and Africa | Middle East | Saudi Arabia |
| United Arab Emirates | ||
| Turkey | ||
| Rest of Middle East | ||
| Africa | South Africa | |
| Rest of Africa | ||
| By Capability | Electronic Attack | ||
| Electronic Protection | |||
| Electronic Support | |||
| By Platform | Air | ||
| Sea | |||
| Land | |||
| Space | |||
| By Equipment | Jammer Systems | ||
| Radar Warning Receivers | |||
| Directed Energy Weapons | |||
| Counter-UAS EW Suites | |||
| Other Equipments | |||
| By End-User | Air Force | ||
| Navy | |||
| Army | |||
| By Fit | OEM | ||
| Retrofit/Upgrades | |||
| By Geography | North America | United States | |
| Canada | |||
| Mexico | |||
| Europe | United Kingdom | ||
| France | |||
| Germany | |||
| Russia | |||
| Rest of Europe | |||
| Asia-Pacific | China | ||
| India | |||
| Japan | |||
| South Korea | |||
| Rest of Asia-Pacific | |||
| South America | Brazil | ||
| Rest of South America | |||
| Middle East and Africa | Middle East | Saudi Arabia | |
| United Arab Emirates | |||
| Turkey | |||
| Rest of Middle East | |||
| Africa | South Africa | ||
| Rest of Africa | |||


Key Questions Answered in the Report
What is the projected value of the electronic warfare market by 2030?
The electronic warfare market is expected to reach USD 27.50 billion by 2030, reflecting an 8.70% CAGR.
Which capability segment generates the largest revenue today?
Electronic support leads with 47.24% of 2024 revenue owing to its role in threat detection and geolocation.
Why is Asia-Pacific the fastest-growing region?
Regional tension and China’s rapid modernization drive a 9.91% CAGR as Japan, Australia, and others invest heavily in counter-EW programs.
How are directed-energy systems influencing procurement?
High-power microwave and laser solutions, now posting a 9.45% CAGR, attract funding for drone-swarm defense and area denial missions.
What supply-chain risk concerns program managers most?
China’s 98% share of gallium production, vital for GaN chips, poses a strategic vulnerability prompting Western stockpiling.
Which companies recently partnered to integrate AI into electronic warfare?
In February 2025, L3Harris and Shield AI collaborated to develop cognitive-jamming solutions.
Page last updated on:


