
Electrodeionization (EDI) Technology Market Size and Share
Market Overview
| Study Period | 2021 - 2031 |
|---|---|
| Market Size (2026) | USD 0.95 Billion |
| Market Size (2031) | USD 1.32 Billion |
| Growth Rate (2026 - 2031) | 6.77% CAGR |
| Fastest Growing Market | Asia Pacific |
| Largest Market | Asia Pacific |
| Market Concentration | Medium |
Major Players *Disclaimer: Major Players sorted in no particular order Image © Mordor Intelligence. Reuse requires attribution under CC BY 4.0. | |
Electrodeionization (EDI) Technology Market Analysis by Mordor Intelligence
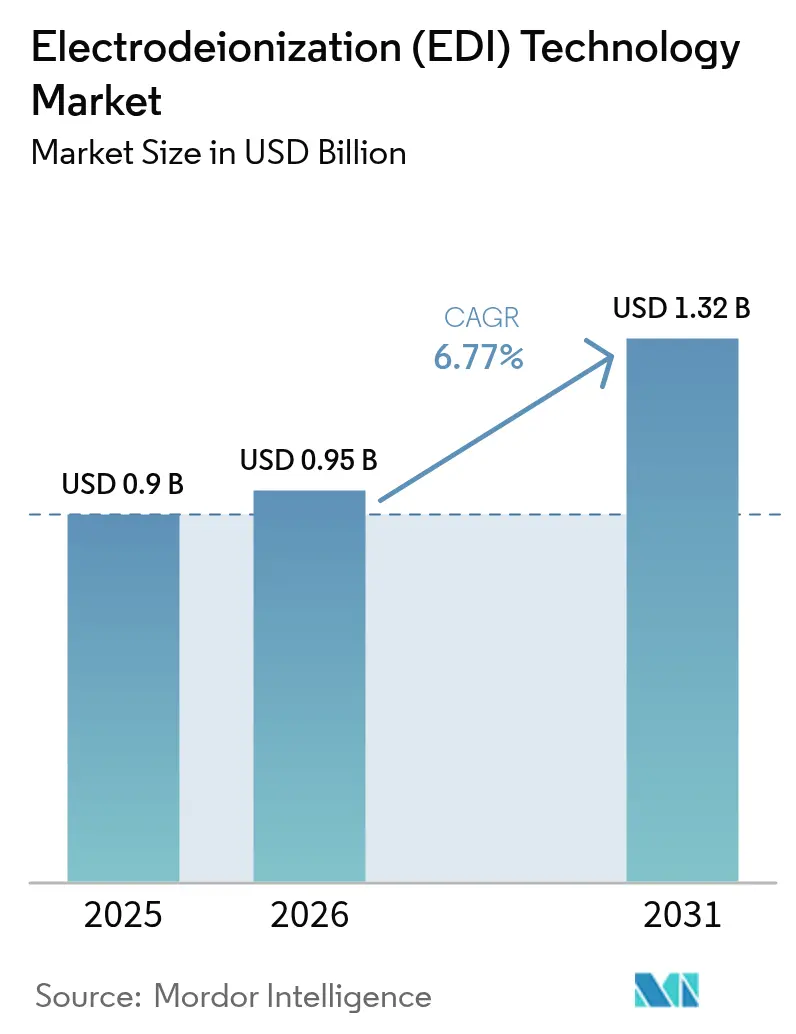
The Electrodeionization Technology Market size is expected to increase from USD 0.9 billion in 2025 to USD 0.95 billion in 2026 and reach USD 1.32 billion by 2031, growing at a CAGR of 6.77% over 2026-2031. Five converging forces sustain this climb. Green-hydrogen electrolyzers require water conductivity below 0.1 µS/cm, positioning EDI as the polishing step after reverse osmosis. Continuous bioprocessing lines in cell- and gene-therapy facilities turn to chemical-free EDI modules to avoid batch resin downtime. Edge and micro data centers prefer modular skids that fit tight footprints and eliminate hazardous regenerants. Tougher PFAS discharge limits create a pull for EDI over mixed-bed ion exchange. Finally, direct-lithium-extraction plants in South American salars adopt ultra-low-conductivity makeup water to protect membranes. Taken together, these elements lock in double-digit annual additions across the electrodeionization technology market.
Key Report Takeaways
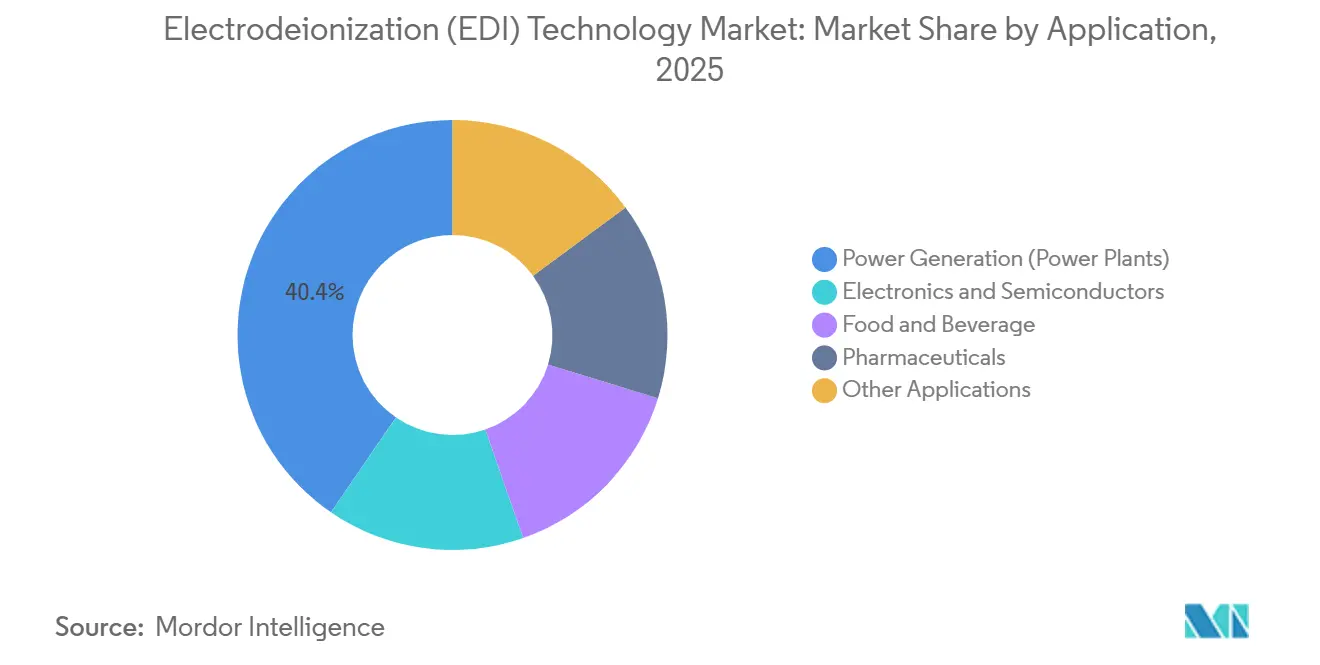
- By application, power generation led with 40.44% of the electrodeionization technology market share in 2025, while pharmaceuticals are forecast to expand at a 7.20% CAGR through 2031, the fastest pace among end users.
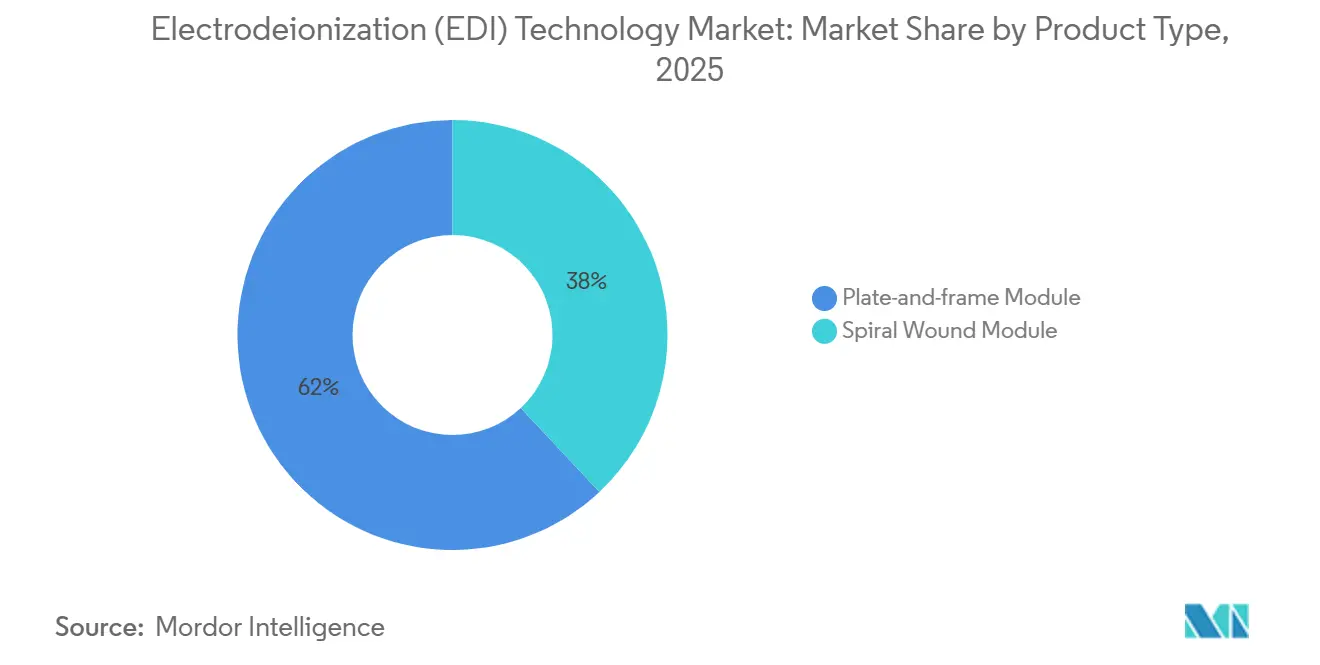
- By product type, plate-and-frame modules captured 61.97% revenue in 2025; spiral-wound modules are projected to post the highest 6.88% CAGR to 2031.
- By geography, Asia-Pacific commanded 41.69% of 2025 sales and is advancing at an 8.05% CAGR through 2031 on semiconductor self-sufficiency programs and hyperscale data-center builds.
Note: Market size and forecast figures in this report are generated using Mordor Intelligence’s proprietary estimation framework, updated with the latest available data and insights as of 2026.
Global Electrodeionization (EDI) Technology Market Trends and Insights
Drivers Impact Analysis*
| Drivers | (~) % Impact on CAGR Forecast | Geographic Relevance | Impact Timeline |
|---|---|---|---|
| Green-Hydrogen Electrolyzer Demand for Ultrapure Water | +1.8% | Europe, North America, APAC hydrogen hubs | Medium term (2-4 years) |
| Continuous Bioprocessing Adoption in Cell and Gene-Therapy Plants | +1.5% | Global, concentrated in U.S., Germany, Switzerland | Medium term (2-4 years) |
| Modular EDI Skids for Edge-Cloud Micro-Data-Centers | +1.2% | APAC core, North America, spill-over to MEA | Short term (≤ 2 years) |
| PFAS Discharge Limits Favoring Chemical-Free Polishing | +1.0% | North America, early adoption in EU | Short term (≤ 2 years) |
| Direct-Lithium-Extraction (DLE) Plants Requiring Ultra-Low-Conductivity Water | +0.9% | South America (Chile, Argentina), expanding to North America | Long term (≥ 4 years) |
| Source: Mordor Intelligence | |||
Green-Hydrogen Electrolyzer Demand for Ultrapure Water
Global electrolyzer rollouts mandate feedwater below 0.1 µS/cm, a band that only EDI can hold after RO polish. Germany set a 10 GW domestic target under its National Hydrogen Strategy, matching the United States Hydrogen Shot cost goal of USD 1/kg, and each MW of capacity needs roughly 1–1.5 m³/h of ultrapure water[1]Federal Ministry for Economic Affairs and Climate Action, Germany, “National Hydrogen Strategy,” bmwk.de. Ørsted and bp began pairing offshore wind with coastal hydrogen hubs in 2025, hard-wiring seawater desalination plus EDI into every gigawatt module. The IEA sees global electrolyzer nameplate exceeding 90 GW by 2030, a five-fold rise from 2024 that multiplies demand for compact electrodeionization stacks[2]International Energy Agency, “Hydrogen Projects Database,” iea.org . With RO-EDI trains able to run chemical-free, developers cut logistics at remote renewables sites, lowering OPEX and permitting hurdles across the electrodeionization technology market.
Continuous Bioprocessing in Cell and Gene-Therapy Plants
The U.S. FDA endorsed continuous manufacturing for biologics in 2024, pushing drug makers toward single-use reactors that cannot tolerate regeneration acids or bases. Sartorius trials showed EDI-prepared buffers trimming total cycle times by 30% and reducing hold-step variability for CAR-T batches. Novo Nordisk and Eli Lilly enlarged fill-finish space in 2025 to meet surging GLP-1 demand, installing on-demand water-for-injection loops polished with EDI skids. As patient-specific therapies scale, every hour saved matters, making chemical-free EDI a default in new biologics suites. This shift funnels steady orders into the electrodeionization technology market through 2031.
Modular EDI Skids for Edge-Cloud Data Centers
Edge nodes from 500 kW to 2 MW IT load lack space or permits for acid/caustic regeneration. Equinix mapped 50 new Asia-Pacific metro sites in 2025 that each need make-up water under 10 µS/cm, a target that compact EDI skids hit without chemicals. Microsoft’s Azure for Operators rolls 5G cores into telecom towers where water quality swings daily, again favoring self-contained RO-EDI trains. IEC 62040 now references water parameters for immersion cooling, so system integrators specify EDI to avoid corrosion in backup power circuits. As real-time analytics and VR drive lower latency, every new pod widens the electrodeionization technology market.
PFAS Discharge Limits Favour Chemical-Free Polishing
The U.S. EPA set maximum 4 ppt thresholds for PFOA and PFOS in drinking water during 2024 compliance rounds, pushing industrial dischargers to drop resin waste that can leach trace PFAS. The EU amendment to its Drinking Water Directive caps the sum of 20 PFAS species at 0.5 µg/L, stricter than the U.S. rule. 3M exited PFAS foams in 2024 and pivoted toward fluorine-free chemistries, signalling market realignment. Chemours has invested USD 200 million to run closed-loop EDI polishing at its Fayetteville site to meet consent decree discharge terms. This regulatory drumbeat scales opportunities across the electrodeionization technology market.
Restraints Impact Analysis*
| Restraints | (~) % Impact on CAGR Forecast | Geographic Relevance | Impact Timeline |
|---|---|---|---|
| Supply-Chain Risk for Fluoropolymer IEM Precursors | -0.4% | Global, acute in Asia-Pacific manufacturing hubs | Short term (≤ 2 years) |
| Skilled-Labor Shortage for High-Pressure EDI Commissioning | -0.3% | North America, Europe, emerging in APAC | Medium term (2-4 years) |
| Upfront CAPEX Barrier for SMEs in Emerging Economies | -0.3% | South America, Middle East and Africa, Southeast Asia | Long term (≥ 4 years) |
| Source: Mordor Intelligence | |||
Supply-Chain Risk for Fluoropolymer IEM Precursors
Chinese and EU crackdowns on PFAS production pushed Chemours and Solvay's lead times for membrane-grade resins from 12 to 20 weeks in early 2025. DuPont’s 2024 filings note 8% cost inflation on Nafion inputs, costs that cascade to EDI assemblers. The European Chemicals Agency also weighs broad PFAS restrictions with only narrow carve-outs, making long-range supply contracts risky. While firms trial non-fluorinated polymers, chemical stability lags under EDI voltage swings, leaving upstream volatility a short-term brake on the electrodeionization technology market.
Skilled-Labor Shortage for High-Pressure Commissioning
AWWA data show 30% of U.S. water operators hit retirement age by 2029, while trade-school enrollment fell 15% since 2020. Veolia poured EUR 45 million into digital training but still reports 15-20% schedule slips for large-scale start-ups. Xylem partnered with WEF in 2025 to certify just 500 EDI technicians per year, well below semiconductor and green-hydrogen project needs. Premium wages raise installed cost, delaying buys from mid-tier users and trimming growth in the electrodeionization technology market.
*Our forecasts treat driver/restraint impacts as directional, not additive. The impact forecasts reflect baseline growth, mix effects, and variable interactions.
Segment Analysis
By Application: Power Generation Anchors While Pharma Accelerates
Power generation accounted for 40.44% of revenue in 2025 as combined-cycle plants and supercritical boilers require feedwater conductivity below 0.2 µS/cm to protect turbines. However, incremental growth slows because gas turbines consume less makeup water than legacy coal. Pharmaceuticals will post the fastest 7.20% CAGR as regulators endorse continuous manufacturing and the United States Pharmacopeia chapter 643 fixes resistivity above 1 MΩ-cm. Biologics suites adopting single-use bioreactors install compact EDI trains that deliver water-for-injection on demand without chemical regenerants, expanding the electrodeionization technology market across high-margin life-science nodes.
Electronics and semiconductors trail next, driven by Taiwan Semiconductor Manufacturing Company fabs hitting 18.2 MΩ-cm purity for 3 nm nodes. Food and beverage demand stays steady where breweries and dairy plants value uptime over 10 µS/cm conductivity ceilings. Lab, aquarium, and cosmetic users form a mid-single-digit block with consistent replacement orders.


By Product Type: Plate-and-Frame Leads, Spiral-Wound Gains
Plate-and-frame modules held 61.97% of the electrodeionization technology market share in 2025. Operators favor their cassette swaps for high-pressure power and pharma loops while the open architecture eases clean-in-place service. Spiral-wound designs, however, will clock a 6.88% CAGR to 2031 as edge data-center builders demand sub-2 m skid envelopes and food processors chase lower CAPEX. Latest winding machines shrink spacer gaps, lifting current efficiency by near 10% and improving the electrodeionization technology market economics in light-industrial lines.
Hybrid designs combining cassette serviceability with spiral density, launched by DuPont in 2024, target the 5-10 m³/h sweet spot. As hyperscale players bundle tens of micro-pods per metro zone, footprint pressure mounts, handing share to tight-coil elements. Nonetheless, plate-and-frame will remain the default above 10 m³/h where downtime and membrane cost trump space, anchoring over half the electrodeionization technology market through the forecast period.
Geography Analysis
Asia-Pacific booked 41.69% of 2025 revenue, underpinned by 18 new Chinese fabs, India’s USD 10 billion Production-Linked Incentives, and wave after wave of Singapore and Mumbai hyperscale builds. Taiwan Semiconductor’s 20 nm lines consumed 63,000 tons/day of ultrapure water in 2024, each liter polished by EDI, while Samsung’s Pyeongtaek plant recycles close to 90% of process water. Japan’s USD 6.8 billion subsidy for advanced packaging funnels orders toward Kumamoto and Hokkaido nodes, adding another lift. China’s 90% reuse mandate for electronics and chemical sites by 2030 embeds RO-EDI trains deep into coastal industrial parks, securing long-term demand across the electrodeionization technology market.
The North American market is driven by DOE Hydrogen Shot electrolyzer rollouts and semiconductor reinvestment. Intel’s Arizona Fab 42 pushes 30,000 L/min through EDI loops. Eli Lilly’s USD 2.1 billion Indiana campus couples single-use reactors with on-site electrodeionization skids. EPA’s 4 ppt PFAS limit guides industrial dischargers to chemical-free polishing, strengthening aftermarket demand across the electrodeionization technology market.
Europe rides the REPowerEU target of 10 Mt green hydrogen by 2030. Gigawatt projects in Germany, the Netherlands, and Spain each need 1–1.5 m³/h of ultrapure water per MW, fixing electrodeionization into every process line. South America and Middle East and Africa remain low-double-digit today, but Chilean and Argentinian DLE plants plus Saudi Arabia’s 4 GW NEOM electrolyzer site will bolt on hundreds of cubic meters per hour of RO-EDI trains by 2028. Power-grid reliability and skilled-labor gaps restrain broader uptake, yet once-through water bans in mining and petrochemicals tip more projects toward closed-loop electrodeionization technology market solutions.


Value Chain Analysis
The EDI value chain starts with upstream specialty inputs, including ion-exchange membranes (often fluoropolymer-based), ion-exchange resins, electrodes, spacers/gaskets, housings, and DC power supplies/controls. Membrane-grade polymer chemistry and precision coating remain the most constrained points, with long lead times and limited qualified suppliers concentrated across the United States, Germany, Japan, and China. This structure increases exposure to PFAS-related chemistry constraints and feedstock volatility.
Midstream, OEMs and system integrators combine EDI stacks with pretreatment (typically RO), pumps, instrumentation, and automation into skid or containerized packages, then qualify performance against end-user specifications in power, pharmaceuticals, and semiconductors. Downstream channels include EPCs, industrial water service firms, and direct sales to large accounts, with recurring aftermarket revenue from membrane/stack replacement, commissioning, and remote monitoring. Product direction toward pre-engineered, high-flow modular assemblies, such as QUA's June 2026 FEDI GIGA Q-Connect, shifts value creation from field fabrication to factory assembly. That in turn raises requirements for standardized headers, controls integration, and service readiness.
Competitive Landscape
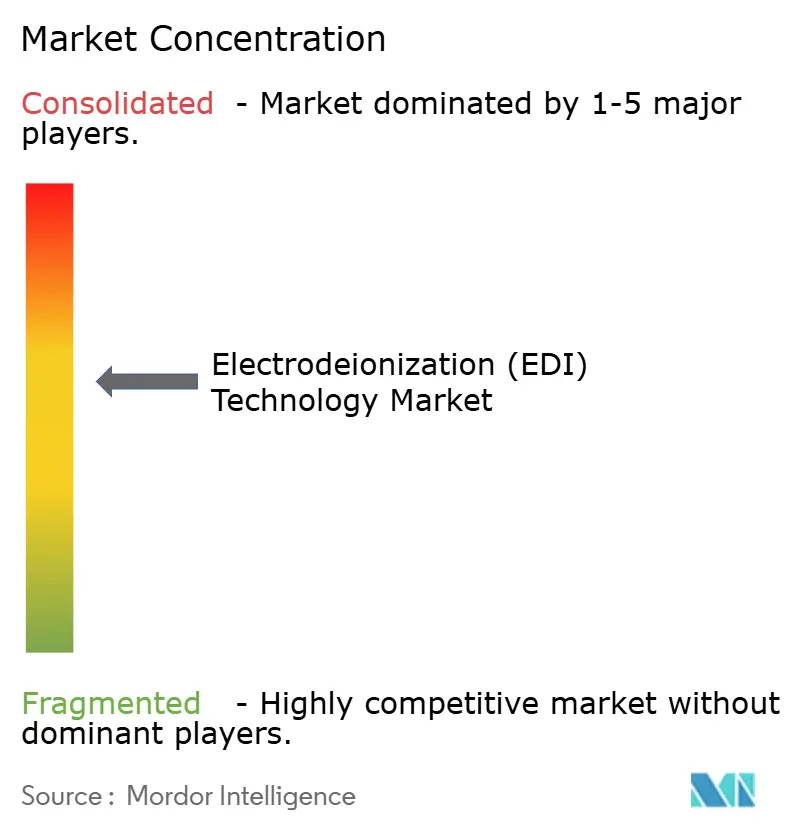
The electrodeionization technology market stays moderately consolidated. Xylem’s USD 7.5 billion Evoqua integration created a USD 7 billion water platform able to cross-sell EDI into Evoqua’s RO base. Veolia absorbed Suez in 2023, streamlining European offerings and bundling design-build-operate deals for pharma and chip fabs. DuPont rides vertical integration across Nafion ion-exchange and FilmTec RO to win semiconductor specs that favor single-vendor compatibility.
White-space openings bloom in edge data centers, DLE mining, and biologics suites. SnowPure’s cloud-linked controller trims EDI energy by 12% using machine-learning dispatch, an edge for cost-sensitive labs. Patent activity in 2025 shows hybrid electrodialysis-EDI stacks tolerating 5,000 mg/L TDS feeds, priming the electrodeionization technology market for brackish reuse. IEC-62040 water references hardwire EDI into UPS-cooled racks, spurring skid makers to pre-wire remote monitoring.
Regional independents still clinch niche wins. Aquatech sells zero-liquid-discharge EDI trains in U.S. shale plays. Mega secures laboratory contracts across central Europe. Lenntech targets brewery and dairy runs in Benelux. As digital twins and predictive analytics mature, service differentiation rather than hardware may decide margin spreads across the electrodeionization technology market.
Electrodeionization (EDI) Technology Industry Leaders
Veolia
DuPont
Xylem
Newterra
Lenntech B.V.
- *Disclaimer: Major Players sorted in no particular order

Market Opportunities and Future Outlook
Opportunities are expanding where end users need chemical-free ultrapure polishing with smaller footprints and faster deployment. High-flow, pre-engineered modular EDI packages open whitespace in boiler-feed and large industrial ultrapure water retrofits by reducing on-site piping complexity and commissioning time; the June 2026 launch of QUA's FEDI GIGA Q-Connect illustrates how vendors are productizing multi-stack assemblies for higher flow rates. In pharmaceuticals, purpose-built EDI configurations that support hot-water sanitization align with water-for-injection and buffer-prep loops in continuous manufacturing suites, reducing reliance on regeneration chemicals and minimizing resin changeout downtime.
Technology roadmaps also create differentiation in contaminant control, particularly CO2, silica, and boron, which matter for semiconductor and advanced process loads. Published 2026 work on redesigning EDI module structures to suppress CO2 diffusion, alongside QUA's 2026 commercialization messaging around CO2 suppression, points to an active effort to improve product-water purity without adding chemical steps. In parallel, industrial deployments that combine RO with electrically regenerated deionization formats provide a bridging route for sites upgrading ultrapure capacity without fully re-architecting water systems, as shown by Envirogen putting an Eco MultiPro RO-CDI system into operation at a Kemira facility in Bradford to supply 25 m3/h of ultrapure water.
Recent Industry Developments
- June 2026: QUA launched the FEDI GIGA Q-Connect, a pre-engineered, skid-mounted modular EDI solution for high-flow ultrapure water and boiler feed applications. The rack-based architecture uses simplified three-header connections (feed, permeate, reject), supporting faster installation and repeatable integration into RO-EDI trains for industrial projects.
- May 2025: Veolia announced USD 750 million of new flagship contracts in its water technologies activity, including deliveries tied to energy and semiconductor projects across Brazil, the United States, and the United Arab Emirates. Equipment deliveries scheduled to begin mid-2026 indicate a strong near-term pipeline for membrane-based ultrapure and process-water systems where EDI is commonly specified as the polishing step.
- August 2024: DuPont expanded its EDI product positioning in the 5 to 10 m3/h range through hybrid designs that combine cassette serviceability with higher packing density, targeting space-constrained industrial ultrapure water skids. The change supported integrators that prefer single-vendor compatibility across FilmTec RO and ion-exchange-based polishing components for critical applications such as semiconductors and life sciences.


Research Methodology Framework and Report Scope
Market Definition and Coverage
This market covers revenues earned from electrodeionization (EDI) modules and systems used to produce deionized and ultrapure water by removing dissolved ions through an electric field, ion exchange resins, and membranes, typically as a polishing step after pre-treatment like reverse osmosis.
Scope exclusions: This sizing does not count upstream water-treatment chemicals, standard RO-only skids, consumable resins sold for non-EDI deionization, or broader plant engineering services unless bundled with an EDI system sale.
Segmentation Overview
- By Application
- Power Generation (Power Plants)
- Electronics and Semiconductors
- Food and Beverage
- Pharmaceuticals
- Other Applications
- By Product Type
- Plate-and-frame Module
- Spiral Wound Module
- By Geography
- Asia-Pacific
- China
- India
- Japan
- South Korea
- Rest of Asia-Pacific
- North America
- United States
- Canada
- Mexico
- Europe
- Germany
- United Kingdom
- France
- Italy
- Rest of Europe
- South America
- Brazil
- Argentina
- Rest of South America
- Middle East and Africa
- Saudi Arabia
- South Africa
- Rest of Middle East and Africa
- Asia-Pacific
Data Sources, Market Sizing, and Validation
Desk Research
Desk work started with building a clear view of where EDI is used and how demand behaves across industries that need high-purity water. Public sources were used to anchor the demand signals, such as USGS water-use publications, EPA and state-level discharge guidance updates, International Energy Agency releases on hydrogen and power, semiconductor industry statistics shared by associations, and peer-reviewed papers on ultrapure water and ion removal performance.
We also reviewed company annual reports, investor decks, product catalogs, and press releases to map typical system configurations and how pricing moves with flow rate and resistivity requirements. Trade data and import-export shipment-level databases were used selectively to sanity-check cross-border equipment movement where shipment descriptions were clear enough for EDI-related skids. The desk sources listed here are illustrative, and other public and paid references were used to collect inputs, validate assumptions, and clarify gaps.
Primary Interviews and Surveys
Primary work focused on conversations with EDI system integrators, module suppliers, EPC-linked water teams, and end users in power, electronics, and pharmaceuticals, so the model reflects real purchasing patterns and replacement cycles. We used these discussions to check how often EDI is specified versus mixed-bed polishing, what pre-treatment is typically required, and how project timelines affect recognized revenues across APAC, EMEA, and the Americas.
Distribution of primary research fieldwork respondents
| Company type | Respondent position | Region |
|---|---|---|
| Top tier: 35% | CXOs: 12% | APAC: 53% |
| Mid tier: 49% | Functional/Unit leaders: 42% | EMEA: 29% |
| Smaller Players: 16% | Managers: 46% | Americas: 18% |
Market-Sizing & Forecasting
Sizing was built using a top-down approach where industry demand pools were reconstructed from installed capacity additions and operating needs in key end uses that consistently buy high-purity water systems. For each application, we translated the addressable sites and expansions into EDI system demand using practical inputs like typical flow-rate bands, conductivity targets for ultrapure water, the share of RO-plus-EDI architecture in new builds, and the ratio of new projects versus retrofit and replacement.
Those totals were then checked with bottom-up approximations, including sampled price-per-capacity ranges for packaged skids, channel checks on lead times, and a light roll-up of supplier and integrator revenue visibility by region. When vendor reporting was incomplete, gaps were handled by using proxy shipment signals and interview-based share splits, then stress-tested against the application mix.
For the forecast, we used scenario analysis because adoption tracks a few demand drivers that shift differently by year. Inputs that mattered most included semiconductor fab announcements, power and boiler makeup upgrades, pharmaceutical capacity additions, and tightening discharge and purity requirements that can move buyers toward chemical-free continuous polishing. Assumptions were revisited until the forecast path matched what practitioners said is feasible in pricing, project cadence, and specification trends.
Data Validation & Update Cycle
Validation was done by comparing model outputs against independent signals, such as regional capex cycles in water-intensive industries, reported order momentum narratives, and trade flows where classification was reliable. Outliers were flagged, and the drivers behind variance were reviewed before a final set of numbers was confirmed through multi-step internal checks.
The dataset is refreshed annually so the sizing reflects the latest project pipeline, pricing movement, and application mix shifts. If a material event occurs, such as a major capacity expansion wave, a regulatory change that accelerates adoption, or an unusual pricing move, we re-contact sources and adjust the assumptions. Before delivery, a final pass is completed so clients receive the most current view available.
Mordor Intelligence's Electrodeionization Technology Market Size Versus Other Published Estimates
It is normal to see different market sizes for EDI technology, even when studies reference the same end uses. The gaps usually come from how each study treats what is counted as EDI revenue, which year is treated as the starting point, and how aggressively adoption is assumed to rise in industries like semiconductors and power.
The biggest differences in this market often come from scope and timing choices, where some estimates fold broader water-treatment system revenues into EDI or use earlier base years and then apply faster growth assumptions. The table shows that counting only EDI modules and related systems, and keeping application demand tied to purity targets and RO-plus-EDI project configurations, explains why the 2026 value lands where it does in Mordor Intelligence.
Benchmark comparison
| Source | Market Size | Gaps in Research Methodology |
|---|---|---|
| Mordor Intelligence | USD 0.95 B (2026) | |
| Global Consultancy A | USD 1.18 B (2024) | Uses a different base year and appears to treat the market more broadly, which can pull in adjacent deionization and system revenues beyond EDI-specific modules and skids. |
| Industry Research Group B | USD 1.09 B (2023) | Anchors sizing on an earlier year and likely applies higher penetration assumptions across end uses, which can inflate totals if retrofit timing and replacement cycles are not constrained. |
Overall, the spread is mainly explained by what is included as EDI revenue and how adoption is phased by application, not by a disagreement that demand is growing. By tying the total to clear application drivers and practical configuration rules, the estimate stays easier to replicate and update when project pipelines or purity requirements change.


Key Questions Answered in the Report
How large is the electrodeionization technology market in 2026?
It stands at USD 0.95 billion and is projected to reach USD 1.32 billion by 2031, advancing at a 6.77% CAGR.
Which application segment is expanding the quickest?
Pharmaceuticals are forecast to grow at a 7.20% CAGR through 2031 as continuous bioprocessing drives demand for ultrapure water.
Why are green-hydrogen projects choosing EDI systems?
Proton-exchange-membrane electrolyzers need feedwater below 0.1 µS/cm, and EDI achieves that purity without chemical regenerants.
Which EDI product configuration is set to gain share?
Spiral-wound modules will register a 6.88% CAGR to 2031 because space-constrained data centers prefer their higher packing density.
How concentrated is the supplier landscape?
The five largest vendors control just under 50% of revenue, giving the field a moderate concentration score of 6.
What growth outlook does Asia-Pacific hold?
Asia-Pacific is expected to post an 8.05% CAGR to 2031 on rising semiconductor fabs, data-center builds, and electronics incentives.
Page last updated on:






