
Electrically Conductive Adhesives Market Size and Share
Market Overview
| Study Period | 2020 - 2031 |
|---|---|
| Market Size (2026) | USD 2.94 Billion |
| Market Size (2031) | USD 3.88 Billion |
| Growth Rate (2026 - 2031) | 5.72 % |
| Fastest Growing Market | Asia Pacific |
| Largest Market | Asia-Pacific |
| Market Concentration | Medium |
Major Players *Disclaimer: Major Players sorted in no particular order Image © Mordor Intelligence. Reuse requires attribution under CC BY 4.0. | |
Electrically Conductive Adhesives Market Analysis by Mordor Intelligence
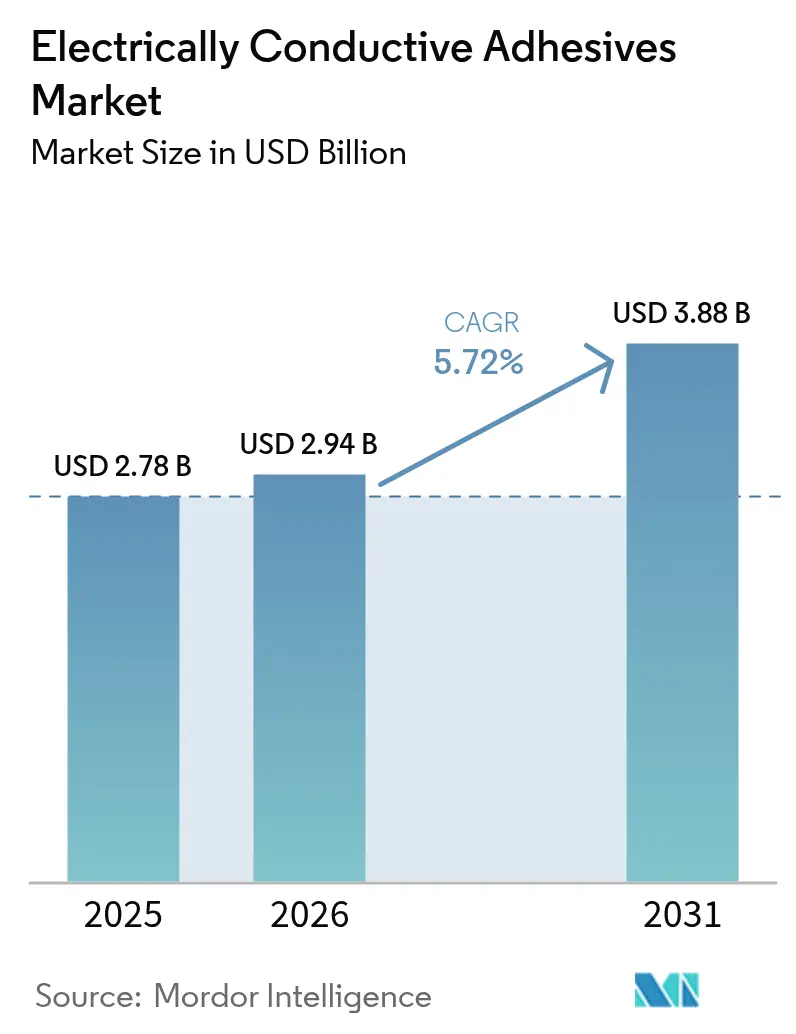
The Electrically Conductive Adhesives Market size was valued at USD 2.78 billion in 2025 and estimated to grow from USD 2.94 billion in 2026 to reach USD 3.88 billion by 2031, at a CAGR of 5.72% during the forecast period (2026-2031). The sector’s growth hinges on the electronics industry’s transition to lead-free, low-temperature interconnection methods that safeguard ever-smaller components from thermal damage while complying with global environmental directives. Demand accelerates as power-dense semiconductor devices, high-frequency modules, and battery-centric electric vehicles outstrip the performance window of traditional tin-lead solders, opening a broad runway for epoxy, silicone, and hybrid chemistries that bond, conduct, and dissipate heat in a single step. Silver-filled isotropic grades dominate standard printed circuit assembly, yet anisotropic, carbon-reinforced and graphene-enhanced variants are scaling quickly where ultra-fine pitches, weight constraints and flex cycles dictate directional conductivity and mechanical damping. Regionally, the electrically conductive adhesives market gains most momentum in East Asia where policy-backed semiconductor foundries, photovoltaic gigafactories and accelerating EV adoption anchor the value chain. Parallel growth avenues emerge in aerospace, defense and bio-electronics, where extreme temperature swings, radiation exposure, and biocompatibility demands call for purpose-engineered formulations that pass stringent qualification standards.
Key Report Takeaways
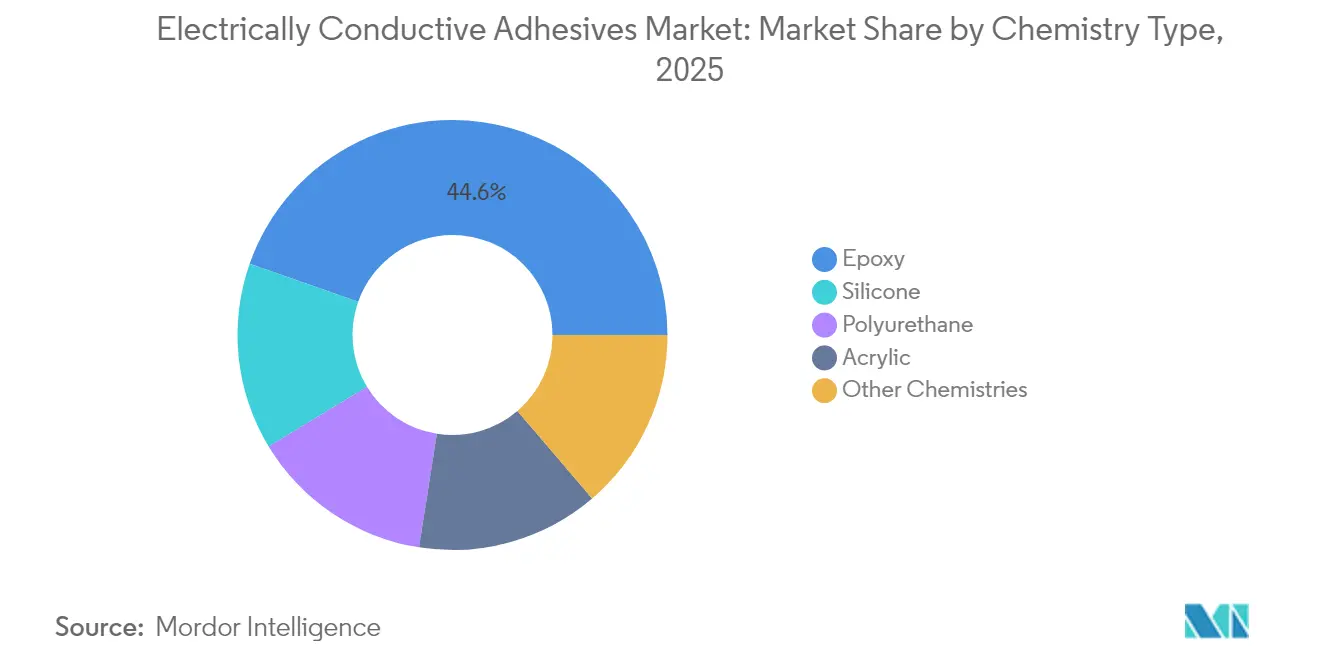
- By chemistry type, epoxy formulations led with 44.62% of the electrically conductive adhesives market share in 2025, while silicone-based systems record the fastest 6.42% CAGR to 2031.
- By type, isotropic grades commanded 66.72% share of the electrically conductive adhesives market size in 2025; anisotropic variants are projected to grow at a 6.78% CAGR through 2031.
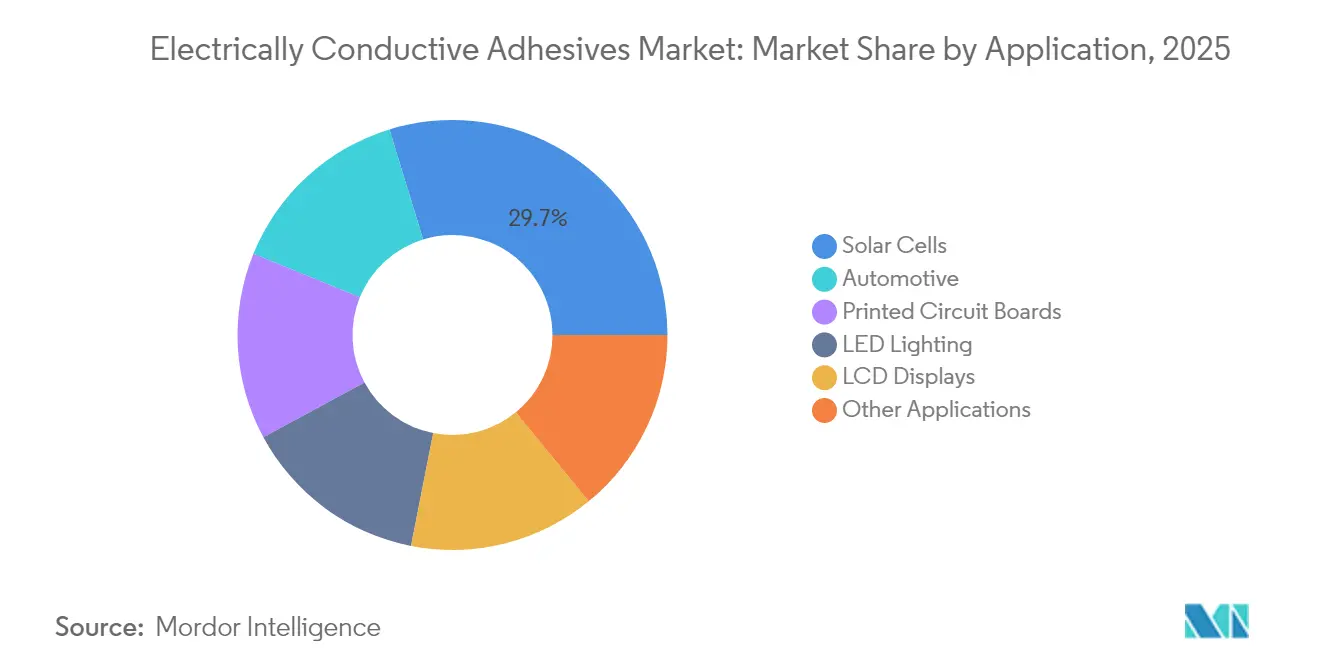
- By application, solar cells and photovoltaic modules captured 29.74% of the electrically conductive adhesives market size in 2025, whereas the “Other Applications” cluster—medical implants, aerospace electronics, and energy storage—expands at a 6.85% CAGR to 2031.
- By geography, Asia-Pacific accounted for 54.83% revenue share in 2025, and the region is forecast to surge at a 6.31% CAGR to 2031.
Note: Market size and forecast figures in this report are generated using Mordor Intelligence’s proprietary estimation framework, updated with the latest available data and insights as of 2026.
Market Trends and Insights
Drivers Impact Analysis of Electrically Conductive Adhesives Market*
| Driver | (~) % Impact on CAGR Forecast | Geographic Relevance | Impact Timeline |
|---|---|---|---|
| Increasing application in power electronics | +1.20% | Global, with concentration in Asia-Pacific and North America | Medium term (2-4 years) |
| Increasing utilization in electric vehicles | +1.50% | Global, led by China, EU, and North America | Long term (≥ 4 years) |
| Incraesing usage in aerospace and defense applications | +0.80% | North America, Europe, with emerging demand in Asia-Pacific | Long term (≥ 4 years) |
| Growing demand from renewable energy systems | +1.10% | Global, with strong growth in Asia-Pacific and Europe | Medium term (2-4 years) |
| Bio-compatible conductive bio-adhesives for implants | +0.40% | North America and Europe primarily | Long term (≥ 4 years) |
| Source: Mordor Intelligence | |||
Increasing Application in Power Electronics
Next-generation power converters incorporating silicon-carbide and gallium-nitride devices run at junction temperatures above 200 °C, a regime that invalidates tin-lead and low-silver solders. Epoxy and silicone adhesives filled with high-purity silver, silver-coated copper, or hybrid graphene networks maintain conductivity under high current densities while buffering thermal shock, enabling miniaturized power modules that deliver higher switching frequencies with lower parasitics. The formulations also double as thermal interface materials, reducing junction-to-case resistance in traction inverters. Material scientists are dispersing carbon-nanotube strands in three-dimensional architectures to unlock parallel electrical and thermal pathways, pushing the electrically conductive adhesives market to the forefront of wide-bandgap power design.
Increasing Utilization in Electric Vehicles
Cell-to-pack battery strategies eliminate module housings, transferring load-bearing and thermal duties to the adhesive layer. Conductive epoxies with shear strengths above 20 MPa withstand vibration and crash pulses while equalizing current across 3,000-plus cylindrical or prismatic cells per pack. Hybrid systems that marry metallic fillers with ceramic spheres form a compliant lattice that absorbs differential expansion between aluminum busbars and copper tabs, extending service life over thousands of high-rate charge-discharge cycles. The 48-V architecture adopted for auxiliary electrification in light vehicles introduces dense power distribution boards where fine-pitch anisotropic joints prevent short circuits, adding fresh volume to the electrically conductive adhesives market.
Growing Demand from Renewable Energy Systems
Shingled and heterojunction photovoltaic cells rely exclusively on conductive adhesives to bridge ultra-thin busbars, boosting active area and raising module power by 5.1% compared with soldered ribbon designs[1]. Low-temperature curing protects passivated contacts and perovskite layers, preserving 25-year field reliability. In wind energy, blade-integrated lightning diverter grids fabricated with carbon-nanotube-rich pastes route strike currents without galvanic corrosion, and the same circuitry doubles as a structural health monitoring network. These cross-functional roles intensify demand, enlarging the electrically conductive adhesives market beyond pure electronics assembly.
Bio-Compatible Conductive Bio-Adhesives for Implants
Flexible neural probes and cardiac telemetry patches require bonds that conduct micro-ampere signals yet remain cytocompatible. Hydrogel-based systems loaded with PEDOT: PSS and silver nanowires achieve sub-5 kΩ contact resistance while passing ISO 10993 cytotoxicity tests[2]. Tissue-mimicking modulus prevents foreign-body inflammation, enabling decade-long implantation horizons. Although volumes are modest, profit margins exceed commodity consumer-electronics grades, adding a premium tier to the electrically conductive adhesives market.
Restraints Impact Analysis of Electrically Conductive Adhesives Market*
| Restraint | (~) % Impact on CAGR Forecast | Geographic Relevance | Impact Timeline |
|---|---|---|---|
| Silver-filler price volatility | -0.90% | Global, with higher impact in cost-sensitive applications | Short term (≤ 2 years) |
| Reliability limits under high current & thermal cycling | -0.70% | Global, particularly affecting automotive and industrial applications | Medium term (2-4 years) |
| Longer curing times and process complexity | -0.50% | Global, with higher impact in high-volume manufacturing | Short term (≤ 2 years) |
| Source: Mordor Intelligence | |||
Silver-Filler Price Volatility
Silver powders account for 60-80 wt% of typical isotropic adhesives, exposing formulators to bullion swings that can exceed 25% within a quarter. While copper, nickel, and carbon nanotubes promise cost relief, oxidation, diffusion, and percolation thresholds curb their ability to fully replace silver. Hybrid particle architectures that coat copper cores with 300-nm silver shells cut precious-metal content by 30-40% without compromising bulk conductivity, yet the supply chain remains vulnerable to geopolitical mining disruptions. Price pass-through mechanisms are standard in aerospace and medical contracts, but consumer electronics OEMs resist surcharges, trimming near-term expansion of the electrically conductive adhesives market.
Reliability Limits Under High Current & Thermal Cycling
Polymer matrices expand 30-80 ppm /°C against 16-18 ppm /°C for copper substrates, generating shear stress that triggers micro-voids at the filler-matrix interface. Elevated current densities create localized Joule heating; combined thermal-mechanical fatigue can raise joint resistance by 50% after 1,000 h at 85 °C/85% RH. Formulators introduce core-shell rubber particles and silane coupling agents to toughen interfaces, yet an inescapable trade-off remains: softer matrices relieve stress but reduce filler loading, increasing bulk resistivity. These reliability constraints temper electrified powertrain applications and influence the electrified conductive adhesives market adoption curve.
*Our forecasts treat driver/restraint impacts as directional, not additive. The impact forecasts reflect baseline growth, mix effects, and variable interactions.
Electrically Conductive Adhesives Market Segment Analysis
By Chemistry Type:
Epoxy Dominance Faces Silicone ChallengeEpoxy-based grades comprised 44.62% of the electrically conductive adhesives market in 2025 and remain a mainstay where high lap-shear strength and easy dispensing outweigh flexibility concerns. Formulators exploit bisphenol-A, bisphenol-F and novolac backbones to tailor viscosity, glass-transition temperature and modulus, covering everything from rigid board attach to die-attach in power modules. The electrically conductive adhesives market size for epoxy chemistries is projected to grow steadily even as competition intensifies. Their state-of-cure can be accelerated with latent imidazole catalysts, trimming oven time without compromising shelf life. For high-temperature silicon-carbide devices, imide-modified epoxies withstand 200 °C junction environments while keeping thermal cycling stability within 5% resistance drift over 2,000 cycles. On the environmental front, halogen-free formulations satisfy RoHS directives and end-of-life recycling mandates.
Silicone-based systems, recording a 6.42% CAGR to 2031, are closing the market-share gap by delivering elongation over 70% and sustained conductivity after 1,000 salt-spray hours—attributes prized in under-hood automotive controls and offshore wind converters. Polydimethylsiloxane networks absorb shock loads and seal against moisture ingress, addressing failure modes that epoxy cannot. Room-temperature-vulcanizing silicones with platinum catalysts reduce thermal stress on sensitive lens assemblies in LED lighting. Hybrid epoxy-silicone chemistries combine a rigid inner phase for bondline integrity with a compliant outer domain that relieves CTE mismatch. Such synergies reveal how the electrically conductive adhesives market evolves through compositional innovation rather than one-chemistry-wins-all convergence.

By Type:
Isotropic Leadership Challenged by Anisotropic InnovationIsotropic grades commanded 66.72% share of the electrically conductive adhesives market size in 2025, favored for their straightforward process windows and ability to replace reflow solder on through-hole and surface-mount joints. Standard systems maintain volume resistivity under 1 × 10⁻³ Ω·cm using silver flakes optimized for aspect ratio and oxide content. Dispense-and-cure simplicity captures design wins across smartphones, wearables, and consumer appliances where component counts exceed one thousand per board. Yet the omnidirectional conductive network poses a risk of shorts on sub-200 µm pad spacing unless dams or underfills are added, escalating process complexity and cost.
Anisotropic formulations address that pain point with particle designs that conduct solely in the Z-axis. Nickel-plated polymer spheres embedded at 10–15 vol% create vertical percolation paths when compressed, while remaining isolated laterally. In flexible OLED displays, pitch requirements of 40 µm render traditional solders unusable, propelling a 6.78% CAGR for anisotropic adhesives through 2031. High-frequency telecommunications modules employ anisotropic materials to bond flip-chip GaAs dies onto alumina carriers, maintaining 50 Ω impedance without ground-plane coupling. Dual-phase systems that embed anisotropic micro-spheres in an isotropic matrix deliver hybrid benefits, highlighting how the electrically conductive adhesives market reframes the binary type classification into a continuum.
By Application:
Solar Dominance Amid DiversificationSolar photovoltaics absorbed 29.74% of market revenue in 2025, driven by giga-factory scale-up and design shifts to ribbon-free shingled architectures. Conductive adhesives eliminate hot-bar soldering steps, trimming cell breakage rates below 0.1% and raising throughput in heterojunction lines. The electrically conductive adhesives market share from solar will stay dominant but edge downward as other segments scale faster. Automotive battery packs trail close behind, capitalizing on conductive epoxies that double as structural fillers to bolster torsional rigidity in skateboard platforms. Printed circuit boards, LED dies and display driver interconnects form a mature demand core, stabilizing volume even as unit prices trend downward.
The “Other Applications” basket—medical implants, aerospace telemetry and energy storage sensors—registers the highest 6.85% CAGR. Biocompatible grades bring USD 2,000–3,000 per kg price points, cushioning margin compression elsewhere. In grid-scale battery racks, adhesives serve as current collectors and thermal spreaders, improving cell uniformity and state-of-health algorithms. Aerospace growth hinges on conductive films that attach radar-absorbing metamaterials to composite fuselages without galvanic mismatch. Each niche may represent a small sliver today, yet collectively they reinforce the electrically conductive adhesives market as a platform technology underpinning converging electronics-mechanical systems.
Geography Analysis
APAC Electrically Conductive Adhesives Market
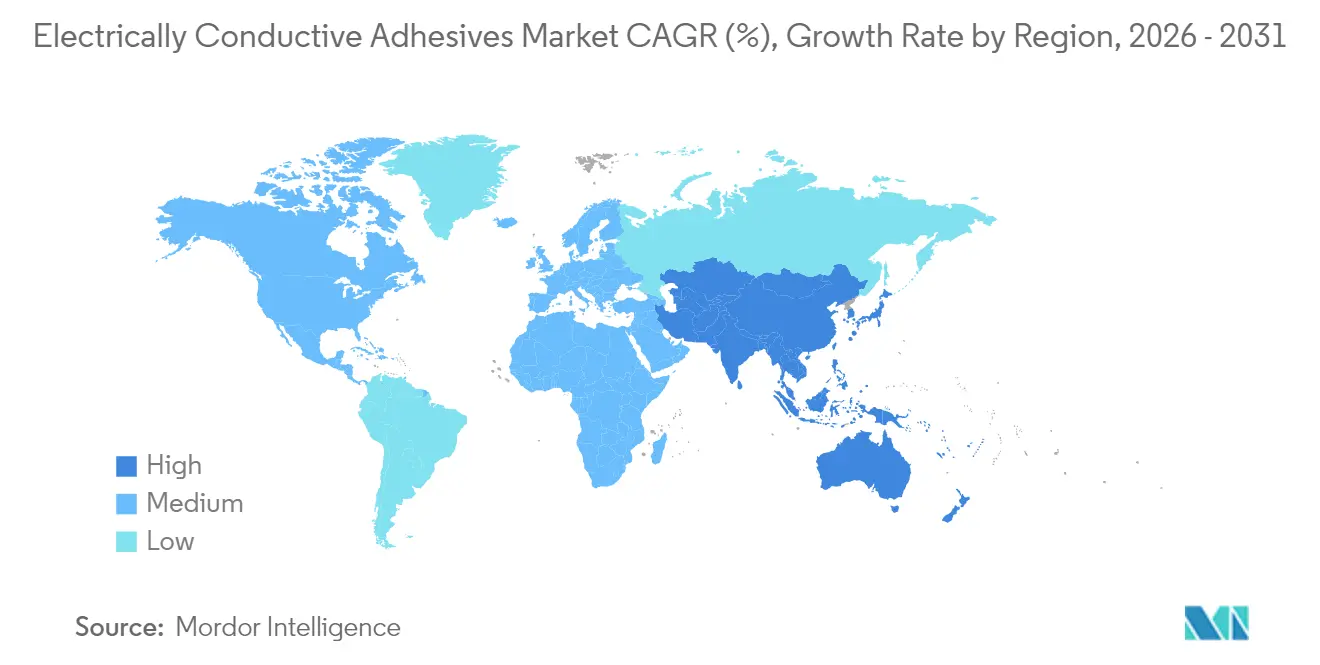
Asia-Pacific retained 54.83% of 2025 revenue and continues as both volume and value leader due to semiconductor powerhouse ecosystems in China, South Korea and Taiwan. Local policy mandates for new-energy vehicles and photovoltaic rollouts funnel sustained demand, translating to a 6.31% CAGR for the electrically conductive adhesives market across the region. National subsidy programs for domestic electric passenger cars anchor long-term offtake contracts with major adhesive suppliers, reducing currency-exchange risk and ensuring steady plant utilization. Start-up clusters in Shenzhen, Suzhou, and Bangalore complement entrenched multinationals by launching flexible, wearable, and printed-electronics products, widening the customer base for niche formulations.
North America Electrically Conductive Adhesives Market
North America demonstrates significant consumption, driven by defense avionics, space exploration initiatives, and the reshoring of power-semiconductor fabs. The region’s qualification standards—NASA outgassing, IPC-CC-830C, UL-94V0—elevate entry barriers, allowing suppliers of premium epoxy-silver pastes and thermally conductive films to command healthy gross margins. Recent capital expansions by DELO and Henkel in Texas and Ohio underscore confidence in long-term demand. Government incentives under the CHIPS and Science Act draw advanced-packaging projects that further enlarge the electrically conductive adhesives market footprint.
Europe Electrically Conductive Adhesives Market
Europe maintains a stronghold in automotive, medical and renewable segments. Germany spearheads EV battery pack integration, France and the Nordic nations ramp offshore wind farms, and the Netherlands leads in flexible OLED R&D. These trends converge to sustain steady purchasing volumes despite macroeconomic headwinds. Stringent REACH and RoHS compliance pushes formulators toward halogen-free, lead-free, and solvent-reduced systems, awarding first-mover advantage to innovators capable of aligning performance with sustainability. With corporate average CO₂ targets tightening, OEMs view conductive adhesives as enablers for lighter wiring harnesses and higher-efficiency modules, reinforcing their long-run importance within the electrically conductive adhesives market.
Value Chain Analysis
The value chain begins with upstream conductive fillers and polymer matrices, followed by compounding, qualification, and downstream integration into electronics and energy assemblies. For many isotropic grades, silver flakes are the key input and can account for 60-80% of material costs, so bullion swings and the geographic concentration of silver-flake supply tend to drive cost and availability decisions. Alongside silver, formulators source base resins (epoxy, silicone, polyurethane, acrylic) and additives such as coupling agents, catalysts, and rheology modifiers, then carry out dispersion, surface treatment, and paste formulation to meet application-specific conductivity, dispensability, and cure requirements.
Midstream, leading suppliers including Henkel and Heraeus Electronics differentiate through formulation know-how, application engineering support, and process capabilities tied to customer production lines. Downstream demand is shaped by centralized procurement and specification control in major electronic manufacturing services (EMS) groups such as Foxconn, Jabil, and Pegatron, which can standardize materials across programs and geographies. Automotive, semiconductor, and aerospace end uses also bring long qualification cycles, typically 12 to 24 months, which affects inventory planning and supplier selection more than spot pricing. Compliance requirements, including VOC controls and emerging PFAS restrictions, increase reformulation workload and can lead to portfolio simplification, while regional technical centers and local stocking help suppliers meet lead-time, support, and documentation expectations in Asia-Pacific and North America.
Competitive Landscape
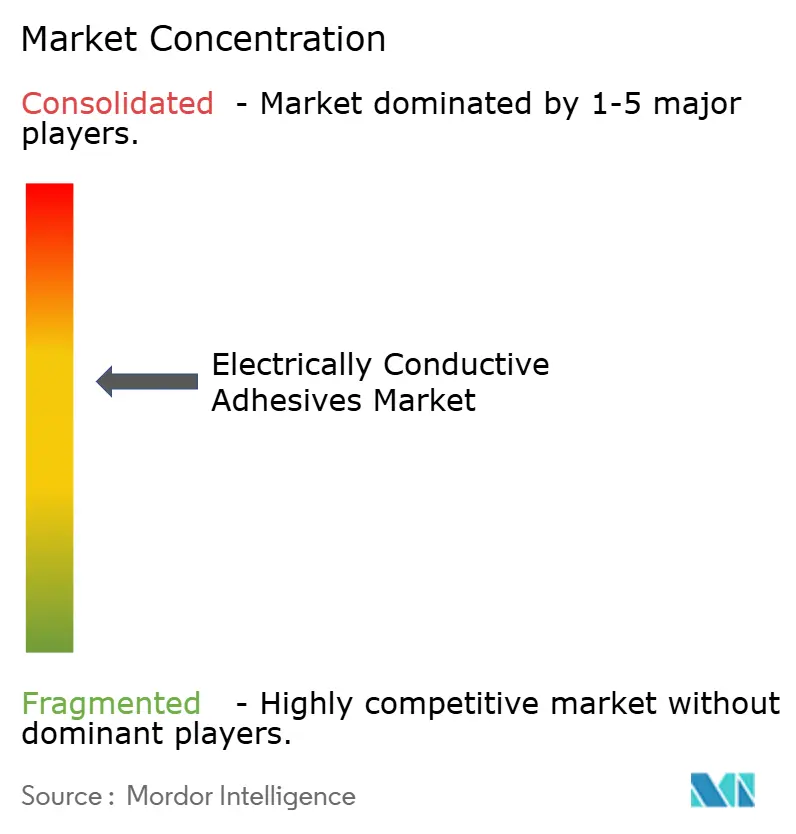
The electrically conductive adhesives market is moderately consolidated: the top five suppliers account for roughly 51% of global sales, leaving ample room for mid-tier specialists and regional champions. Scale economies pivot on silver paste compounding, filler surface treatment, and high-precision dispensing equipment, yet the broad spectrum of application-specific performance envelopes curbs the emergence of a single dominant supplier. Global players such as Henkel, 3M, H.B. Fuller, and Panacol leverage multi-chemistry portfolios, vertical integration into silver-flake production, and global technical-service laboratories to secure design wins in consumer and industrial electronics. Meanwhile, niche innovators concentrate on bio-compatible hydrogels, carbon-nanotube hybrids, or ultra-fast UV cure systems.
Strategic maneuvers revolve around three levers. First, R&D intensity: several leading firms reinvest 10-15% of sales into advanced material programs, racing to co-develop formulations that marry electrical, thermal, structural, and environmental functions in a single bond line. Second, regional proximity: facility expansions in Shanghai, Penang, and Guadalajara position suppliers adjacent to high-volume assembly clusters, reducing lead times and tailoring support to local process windows. Third, sustainability: recycled-silver ink lines introduced in 2025 demonstrate circular-economy credentials and mitigate raw-material volatility. Collectively, these tactics aim to strengthen stickiness with OEMs and stretch competitive moats, steering the long-term direction of the electrically conductive adhesives market.
Competitive pressure varies by vertical. In the price-elastic consumer-electronics arena, commoditized isotropic pastes face annual contract repricing, compelling suppliers to differentiate through dispensability and reworkability rather than pure resistivity numbers. Conversely, aerospace, medical, and defense programs certify a single approved source per platform, locking in multi-decade revenue streams once qualification hurdles are cleared. Custom chemistries that pass cytotoxicity or outgassing tests can earn margins above 35%. Start-ups exploring sintered nano-silver joints or graphene-networked elastomers may up-end incumbent market splits if they scale production and meet reliability proof points, keeping the evolution of the electrically conductive adhesives market fluid and innovation-driven.
Electrically Conductive Adhesives Industry Leaders
-
3M
-
Dow
-
H.B. Fuller Company
-
Henkel AG & Co. KGaA
-
Panacol-Elosol GmbH
- *Disclaimer: Major Players sorted in no particular order
Electrically Conductive Adhesives Market Companies Covered in this Report
- 3M
- Aremco
- Arkema
- Creative Materials
- DELO Industrie Klebstoffe GmbH & Co. KGaA
- Dow
- Dymax
- H.B. Fuller Company
- Henkel AG & Co. KGaA
- Heraeus Electronics
- HITEK Electronic Materials Ltd
- Master Bond Inc.
- MG Chemicals
- Nagase ChemteX America LLC
- Panacol-Elosol GmbH
- Parker Hannifin Corp.
- Permabond
- Protavic International
Read Analysis of Electrically Conductive Adhesives Companies
Market Opportunities and Future Outlook
Opportunities continue to open around interconnect needs that require electrical performance alongside thermal management and mechanical compliance. EV battery architectures, including cell-to-pack and higher-integration designs, raise the value of multi-functional materials that can act as both an adhesive and a heat-flow enabler, and suppliers are positioning new formulations to support battery thermal pathways. Silver-cost exposure also keeps research and qualification priorities focused on lower-silver or alternative conductor approaches, including silver-plated copper and other hybrid filler strategies designed to maintain conductivity while reducing reliance on pure silver.
In solar manufacturing, shingled and heterojunction interconnection remains a key application area, supported by low-temperature processing and fragile cell structures. 2026 research activity on low-filled electrically conductive adhesives for shingled cell interconnection indicates continued technical progress in this workflow. Another opportunity is scaling directional conductivity solutions for fine-pitch interconnects, where anisotropic formulations and advanced particle architectures reduce shorting risk as pad spacing tightens. Finally, long qualification timelines in automotive-grade and semiconductor applications tend to favor suppliers that invest in localized application engineering and consistent manufacturing controls, reinforcing the value of regional technical centers such as Henkel's electronics-focused engineering footprint in Shanghai.
Recent Industry Developments in Electrically Conductive Adhesives Market
- May 2026: Henkel launched Loctite TLB 9270APS, a two-component polyurethane-based thermally conductive adhesive positioned for EV cell-to-pack battery designs. The launch expands the set of adhesive options engineered around battery pack thermal pathways and manufacturing process windows, supporting broader adoption of multifunctional materials in electrified powertrains.
- March 2026: 3M received a US patent (US 12,584,043) covering an electrically conductive bonding tape designed for low passive intermodulation performance, using a conductive adhesive layer with conductive fibers. The granted IP strengthens 3M's position in conductive adhesive tapes used in RF-sensitive assemblies where signal integrity constraints influence material selection.
- May 2025: Henkel opened an Adhesive Technologies Application Engineering Center in Shanghai to expand localized development and application support for electronics and EV customers. The added regional engineering capacity shortens iteration cycles between formulators and high-volume manufacturing lines in Asia-Pacific, where the market concentrates a large share of demand.
Electrically Conductive Adhesives Market Report Scope and Research Methodology
Market Definition and Coverage
This market covers electrically conductive adhesives sold for making electrical connections and bonding in electronic assemblies, where the adhesive provides a controlled conductive path. Values are captured as revenue from the adhesive material supplied into applications like circuitry, displays, lighting modules, and similar electronic builds.
Scope exclusions: Excludes non-conductive adhesive grades and conductive coatings, films, tapes, and solder materials that are not sold as conductive adhesives.
Segments Covered in This Report
- By Chemistry Type
- Epoxy
- Silicone
- Polyurethane
- Acrylic
- Other Chemistries
- By Type
- Isotropic
- Anisotropic
- By Application
- Solar Cells
- Automotive
- LED Lighting
- Printed Circuit Boards
- LCD Displays
- Other Applications
- By Geography
- Asia-Pacific
- China
- India
- Japan
- South Korea
- Rest of Asia-Pacific
- North America
- United States
- Canada
- Mexico
- Europe
- Germany
- United Kingdom
- France
- Italy
- Rest of Europe
- South America
- Brazil
- Argentina
- Rest of South America
- Middle East and Africa
- Saudi Arabia
- South Africa
- Rest of Middle East and Africa
- Asia-Pacific
Data Sources, Market Sizing, and Validation
Desk Research
Desk research is used to set the demand context and to avoid building the model on a single dataset that may be incomplete. We typically start by mapping where conductive adhesives are actually used, and then align those uses to measurable production signals in electronics and electrical manufacturing.
Public sources help us anchor volume and mix assumptions, such as U.S. Census Bureau manufacturing statistics, UN Comtrade trade flows for relevant material categories, International Energy Agency indicators for clean energy buildouts, government automotive and EV registration statistics, and technical papers in peer reviewed journals that discuss conductive filler loading, curing behavior, and reliability. We also review company annual reports and investor presentations for product mix comments, capacity additions, and regional exposure, along with association and standards body publications that explain test methods and compliance trends. In addition, we may use paid subscriptions for company financials and patent databases to cross-check innovation direction and formulation activity. The sources listed here are illustrative, and many other references are reviewed for data collection, clarification, and validation.
Primary Interviews and Surveys
Primary work is used to pressure test the desk assumptions and to fill the practical gaps, especially around application level consumption, typical loading of silver or carbon fillers, and pricing differences by performance grade. We interview a mix of adhesive formulators, raw material and filler participants, and downstream users in electronics manufacturing so the inputs reflect what is being specified and purchased in real projects across major regions.
Distribution of primary research fieldwork respondents
| Company type | Respondent position | Region |
|---|---|---|
| Top tier: 27% | CXOs: 14% | APAC: 46% |
| Mid tier: 51% | Functional/Unit leaders: 41% | EMEA: 29% |
| Smaller Players: 22% | Managers: 45% | Americas: 25% |
Market-Sizing & Forecasting
Sizing starts with a top-down demand pool build based on electronics output signals and application penetration, where assembly activity is reconstructed and then translated into adhesive consumption by use case. When conversion factors are being set, we rely on practical inputs from interviews, and the main clause comes last, so the model stays traceable to real consumption behavior.
Key inputs typically include electronics manufacturing output trends, EV and automotive electronics intensity, solar module installation trends where conductive bonding is used, changes in low temperature and lead-free interconnect adoption, typical adhesive usage per assembly for target applications, and average selling price movement tied to conductive filler content and performance grades. Results are then corroborated with selective bottom-up approximations, such as sampling supplier revenue disclosures, channel checks on pricing ranges, and volume-by-application checks, which helps us adjust totals when a single indicator may be noisy. If a segment has limited visibility, gaps are handled using conservative adoption ranges and then cross-validated with adjacent application signals before finalizing the split.
For forecasting, scenario analysis is used so the model can reflect different end-market build rates, followed by a smoothing step so short-term swings do not overstate long-run trends. Assumptions are reviewed with industry participants, and we keep the final outputs consistent with the most repeatable signals that can be revisited each year.
Data Validation & Update Cycle
Validation is done by checking the modeled totals against independent indicators, and then tracing back any unusual jumps to the underlying drivers. We look for variances between implied adhesive demand and end-market activity, and anomalies are reviewed at region and application levels before sign-off.
A second analyst reviews key inputs like pricing progression, penetration rates, and filler-driven grade mix so assumptions do not drift away from what interviews and public signals support. Reports are refreshed annually, and interim updates are made when material events occur, such as sharp raw material price shifts, major capacity changes, or sudden demand shocks in core electronics end uses. Before delivery, a fresh review pass is completed so clients receive the latest updated view.
Mordor Intelligence's Electrically Conductive Adhesives Market Size Compared Against Other Published Estimates
Published market values for electrically conductive adhesives can look far apart because the scope and counting logic vary across studies, even when the product label looks the same. Differences usually come from which applications are treated as in-scope, how prices are averaged across silver-filled and carbon-based grades, and how fast adoption is assumed in electronics and automotive builds.
The main gap comes from studies that fold conductive coatings, tapes, or broader electronics adhesive categories into the same revenue pool, whereas Mordor Intelligence counts only electrically conductive adhesive materials and ties the 2026 value to application-driven consumption checks rather than a broad materials roll-up.
Benchmark comparison
| Source | Market Size | Gaps in Research Methodology |
|---|---|---|
| Mordor Intelligence | USD 2.94 B (2026) | |
| Global Research House A | USD 2.57 B (2024) | Uses a different base year and a longer forecast window, and the scope language is broader by segmenting heavily by fillers and regions, which can shift what gets counted as conductive adhesive revenue. |
| Industry Analytics Group B | USD 1.90 B (2024) | Reports a lower starting point that appears sensitive to a narrower application set and a steeper later CAGR, which can happen when early-year pricing and grade mix assumptions are not reconciled with application-level usage ranges. |
The spread in the table is mostly explained by scope and timing, and then by how grade mix and pricing are averaged across end uses. By keeping the demand pool anchored to electronics assembly signals and validating conversion factors with interviews, our estimate stays easier to reconcile back to observable activity and repeatable update steps.
Key Questions Answered in the Report
What is the current electrically conductive adhesives market size and growth outlook?
The electrically conductive adhesives market size is USD 2.94 billion in 2026 and is projected to reach USD 3.88 billion by 2031, reflecting a 5.72% CAGR.
Which region contributes the most to electrically conductive adhesive demand?
Asia-Pacific holds 54.83% of global revenue in 2025 and is expanding at a 6.31% CAGR, led by semiconductor manufacturing and aggressive electric-vehicle policies.
Which chemistry type leads the market today?
Epoxy-based formulations account for 44.62% of the 2025 market thanks to their strength and versatility, while silicone grades are the fastest risers at a 6.42% CAGR.
What application segment generates the highest revenue?
Solar photovoltaic modules command 29.74% of 2025 sales because shingled and heterojunction cells rely on conductive adhesives for low-temperature interconnects.
Why are anisotropic conductive adhesives gaining traction?
Anisotropic grades grow at a 6.78% CAGR because they provide Z-axis conductivity that prevents shorts in fine-pitch displays, flexible circuits, and high-density battery boards.