
Electric Vehicle Sensor Market Size and Share
Market Overview
| Study Period | 2020 - 2031 |
|---|---|
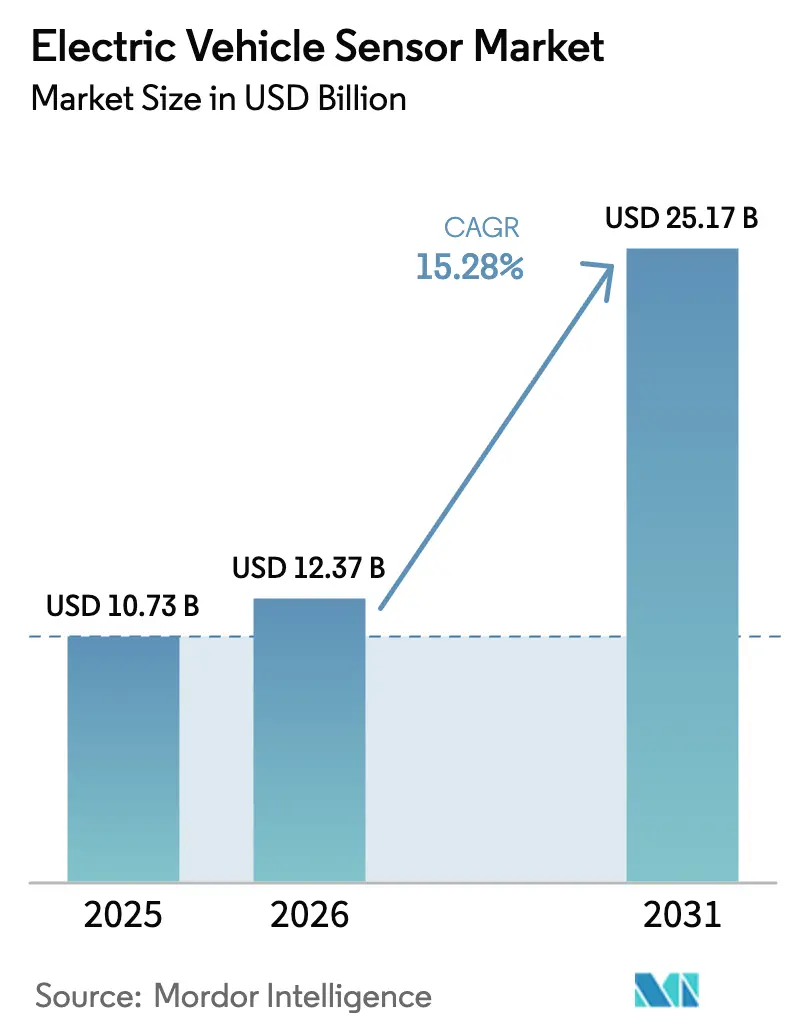
| Market Size (2026) | USD 12.37 Billion |
| Market Size (2031) | USD 25.17 Billion |
| Growth Rate (2026 - 2031) | 15.28 % |
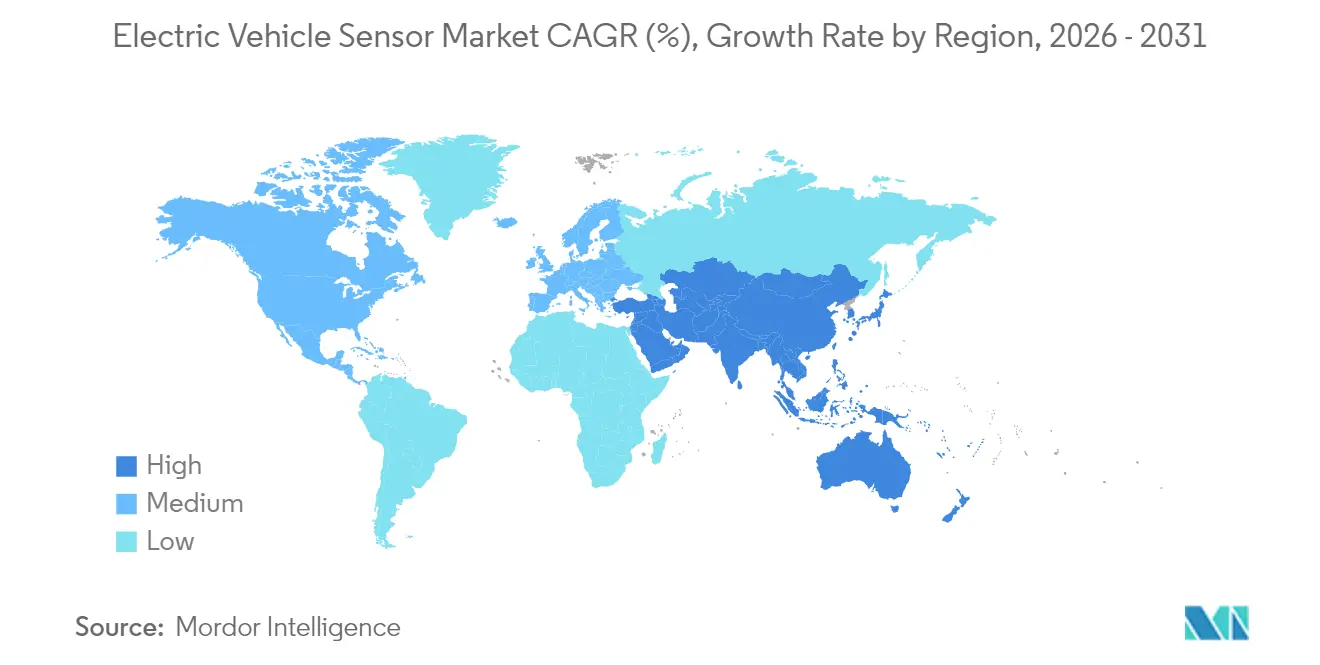
| Fastest Growing Market | Asia Pacific |
| Largest Market | Asia Pacific |
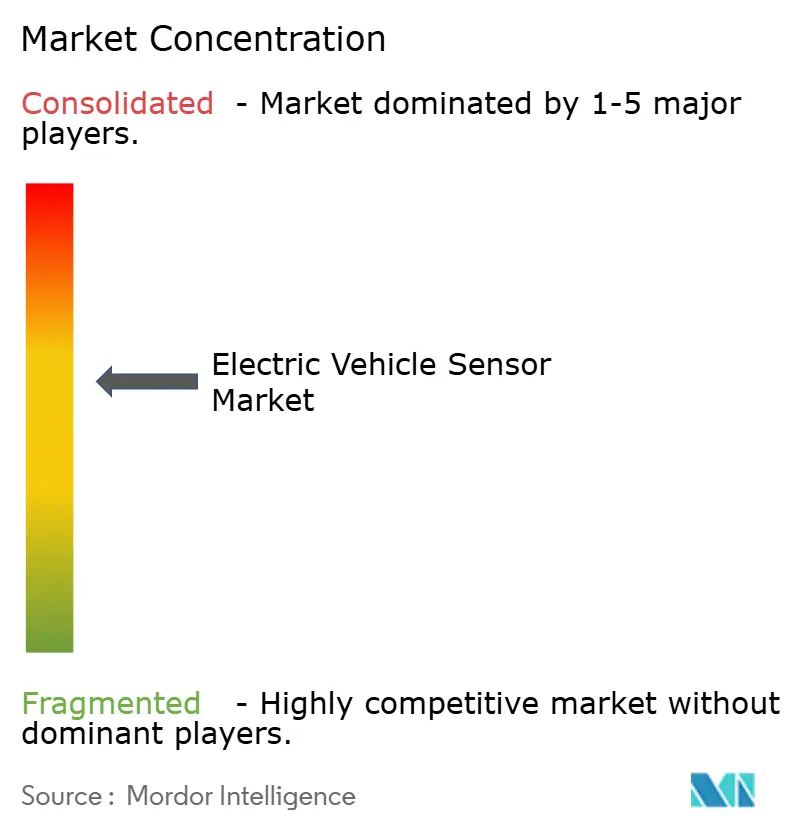
| Market Concentration | Medium |
Major Players *Disclaimer: Major Players sorted in no particular order Image © Mordor Intelligence. Reuse requires attribution under CC BY 4.0. | |
Electric Vehicle Sensor Market Analysis by Mordor Intelligence
The Electric Vehicle Sensor Market size was valued at USD 10.73 billion in 2025 and estimated to grow from USD 12.37 billion in 2026 to reach USD 25.17 billion by 2031, at a CAGR of 15.28% during the forecast period (2026-2031). Demand rises as 800 V vehicle platforms transition from performance brands to volume models, forcing redesign of current- and voltage-sensing architectures for wider bandwidth and higher isolation. Magneto-resistive (XMR) accuracy improvements, falling Hall-effect average selling prices, and mandatory ISO 26262 functional-safety levels accelerate design cycles. OEMs widen sensor counts to support predictive battery analytics, software-defined vehicles, and AI-enabled sensor fusion, enlarging unit volumes and silicon content. The electric vehicle sensor market also benefits from stricter battery-health OBD rules in Europe and China, while supply constraints in XMR wafers and Tier-2 chipsets temper near-term margins.
Key Report Takeaways
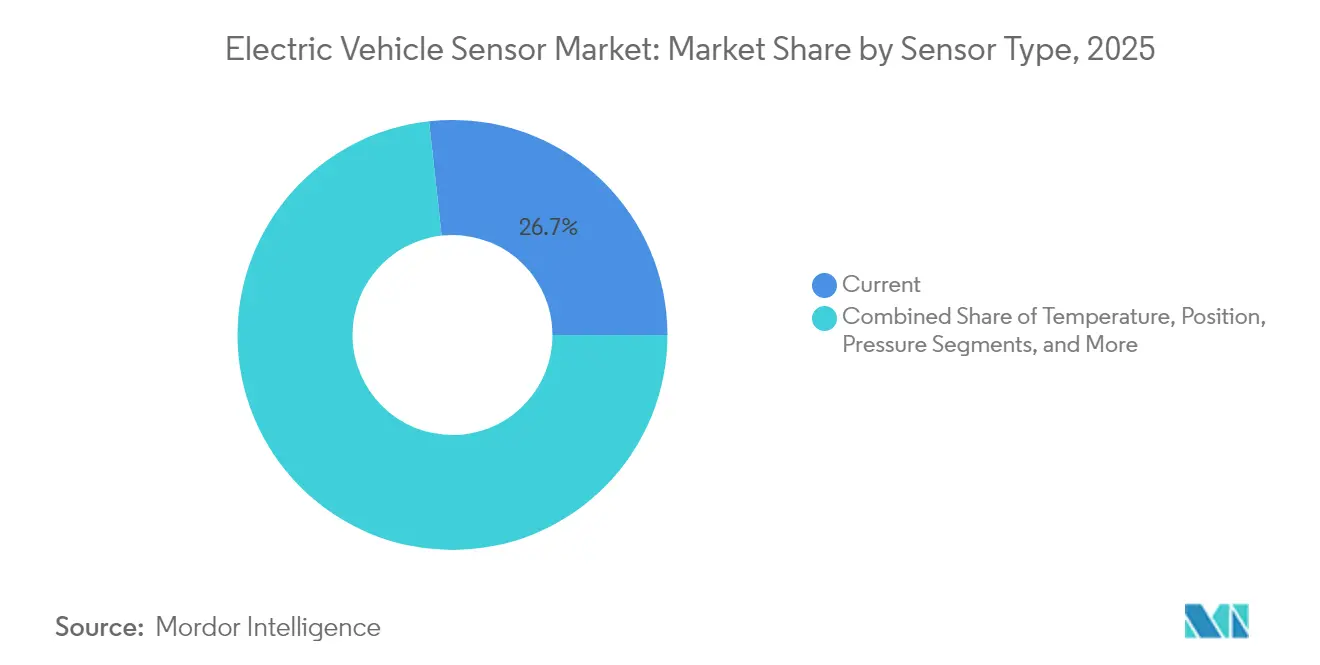
- By sensor type, current sensors led with 26.74% of the electric vehicle sensor market share in 2025; magneto-resistive sensors post the highest 15.44% CAGR through 2031.
- By vehicle type, passenger cars retained 73.52% of the electric vehicle sensor market share in 2025, yet commercial vehicles expand fastest at a 15.46% CAGR through 2031.
- By propulsion, battery-electric vehicles made up 66.43% share of the electric vehicle sensor market size in 2025; fuel-cell electric vehicles grow at 15.77% CAGR through 2031.
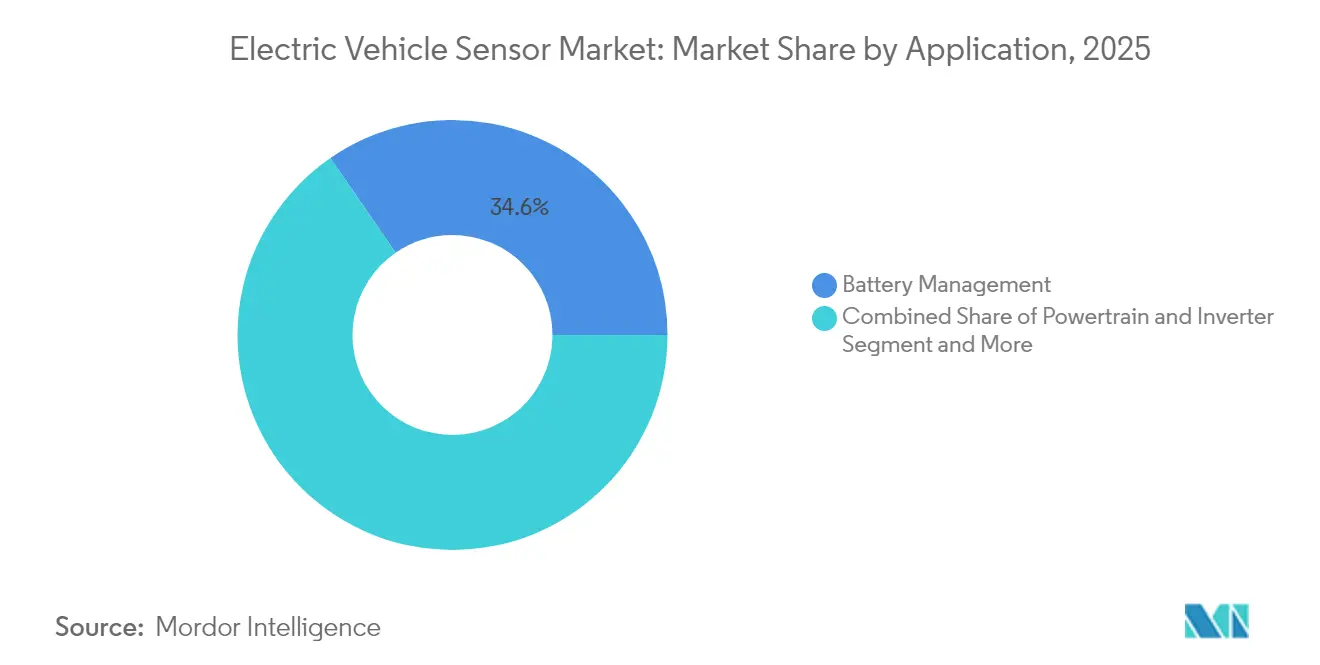
- By application, battery management accounted for 34.61% of the electric vehicle sensor market size in 2025, whereas ADAS and safety systems are advancing at a 15.69% CAGR to 2031.
- By sensor technology, hall-effect devices held 32.98% of the electric vehicle sensor market share in 2025, while XMR technology records a 15.41% CAGR to 2031.
- By geography, Asia-Pacific captured 36.12% of the electric vehicle sensor market size in 2025 and remains the fastest-growing geography at a 15.36% CAGR through 2031.
Note: Market size and forecast figures in this report are generated using Mordor Intelligence’s proprietary estimation framework, updated with the latest available data and insights as of 2026.
Market Trends and Insights
Drivers Impact Analysis of Electric Vehicle Sensor Market*
| Driver | (~) % Impact on CAGR Forecast | Geographic Relevance | Impact Timeline |
|---|---|---|---|
| Evolution of 800V Platforms | +2.8% | Global, with Asia-Pacific and Europe leading adoption | Medium term (2-4 years) |
| Declining Hall-Effect ASPs | +2.1% | Global, strongest impact in price-sensitive markets | Short term (≤ 2 years) |
| Mandatory ISO 26262 Functional-Safety Levels | +1.9% | Europe and North America primarily, expanding globally | Long term (≥ 4 years) |
| Stricter Battery-Health OBD Requirements | +1.6% | Europe and China, with spillover to other regions | Medium term (2-4 years) |
| AI-Enhanced BMS Needing Multi-Axis Sensing | +1.4% | Premium vehicle segments globally | Long term (≥ 4 years) |
| GaN/SiC Shift Opening New Current-Sensing Sockets | +1.2% | High-performance EV segments globally | Long term (≥ 4 years) |
| Source: Mordor Intelligence | |||
Evolution of 800 V Platforms Expanding Current/Voltage Sensor Demand
OEM migration from 400 V to 800 V electrical architectures raises continuous current requirements toward 1,000 A and pushes switching frequencies beyond 100 kHz, compelling the adoption of XMR and advanced Hall sensors with wider bandwidths and reinforced isolation. Porsche commercialized 800V with Taycan, enabling 22.5-minute 5-80% fast charges.[1]“Taycan Charging technology,” Porsche AG, porsche.com Hyundai’s E-GMP expands the topology to higher-volume segments, normalizing new sensor specifications across supply chains.[2]“E-GMP Architecture Overview,” Hyundai Motor Company, hyundai.com Silicon-carbide inverters heighten sensitivity to response latency, favoring sensors that combine microsecond accuracy with functional-safety diagnostics. Suppliers leverage the transition to lift ASPs on feature-rich sensing modules and secure long-term design wins for next-generation platforms.
Declining Hall-Effect ASPs Broadening BEV Adoption
Manufacturing scale at 12-inch fabs and higher test-throughput flows cut Hall-effect ASPs by a considerable margin yearly, letting cost-sensitive BEV nameplates integrate 120-plus sensors per unit while preserving vehicle affordability. TDK-Micronas and Allegro MicroSystems offer single-package Hall sensors that merge sensing, conditioning, and digital interfaces, trimming BOM and board area. Chinese BEVs use these devices to meet base functional-safety needs, expanding the electric vehicle sensor market into entry strata. Price elasticity effects enlarge unit demand faster than revenue erosion, sustaining overall market value.
Mandatory ISO 26262 Functional-Safety Levels for Traction Inverters
ASIL-D obligations require dual-redundant measurement channels, self-diagnostics, and fault reporting in current sensors. Melexis launched MLX9042x ICs with on-chip safety monitors to meet inverter ASIL-D targets. Compliance adds USD 5–15 per sensor but filters non-qualified vendors, strengthening incumbents’ pricing power. Regulators extend the standard from Europe to North America, accelerating global harmonization over the long term.
Stricter Battery-Health OBD Requirements (EU 2027, China 2026)
Euro 7 and China’s forthcoming OBD rules compel continuous cell-level checks for degradation and thermal runaway, stimulating distributed temperature and voltage sensor networks. Amphenol Advanced Sensors supplies noise-immune thermistors that withstand 800 V EMI conditions. Retrofit obligations on existing fleets create replacement demand, and mandated data interfaces foster aftermarket analytics subscriptions.
Restraints Impact Analysis of Electric Vehicle Sensor Market*
| Restraint | (~) % Impact on CAGR Forecast | Geographic Relevance | Impact Timeline |
|---|---|---|---|
| XMR Wafer Inflation | -1.8% | Global, with strongest impact on specialized sensor suppliers | Short term (≤ 2 years) |
| Persistent Tier-2 Chipset | -1.5% | Global supply chains, acute in automotive sector | Medium term (2-4 years) |
| China/RoW IP Split Fragmenting Supply Chains | -1.2% | Global, with bifurcation between Chinese and Western markets | Long term (≥ 4 years) |
| Cyber-Security Mandates Raising Sensor BOM | -0.9% | Developed markets initially, expanding globally | Medium term (2-4 years) |
| Source: Mordor Intelligence | |||
XMR Wafer Inflation Squeezing Margins
Limited global foundry capacity for automotive-grade XMR wafers raises procurement costs substantially compared with 2024 levels, compressing gross margins despite strong top-line growth. Rare-earth commodity price volatility magnifies the pressure, especially for smaller vendors without hedged contracts. TDK-Micronas expanded Freiberg capacity, yet capital intensity restricts rapid incremental additions. Profit headwinds incentivize supply-chain partnerships and vertical integration strategies.
Persistent Tier-2 Chipset Shortages
Automotive microcontrollers and analog front-end ICs experience 26-52-week lead times, delaying sensor module qualification and extending OEM launch schedules. Renesas scaled 300 mm Naka lines but postponed further expansion due to tariff concerns. Sensor makers keep higher inventory, tying up working capital and complicating cost forecasts through 2027.
*Our forecasts treat driver/restraint impacts as directional, not additive. The impact forecasts reflect baseline growth, mix effects, and variable interactions.
Electric Vehicle Sensor Market Segment Analysis
By Sensor Type:
Current Sensors Lead as XMR Adoption ClimbsCurrent sensors retained a 26.74% electric vehicle sensor market share in 2025 on the back of universal deployment in BMS, inverters, charging, and on-board DC-DC converters. Continuous scaling of motor power levels and parallel traction architectures sustains volume momentum. Magneto-resistive sensors record a 15.44% CAGR to 2031, outspeeding Hall devices by capitalizing on sub-μs response and 3-ppm offset drift. Temperature sensors continue proliferating inside battery packs, while position and speed sensors underpin motor control and regenerative braking accuracy.
The electric vehicle sensor market responds to OEM calls for single-package combinations that unite current, temperature, and isolation functions to shorten design cycles. Tier-1s embed shunt-based back-ups within XMR modules to satisfy ASIL-D redundancy without duplicating PCB footprint. Pressure sensors grow inside cold-plate cooling circuits and fuel-cell stack monitoring, although their volume lags due to slower hydrogen rollout. Emerging gas detection and vibration sensing herald a shift toward predictive maintenance across fleet-owned vans and buses.


By Vehicle Type:
Commercial Fleets Drive Electrification AccelerationPassenger cars held 73.52% of the electric vehicle sensor market share in 2025 as incentives and falling battery costs stimulated mainstream adoption worldwide. Nonetheless, commercial vehicles log the strongest 15.46% CAGR through 2031, leveraging regulatory pushes like California’s Advanced Clean Trucks Rule. Daily mileage intensifies TCO benefits, motivating large sensor arrays for thermal, load, and predictive safety monitoring. City buses and last-mile vans embed more than 190 sensors per vehicle, against 130-150 in typical passenger cars, magnifying subsystem opportunities.
Fleet operators demand real-time diagnostics to cut downtime; thus, smart sensors featuring CAN-FD and automotive Ethernet move toward the edge to pre-process data. Passenger car models pivot to experiential differentiators such as haptic climate controls and biometric monitoring, feeding moderate but sustained sensor ASP growth. Cross-segment technology sharing narrows component variance, enabling platform economies for Tier-1 suppliers inside the electric vehicle sensor market.
By Propulsion Type:
Fuel Cells Accelerate Despite BEV DominanceBattery-electric vehicles controlled 66.43% of the electric vehicle sensor market size in 2025, benefiting from dense charging networks and improving LFP pack economics. Fuel-cell electric vehicles post a 15.77% CAGR to 2031, buoyed by freight corridor hydrogen stations and UN GTR 13 safety harmonization. Fuel-cell stacks require hydrogen leak, humidity, airflow, and stack voltage sensors, raising per-vehicle sensor value despite nascent volumes.
Plug-in hybrids maintain presence in infrastructure-limited regions but cede share as battery ranges rise beyond 600 km. Platform engineering converges around modular sensor harnesses that suit both BEV and FCEV variants, supporting parts commonality. This convergence stabilizes sourcing calendars and balances capacity utilization at leading sensor fabs.
By Application:
ADAS Safety Systems Strengthen Growth OutlookBattery management preserved a 34.61% share of the electric vehicle sensor market size in 2025 through hardwired safety imperatives within lithium-ion chemistries. Nonetheless, ADAS and safety systems register the fastest 15.69% CAGR as regulators oblige automatic emergency braking and lane-keeping aids from 2028 in Europe and China. Sensor fusion among radar, lidar, ultrasonic, and camera streams requires precise ego-motion and current feedback, multiplying sensor counts and bandwidth.
Thermal management sensors migrate to distributed architectures that monitor coolant flow, pack interface temperatures, and passenger comfort loads simultaneously. Powertrain control sensors evolve toward higher bandwidth specs to support 25 kHz PWM switching in SiC inverters, while chassis applications integrate wheel-end current sensors to optimize regenerative torque split. Cabin comfort sensors open a growing aftermarket for retrofit smart climate modules.
By Sensor Technology:
Hall-Effect Dominance Faces XMR ChallengeHall-effect devices commanded 32.98% of the electric vehicle sensor market share in 2025 due to low cost and high qualification maturity. Magneto-resistive (XMR) adoption races ahead at 15.41% CAGR, supplying superior noise immunity essential inside high-voltage battery packs and 800 V inverters. MEMS inertial sensors broaden into road-profiling and battery swelling detection, whereas optical encoders see upticks in precise rotor position feedback for high-speed motors.
Capacitive and ultrasonic devices reinforce user interface and parking applications and remain price-sensitive. Stray-field-robust magnetic sensors from Melexis tolerate the electromagnetic disturbances inherent to silicon-carbide stages, encouraging OEM migration for long-term stability. Integrated solutions that house sensing elements, signal chains, and digital interfaces in one lead-frame anchor design-win momentum across the electric vehicle sensor market.
Geography Analysis
APAC Electric Vehicle Sensor Market
Asia-Pacific held 36.12% of the electric vehicle sensor market share 2025 and is expected to rise at a 15.36% CAGR through 2031. China manufactured 11.49 million electric vehicles in 2024 and pursues the localization of semiconductor inputs, decreasing import reliance below 70% by 2028. Beijing’s subsidies now link to local sensor sourcing, forcing foreign suppliers to join ventures or technology licensing. South Korea and Japan contribute advanced XMR and MEMS IP, while Southeast Asian nations attract capacity expansions targeting tariff-free exports to Europe and North America.
Europe Electric Vehicle Sensor Market
Europe remains a premium sensor technology hub as ISO 26262 and Euro 7 rules embed minimum sensor content in every new EV. Germany anchors the value chain with specialist fabs, whereas Northern Europe stimulates per-capita EV uptake through aggressive tax exemptions. The European electric vehicle sensor market prioritizes supply-chain resilience with EU Chips Act incentives for domestic silicon. Battery-health OBD mandates taking effect in 2027 further enlarge sensor attachment rates.
North America Electric Vehicle Sensor Market
North America exhibits steady growth, aided by the Inflation Reduction Act’s manufacturing credits for domestic semiconductor lines and California’s ZEV regulations. US commercial fleets electrify parcel vans, school buses, and refuse trucks, each requiring rugged sensor networks for high-cycle durability. Canada supplies critical minerals for Hall and XMR magnets, while Mexico positions as a cost-optimized assembly hub for Tier-1 sensor modules serving US OEM plants. Harmonized safety and cyber-security rules across USMCA nations simplify homologation efforts and support cross-border volume scaling inside the electric vehicle sensor market.

Regulatory Landscape
Safety and cybersecurity requirements for EV sensing hardware continue to tighten, which raises expectations for redundancy, documentation, and verification across ADAS, steering, braking, and high-voltage monitoring. UN Regulation No 171, which defines electronic control system behavior and failure response for sensors and actuators, took effect on 26 September 2025, setting out formal expectations for sensor diagnostics, plausibility checks, and fault handling within a safety case.
At the vehicle level, ISO 26262 and ISO/SAE 21434 increasingly frame how secure interfaces and update readiness are built into sensor deployments. In the United Kingdom, the July 2026 GB type-approval response confirms 18 mandated vehicle safety technologies, while in the United States the 2026 NHTSA regulatory agenda includes modernization of FMVSS standards and a March 2026 proposal to modify FMVSS 103 and 104 for ADS-equipped vehicles, indicating continued alignment of legacy requirements with sensor-heavy architectures.
Value Chain Analysis
The EV sensor value chain runs from sensing elements (Hall, XMR), through analog front-end and mixed-signal IC design and wafer fabrication, to advanced packaging and testing, followed by module integration by Tier-1s and automotive-grade validation. Qualification cycles are tied to AEC-Q grade expectations and ISO 26262 process evidence. The 800 V and SiC/GaN transition also increases isolation, bandwidth, and EMI robustness requirements, shifting emphasis toward specialized packaging, calibration, and end-of-line test capacity.
Downstream, Tier-1s and system suppliers package sensors into functional modules to reduce part count and wiring complexity, including higher integration approaches such as Sensata combining protection functions in high-voltage components (for example, fuse and contactor consolidation). As the software-defined vehicle shift grows, interface and I/O devices that pre-process sensor data near the edge before it feeds central high-performance computers are gaining traction, strengthening the need for tighter coordination between semiconductor vendors and vehicle-domain compute providers. Regionalization strategies also show up in how suppliers balance wafer and module footprints across major automotive manufacturing corridors to reduce tariff and trade exposure while meeting localized sourcing requirements.
Competitive Landscape
The electric vehicle sensor market shows moderate concentration. Continental, Bosch, and ZF leverage system-integration strengths and multi-domain ECU portfolios to lock in platform awards with legacy OEMs. Semiconductor specialists such as Infineon, NXP, Allegro, and Melexis differentiate through proprietary XMR and stray-field-robust IP. Renesas and TI bundle sensing interfaces with domain controller SoCs to capture software-defined vehicle momentum.
Consolidation accelerates as sensor suppliers acquire algorithm specialists and package houses to deliver turnkey modules. Chinese OEMs form joint ventures with domestic fabs to secure sensor capacity amid US-China export controls. Strategic moves include Renesas’s 8-in-1 e-axle reference designs that fold inverter, BMS, and power-distribution sensing into a single MCU domain, and Valeo’s Smart eDrive 6-in-1 thermal-power unit, improving range by 24% through dynamic sensor-driven control logic.[4]“Smart eDrive and Panovision Showcase,” Valeo SA, valeo.com
Competition pivots from discrete component cost to lifecycle data value, pushing vendors to embed edge AI accelerators and over-the-air update hooks. Functional-safety credentialing and cybersecurity certification remain entry barriers. Niche opportunities blossom around hydrogen leak detection and pack swelling acoustics, where few global suppliers hold patents. Supplier power rises as OEMs grapple with dual sourcing constraints and software complexity.
Electric Vehicle Sensor Industry Leaders
Continental AG
Robert Bosch GmbH
ZF Friedrichshafen AG
Denso Corporation
Sensata Technologies, Inc.
- *Disclaimer: Major Players sorted in no particular order
Electric Vehicle Sensor Market Companies Covered in this Report
- Continental AG
- Robert Bosch GmbH
- ZF Friedrichshafen AG
- Denso Corporation
- Sensata Technologies Inc.
- Valeo Group
- Amphenol Corp.
- Renesas Electronics Corp.
- NXP Semiconductors N.V.
- Allegro MicroSystems Inc.
- Infineon Technologies AG
- Melexis NV
- Analog Devices Inc.
- TE Connectivity Ltd.
- Texas Instruments Inc.
- ON Semiconductor Corp.

Market Opportunities and Future Outlook
Opportunities are expanding around high-voltage and higher-frequency powertrain platforms where sensing bandwidth, isolation, and functional-safety diagnostics become differentiators, especially for current, voltage, and temperature sensing in traction inverters and battery packs. This is reinforced by compliance milestones already in motion, including stricter battery-health OBD rules in China (2026) and the EU (2027), which require continuous monitoring and distributed sensing within packs. That raises attachment of temperature and voltage sensors and increases the value of noise-immune components in high-EMI environments.
A second opportunity is more integrated sensing inside electromechanical subsystems and chassis components, where integration can cut weight and wiring while improving accuracy and durability. OEM programs reflect this direction, including ZF beginning series production of its Smart Chassis Sensor for the Cadillac CELESTIQ, integrating sensing into a suspension ball joint, and Continental developing a rotor-mounted e-Motor Rotor Temperature Sensor (eRTS) to measure temperatures directly on the rotor and reduce rare-earth usage. On the electronics side, ZF and SiliconAuto demonstrating an I/O interface chip concept for real-time sensor pre-processing in high-performance computing platforms points to whitespace in sensor-to-compute architectures, where latency, determinism, and cybersecurity constraints increasingly shape sensor module design.
Recent Industry Developments in Electric Vehicle Sensor Market
- June 2026: Robert Bosch GmbH introduced third-generation silicon carbide (SiC) semiconductors in India to improve EV power electronics efficiency and performance. This expands Bosch's local semiconductor capacity and supports broader EV sensor and power electronics integration in regional platforms. The initiative also supports sourcing of inverters and related sensing components within India.
- March 2026: ZF Friedrichshafen AG demonstrated a new I/O interface chip and microcontroller design for automotive high-performance computers, developed with SiliconAuto, at Embedded World 2026. The demonstration highlights ZF's move toward software-defined vehicle architectures. The collaboration widens ZF's focus on high-end sensor data processing for automotive computers.
- January 2026: ZF Friedrichshafen AG debuted AI Road Sense at CES, an AI based chassis adaptation system using high performance sensors, with series production for 2028. The system reflects ZF's approach to monetizing sensor data through software-driven chassis solutions. It also complements AI-enabled sensor fusion across EV platforms.


Electric Vehicle Sensor Market Report Scope and Research Methodology
Market Definition and Coverage
For this methodology, the electric vehicle sensor market covers sensors that are designed into battery electric and plug-in hybrid vehicles to measure, detect, or control key vehicle conditions (temperature, pressure, current, voltage, position, and speed) across major EV systems.
Scope exclusions: We exclude charging-station sensors and non-automotive sensors, and we also do not count standalone vehicle software and analytics that are sold without sensor hardware.
Segments Covered in This Report
- By Sensor Type
- Current
- Temperature
- Position
- Pressure
- Magnetic
- Speed/Rotation
- Others
- By Vehicle Type
- Passenger Cars
- Commercial Vehicles
- By Propulsion Type
- Battery-Electric
- Plug-in Hybrid
- Fuel-Cell Electric
- By Application
- Battery Management
- Powertrain and Inverter
- ADAS and Safety
- Thermal Management
- Chassis/Braking
- Cabin Comfort
- By Sensor Technology
- Hall-effect
- MEMS
- Magneto-resistive
- Optical
- Capacitive
- Ultrasonic
- Others
- By Geography
- North America
- United States
- Canada
- Rest of North America
- South America
- Brazil
- Argentina
- Rest of South America
- Europe
- Germany
- United Kingdom
- France
- Italy
- Spain
- Russia
- Rest of Europe
- Asia-Pacific
- China
- Japan
- India
- South Korea
- Australia and New Zealand
- Rest of Asia-Pacific
- Middle East and Africa
- Saudi Arabia
- United Arab Emirates
- South Africa
- Rest of Middle East and Africa
- North America
Data Sources, Market Sizing, and Validation
Desk Research
Desk work starts by anchoring the EV demand pool, then narrowing it to the sensor content that typically scales with electrification. We use public sources such as IEA EV sales and stock data, national vehicle registration statistics, and UNECE or NHTSA safety and functional requirements to set realistic adoption patterns by region and vehicle class.
To price and sanity check the build, we review technical and industry sources such as ISO functional safety documentation, SAE or IEEE publications on sensing and power electronics, and patent databases that indicate where sensing architectures are moving (for example, current sensing and battery monitoring). Company filings, investor decks, and reputable press are used to cross-check product mix shifts, capacity additions, and major design changes. Where needed, paid subscriptions are used in a limited way for company financials, news screening, contract and tender scanning, and patent lookups. These examples are not exhaustive, and additional sources are used for data collection, validation, and clarification.
Primary Interviews and Surveys
Primary inputs are used to stress-test the desk assumptions, especially the sensor count per vehicle, the mix of sensor technologies, and how pricing is moving under cost-down programs. We interview EV OEM ecosystem contacts, component suppliers, and distribution or integration partners across the major producing and consuming regions so the model captures real design wins, regulation-driven changes, and platform refresh timing.
Distribution of primary research fieldwork respondents
| Company type | Respondent position | Region |
|---|---|---|
| Top tier: 26% | CXOs: 12% | APAC: 45% |
| Mid tier: 60% | Functional/Unit leaders: 35% | EMEA: 36% |
| Smaller Players: 14% | Managers: 53% | Americas: 19% |
Market-Sizing & Forecasting
Sizing starts with a top-down build where EV production and parc, split by powertrain and region, are converted into a sensor demand pool using penetration and content-per-vehicle assumptions that reflect typical EV architectures. We then corroborate the totals with selective bottom-up checks, such as sampled sensor ASP multiplied by estimated unit volumes for key applications, plus supplier and channel feedback to correct any overcounting.
The inputs that tend to move the results most include EV unit sales and platform mix (BEV versus PHEV), average sensor count growth tied to battery monitoring and thermal management, the share of 400 V versus 800 V platforms that affects current and voltage sensing needs, ASP progression by sensor type as volumes scale, and regulation signals that drive mandatory monitoring and diagnostics. Where application-level data is thin, we use proxy ratios from comparable vehicle programs and validate those ratios using interview feedback before applying them.
For forecasting, we run scenarios so adoption and pricing can be adjusted together under different EV rollout and cost-down paths. The final path is selected after comparing scenarios against the consensus from primary discussions and against observable EV build plans and policy momentum.
Data Validation & Update Cycle
We check outputs through multiple passes to keep the numbers consistent with independent signals, including EV production trends, sensor content shifts, and semiconductor supply conditions that can affect pricing. Variance checks are run across regions and applications, and any sharp changes are re-reviewed to confirm they are driven by a real factor, such as a platform transition, and not a modeling artifact.
Before sign-off, the model and assumptions go through analyst review steps, followed by targeted re-contacts when a data point falls outside the expected range. Reports are refreshed annually, with interim updates added when material events change the outlook. Right before delivery, a final update pass is completed so clients receive the latest view supported by the same repeatable steps.
Mordor Intelligence's Electric Vehicle Sensor Market Estimate Compared With Other Published Estimates
Published numbers for EV sensors can vary, mainly because each publisher draws the market box differently, then applies different pricing and vehicle-volume assumptions. Differences also come from what gets counted as an EV sensor versus a general automotive sensor, and how quickly each model is refreshed when EV platforms shift.
The main gap comes from whether general automotive sensing (especially ADAS and cabin sensing) is fully included for every electrified vehicle. In Mordor Intelligence, sizing is tied to EV-specific sensing content using vehicle build and platform-voltage mix checks before ASP curves are applied. Some estimates also mix OEM-fit sensors with broader aftermarket replacements, while others use aggressive price escalation instead of cost-down led ASP steps, which widens the spread.
Benchmark comparison
| Source | Market Size | Gaps in Research Methodology |
|---|---|---|
| Mordor Intelligence | USD 10.73 B (2025) | |
| Industry Publisher A | USD 10.73 B (2024) | Uses a 2024 value year and can blend wider automotive sensor content into EV programs, which can shift totals if EV-only sensor content per vehicle is not isolated. |
| Global Publisher B | USD 15.11 B (2024) | Often applies higher ASP and content-per-vehicle assumptions across all EV types and regions, and may include a broader set of sensing categories that are not consistently EV-specific. |
The table indicates that year selection and what is included as EV-specific sensing explain most of the differences, not a single math step. When vehicle volumes, platform transitions, and realistic ASP erosion are kept aligned, the estimate becomes easier to trace back to clear inputs and to update as new EV programs launch.


Key Questions Answered in the Report
What is the electric vehicle sensor market’s current size and growth outlook?
The market is valued at USD 12.37 billion in 2026 and is forecast to reach USD 25.17 billion by 2031, translating to a 15.28% CAGR during 2026-2031.
Which sensor type commands the largest revenue share?
Current sensors lead with 26.74% share in 2025, while magneto-resistive devices post the fastest 15.44% CAGR through 2031.
Which application segment is growing the fastest?
ADAS and safety systems record the highest 15.69% CAGR, driven by mandatory automatic emergency braking and expanded sensor-fusion requirements.
Which region is the biggest and fastest-growing market?
Asia-Pacific holds 36.12% revenue share in 2025 and exhibits a market-leading 15.36% CAGR through 2031, buoyed by China’s large-scale EV production.
What regulations are most influential for future sensor demand?
ISO 26262 ASIL-D functional-safety mandates for traction inverters plus Euro 7 and China 2026 on-board battery diagnostics significantly raise required sensor counts.
What supply-side challenges could impede market growth?
XMR wafer cost inflation and prolonged Tier-2 chipset lead times squeeze margins and extend product-launch cycles, particularly over the next two to four years.
Page last updated on:


 Your data is secure and never sold or shared.


