
Electric Vehicle Repair Service Market Size and Share
Market Overview
| Study Period | 2020 - 2031 |
|---|---|
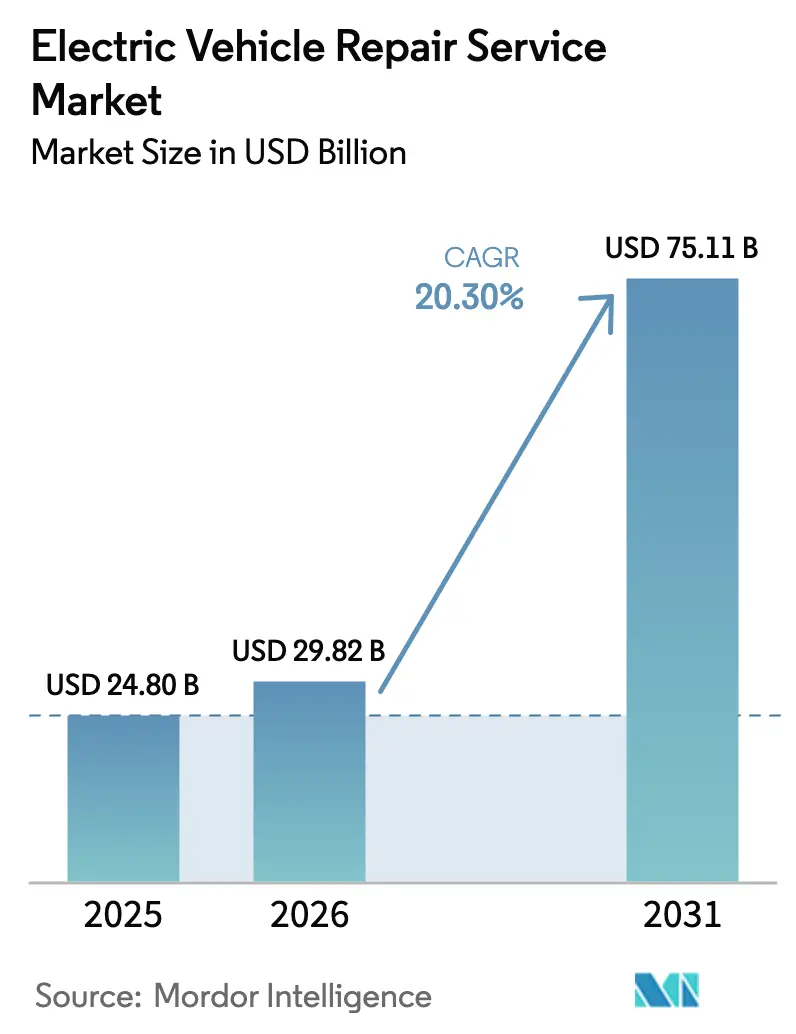
| Market Size (2026) | USD 29.82 Billion |
| Market Size (2031) | USD 75.11 Billion |
| Growth Rate (2026 - 2031) | 20.30% CAGR |
| Fastest Growing Market | Middle East and Africa |
| Largest Market | Asia-Pacific |
| Market Concentration | Medium |
Major Players *Disclaimer: Major Players sorted in no particular order Image © Mordor Intelligence. Reuse requires attribution under CC BY 4.0. | |
Electric Vehicle Repair Service Market Analysis by Mordor Intelligence
The electric vehicle repair service market size is expected to grow from USD 24.80 billion in 2025 to USD 29.82 billion in 2026 and is forecast to reach USD 75.11 billion by 2031 at 20.3% CAGR over 2026-2031. Surging post-warranty vehicle counts, tightening zero-emission mandates, and wider public fast-charging infrastructure are displacing traditional mechanical repairs with high-voltage diagnostics, battery analytics, and software-driven preventative maintenance. OEM warranty expirations now overlap with the first large global EV cohort sold between 2020-2022, pulling a growing share of work away from franchised service bays toward certified independents. Meanwhile, right-to-repair debates and telematics data-sharing rules could reshape competitive dynamics once secure interfaces mature. Regulatory fleet-conversion timetables, particularly for medium and heavy commercial vehicles, further amplify demand for specialized uptime-critical services across regional corridors.
Key Report Takeaways
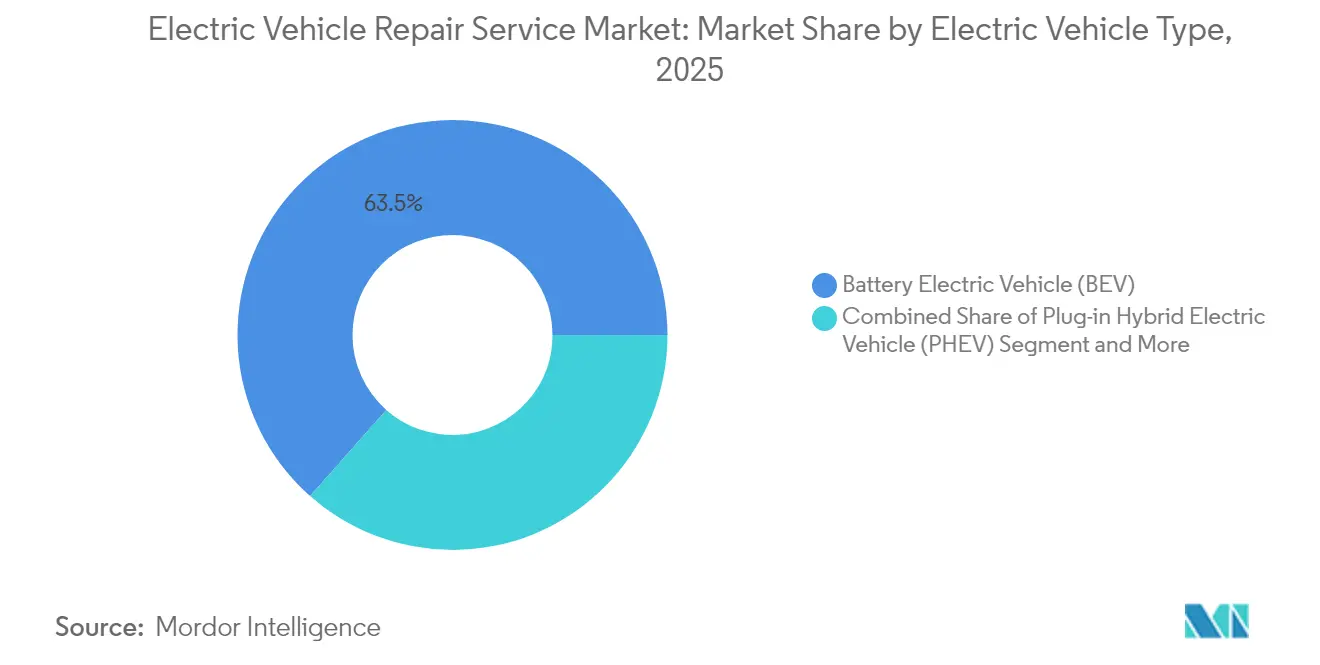
- By electric vehicle type, battery electric vehicles held 63.48% of the electric vehicle repair service market share in 2025, while fuel-cell electric vehicles are projected to register a 23.95% CAGR through 2031.
- By service type, preventive maintenance generated 32.10% of the electric vehicle repair service market share in 2025, whereas battery diagnostics and remanufacturing are tracking the fastest 22.12% CAGR outlook.
- By component type, high-voltage battery and BMS services commanded 29.02% of the electric vehicle repair service market share in 2025 and are advancing at a 21.10% CAGR through 2031.
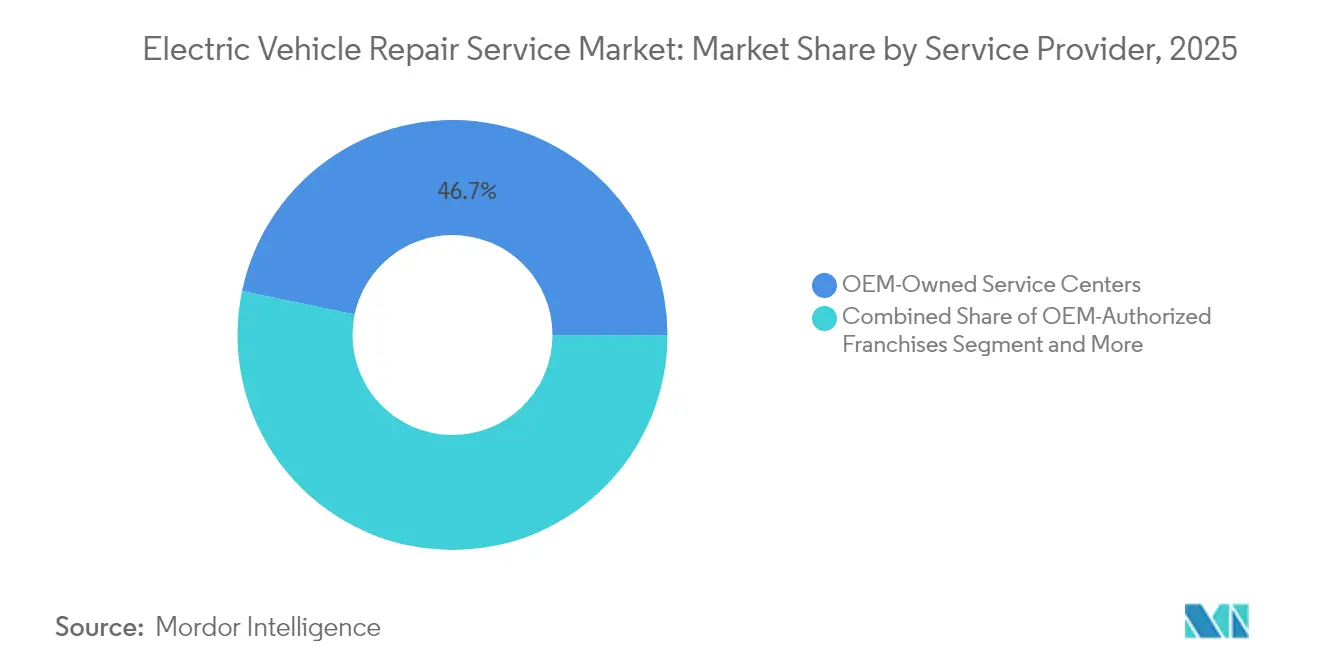
- By service provider, OEM-owned centers accounted for 46.72% of the electric vehicle repair service market share in 2025; mobile repair networks are anticipated to expand at a 21.98% CAGR to 2031.
- By vehicle type, passenger cars delivered 68.42% of the electric vehicle repair service market share in 2025, but medium and heavy commercial units are forecast to post a 22.55% CAGR to 2031.
- By geography, Asia-Pacific generated 44.80% of the electric vehicle repair service market share in 2025, whereas the Middle East and Africa will track the fastest 21.58% CAGR outlook.
Note: Market size and forecast figures in this report are generated using Mordor Intelligence’s proprietary estimation framework, updated with the latest available data and insights as of 2026.
Global Electric Vehicle Repair Service Market Trends and Insights
Drivers Impact Analysis*
| Driver | (~) % Impact on CAGR Forecast | Geographic Relevance | Impact Timeline |
|---|---|---|---|
| Rising Global EV Parc and Aging | +4.2% | Global (China, Europe, North America) | Medium term (2-4 years) |
| Government ZEV Mandates and Incentives | +3.8% | North America, Europe, select APAC | Short term (≤2 years) |
| Rapid DC-Fast Charging Network Build-Out | +2.9% | Global (led by China, Europe) | Medium term (2-4 years) |
| OEM Certification for Independents | +2.1% | North America, Europe | Medium term (2-4 years) |
| Right-To-Repair and Telematics Access | +1.8% | North America, Europe | Long term (≥4 years) |
| Emergence of Battery-Second-Life Ecosystems | +1.6% | Global (early gains in China, Europe) | Long term (≥4 years) |
| Source: Mordor Intelligence | |||
Rising Global EV Parc and Post-Warranty Vehicle Aging
Vehicle cohorts sold between 2020-2022 have begun to exit warranty, exposing owners to full repair costs and creating a surge in independent shop volumes. China illustrates scale effects as heavy-duty electric trucks reached 22% penetration in the first half of 2025, far ahead of other regions, concentrating service activity along logistics corridors. Unscheduled downtime now costs commercial fleets USD 500-1,000 per day, pushing preventive maintenance contracts and battery refurbishment adoption. South Korea’s Poen grew significantly from 2020-2023 by remanufacturing battery packs at one-third the new-unit price. The maturing parc therefore underpins long-run revenue visibility for operators with energy-storage competencies.
Government ZEV Mandates and Purchase Incentives
Policies such as California’s Advanced Clean Trucks rule compel escalating zero-emission fleet percentages, guaranteeing a predictable volume of in-service vehicles that require certified maintenance capacity. Brazil’s EV sales surged 90% to 177,360 units in 2024, 71% plug-ins after infrastructure subsidies widened, demonstrating how incentives translate into aftermarket demand. Domestic-production credits also push OEMs to seed regional service footprints to secure compliance support. However, uncertainty over post-2025 federal incentives could inject procurement volatility, especially in commercial adoption, where operating-cost parity remains marginal.
Rapid Build-Out of Public DC-Fast Charging Networks
Global DC-fast points multiplied, with Brazil alone recording 2,430 units by February 2025, each costing about BRL 300,000 (USD 150,000) [1]“Brazil Fast-Charger Census,” Valor Econômico, valor.com.br. Higher utilization accelerates wear on charging ports, thermal loops, and contactors, lifting service frequency. Energy majors like Vibra and Raízen bundle maintenance contracts for their charger rollouts, opening novel revenue lines for mobile technicians stationed along transit corridors. Competing platform standards such as Tesla V4 Superchargers and BYD megawatt chargers will require multi-protocol diagnostic equipment and technician cross-training.
Mainstream OEM Certification Programs for Independent Shops
Programs from GM, Tesla, and others grant tool access and parts pricing to independents that meet safety and training criteria. Bosch earmarked EUR 2.5 billion (~USD 1.17 billion) through 2027 for AI-enabled diagnostics to support these certified channels [2] “Bosch invests heavily in AI as a growth driver,” Robert Bosch GmbH, bosch-presse.de. While the framework widens geographic coverage, cost barriers favor well-capitalized chains capable of acquiring insulated lifts, battery lifts, and high-voltage PPE. Hydrogen-equipped models like Honda’s CR-V e: FCEV layer additional certification hurdles around fuel-cell stack service and leak detection.
Restraints Impact Analysis*
| Restraint | (%) Impact on CAGR Forecast | Geographic Relevance | Impact Timeline |
|---|---|---|---|
| Skilled EV Technician Shortage | -2.8% | Global (North America, Europe most severe) | Short term (≤2 years) |
| High Battery Replacement Costs | -2.3% | Global (higher in emerging markets) | Medium term (2-4 years) |
| OEM Software Limits Access | -1.9% | Global (independent shops affected) | Medium term (2-4 years) |
| Declining EV Parts Revenue | -1.4% | Global | Long ter |
| Source: Mordor Intelligence | |||
Acute Shortage of High-Voltage-Licensed Technicians
Certification pipelines currently produce too few specialists to meet fleet electrification timelines. High-voltage coursework can run 6-12 months, and demand is worst for commercial truck platforms that integrate complex BMS and telematics overlays. Premium wages inflate repair pricing and limit the expansion of regional service density. Firms investing early in technician up-skilling, like Bosch, gain durable labor advantages while smaller garages stall on capital and talent.
High Cost and Logistics Risk of Lithium-ion Battery Replacement
The high cost of passenger-vehicle and commercial packs exceeds the residual values of aging units. Hazmat shipping, insurance, and inventory financing compound cost exposures. Supply bottlenecks prolong vehicle downtime, and insurers lack granular failure-rate data, complicating actuarial pricing. Refurbishment specialists such as Poen mitigate by offering certified packs at one-third the new-unit cost, yet warranty confidence remains a buyer hurdle.
*Our forecasts treat driver/restraint impacts as directional, not additive. The impact forecasts reflect baseline growth, mix effects, and variable interactions.
Segment Analysis
By Electric Vehicle Type: BEVs Anchor Current Demand While FCEVs Accelerate
Battery Electric Vehicles represented 63.48% of the electric vehicle repair service market share in 2025, underscoring their entrenched dominance within the electric vehicle repair service market. The segment’s mechanical simplicity translates into recurring needs for battery diagnostics, inverter calibration, and thermal-loop flushing rather than drivetrain overhauls. As the electric vehicle repair service market expands, BEVs' high installed base guarantees steady workshop throughput. Though only a minimal share today, Fuel-Cell Electric Vehicles headline growth at 23.95% CAGR as refueling networks emerge around freight corridors. Hydrogen stack servicing demands additional cleanroom protocols and gas-leak detection, which few facilities possess, creating a premium niche.
Fleets still running Plug-in Hybrids and conventional Hybrids generate hybrid dual-powertrain work, obligating shops to maintain ICE tooling alongside high-voltage gear. Specialized garages use this cross-skill to cross-sell full BEV conversions to operators seeking maintenance simplification. With BEVs pushing into heavier classes and FCEVs scaling in long-haul trucking, providers that stratify training across energy architectures will capture multi-segment wallet share.


By Service Type: Preventive Maintenance Dominates Revenue Mix
Preventive schedules delivered 32.10% of the electric vehicle repair service market share in 2025 through software updates, coolant replacement, and high-voltage insulation checks. Over-the-air diagnostics now flag thermal-pack deviations weeks before failure, enabling just-in-time part ordering that lifts first-time fix rates. AI-assisted triage, pioneered by Tesla in 2025, mines sentiment data from service requests to prioritize cases and reduce communication lags. Battery diagnostics and remanufacturing, growing at 22.12% CAGR, anchor the future revenue arc as aging packs swell refurbishment pipelines.
Corrective mechanical repairs retreat in share but remain necessary after collisions or suspension stress from battery weight. Bodywork centers now install insulated isolation zones and EV-only bays to mitigate arc flash risk. Mobile and remote repair visits—covering firmware flashes, tire rotations, and 12-V battery swaps—accelerate as fleets prize uptime and urban charging queues provide predictable technician staging points.
By Component Type: Battery and BMS Lead Both Volume and Growth
High-voltage battery work captured 29.02% of the electric vehicle repair service market share in 2025 and is also growing fastest at 21.10% CAGR. This rare dual leadership underscores the centrality of energy storage expertise. Degradation analytics leveraging impedance spectroscopy and cell-level data loggers underpin early warning interventions. Inverters and traction motors add a steady workload, though their solid-state nature means fewer catastrophic failures than internal combustion equivalents. Heat-pump HVACs and liquid-cooled charging ports introduce new service lines around refrigerant loop balancing and dielectric-fluid exchanges.
Advanced driver-assistance sensor recalibration climbs alongside Level-2+ autonomy packages, demanding millimeter-level camera alignment and software handshakes post-repair. Meanwhile, chassis and suspension items wear faster on heavier battery vehicles, pushing alignment centers to upgrade to higher-capacity lifts and recalibrated torque tools.
By Service Provider: OEM Control Persists as Mobile Networks Surge
OEM-owned outlets held a 46.72% of the electric vehicle repair service market share in 2025 due to exclusive diagnostic rights during warranty. Franchise fleets extend reach but follow OEM protocols. As the electric vehicle repair service market advances, mobile repair networks log a 21.98% CAGR, bolstered by Ford Pro’s 700-unit mobile fleet that cuts visit times to around 70 minutes per van . Certified independents leverage Bosch’s AI diagnostics to close complexity gaps, though capital requirements deter many small shops.
Software gatekeeping remains the chief moat, yet right-to-repair momentum could erode this advantage later in the decade. Operators are able to bundle mobile convenience with certified tooling to arbitrage both OEM parts pricing and fleet downtime economics.
By Vehicle Type: Commercial Fleets Become Growth Engine
Passenger cars supplied 68.42% of the electric vehicle repair service market share in 2025, reflecting mass-market adoption and a broad service footprint. Medium and heavy commercial vehicles, however, project a 22.55% CAGR through 2031 as fleet mandates bite. China already shows significant penetration in electric heavy trucks, compressing learning curves and lifting battery-swap adoption.
Light commercial last-mile vans keep steady volume as e-commerce surges, demanding route-optimized charging and predictive fleet maintenance platforms. Battery-swap stations have almost reached 3,000 in NIO’s network by the end of 2024, promise rapid turnaround, but service providers must master pack lock-out and thermal-cache equalization routines before swaps return to circulation.
Geography Analysis
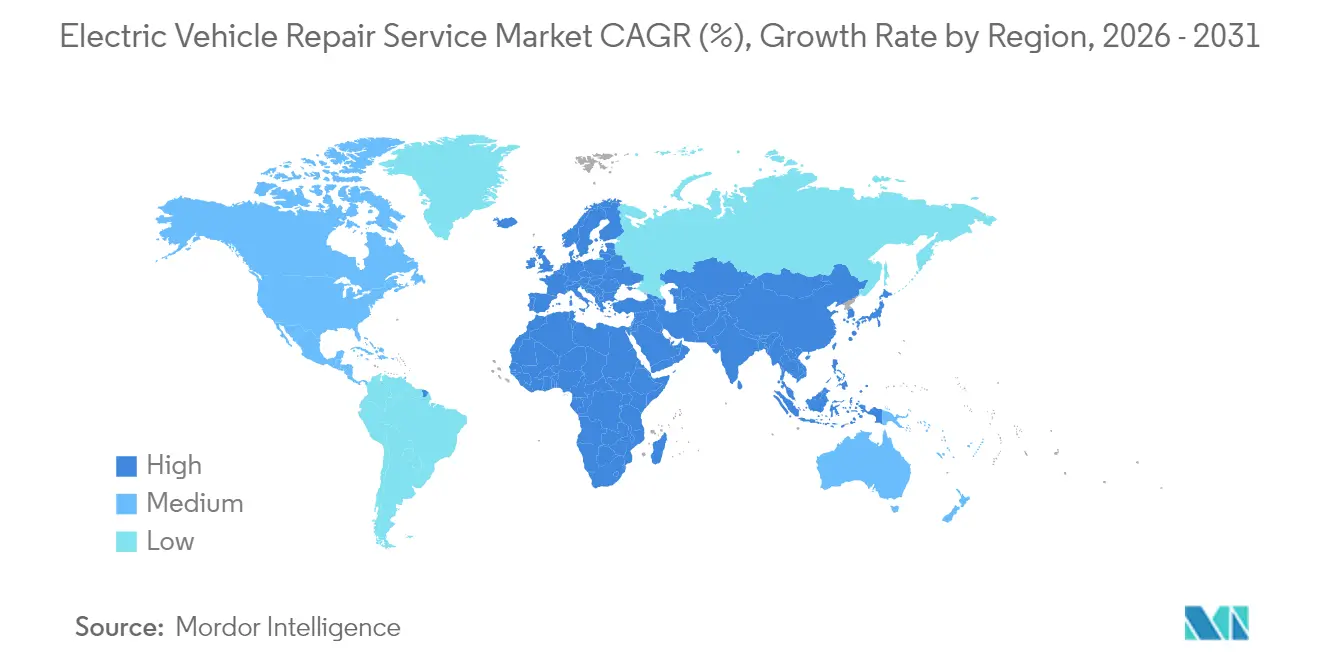
Asia-Pacific held 44.80% of the electric vehicle repair service market share in 2025, anchored by China’s battery manufacturing scale and aggressive fleet conversion quotas. Dense urban clusters yield high workshop utilization, while vertically integrated incumbents like CATL supply both packs and service toolkits, reinforcing regional dominance. NIO’s swap network trialing fifth-generation stations by Christmas 2025 further deepens localized service sophistication. Japan and South Korea contribute niche leadership in hydrogen systems and battery refurbishment. Poen’s notable CAGR battery remanufacture exemplifies capability depth. India’s market shows promise yet wrestles with technician shortages and uneven charging rollouts.
North America combines established dealership networks with legislative pressure for data access. California’s ZEV mandates and extensive Tesla Supercharger grids deliver the densest repair volumes, though technician scarcity inflates labor rates. Federal right-to-repair bills could unlock independent shop participation once secure APIs arrive. Canada follows closely with incentives mirrored in the United States structures.
Europe benefits from stringent CO₂ standards and robust corporate fleet commitments. Germany and the Nordic nations lead workshop upgrades, while the EU battery directive accelerates recycling capacity buildouts like SK tes’s Rotterdam plant. However, skilled-labor constraints echo North American challenges. Southern Europe and emerging Eastern European clusters adopt retrofit business models, converting light commercial ICE vans to BEV drivetrains to comply with urban low-emission zones.
Middle East & Africa shows the fastest 21.58% CAGR, catalyzed by GCC sovereign funds funneling capital into charging corridors and assembly plants. Harsh desert climates stress thermal management, raising service intervals on cooling plates and coolant pumps. Turkey’s customs-union link to Europe positions it as a regional parts and service hub, while South Africa leverages mining ties to anchor battery material flows. Brazil anchors South America, its significant EV-sales surge in 2024 validating infrastructure-driven adoption; public chargers rose to 2,430 DC units by February 2025, expanding aftermarket footprints.

Regulatory Landscape
Regulation is increasingly focused on access to vehicle data and repair information, while also tightening safety requirements for high-voltage work. In the European Union, Commission Delegated Regulation (EU) 2026/699 (adopted March 23, 2026) amends the type-approval framework under Regulation (EU) 2018/858 to reinforce standardized access to onboard diagnostics (OBD) and repair and maintenance information, in line with EN ISO 18541 principles for structured repair-information access. In the United States, a July 1, 2026 U.S. Environmental Protection Agency (EPA) communication reiterated manufacturers obligations to provide emissions-related service and training information and related diagnostic/service information via web access, supporting third-party repair capability for both light- and heavy-duty vehicles where emissions systems overlap with software-driven diagnostics.
Governments are also formalizing expectations for EV workshop safety and technician competency. China issued GB/T 47439-2026 on April 30, 2026 (implementation date August 1, 2026), defining safety requirements for new energy vehicle maintenance operations and raising compliance needs around isolation, tooling, and process controls for high-voltage service. In Australia, the Australian Automotive Dealer Association (AADA) highlighted in May 2025 submissions tied to the NSW Motor Dealers and Repairers Act regulations impact assessment that recognizing OEM training as evidence of competency can materially influence licensing pathways and the supply of EV-qualified technicians.
Value Chain Analysis
The EV repair service value chain starts with OEMs and tier-1 suppliers that control critical diagnostics, parts cataloging, and software update pathways, then moves through authorized dealer and franchise service bays, certified independent workshops, mobile service operators, and collision and body centers retrofitted with insulated bays and high-voltage processes. Diagnostic equipment, cybersecurity-controlled interfaces, calibration tools (including ADAS), and high-voltage PPE act as a gating layer that determines who can capture post-warranty demand as preventive maintenance and software-driven troubleshooting shift work away from traditional mechanical jobs.
Downstream, reverse logistics and circular flows are increasingly central as battery diagnostics, refurbishment, and salvage parts harvesting expand. Recyclers and resellers such as LKQ participate in salvage and component redistribution, while specialized battery remanufacturers and testing providers feed refurbished packs and validated modules back into service networks. The chain is also widening through direct-to-consumer and new-entrant OEM models that plug into third-party coverage to reduce geographic gaps, including Aptera Motors partnering with RepairPal (over 4,300 locations) and VinFast signing MOUs with 29 after-sales partners globally, both of which expand service routing, parts fulfillment, and customer appointment throughput without fully owned footprints.
Competitive Landscape
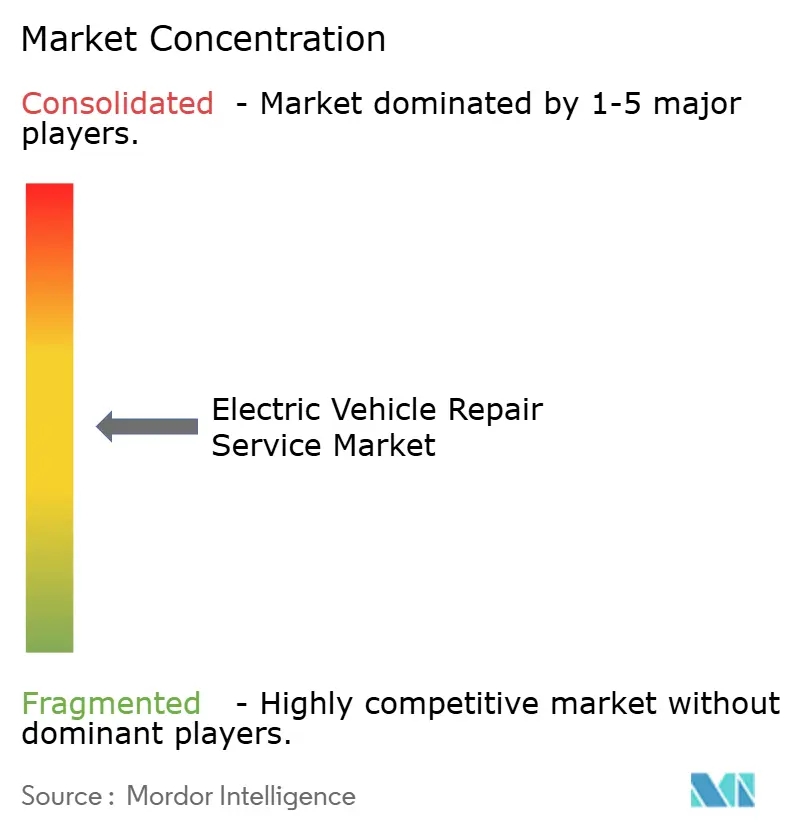
Competition remains fragmented but tilts toward consolidation around intellectual property and software platforms. OEM-controlled centers leverage gated diagnostics, warranty coverage, and over-the-air update streamlining to lock in early-life vehicles. Tesla’s 2025 AI service module triages customer tickets with sentiment filters, reducing escalation time and cementing brand retention. Bosch’s EUR 2.5 billion (~USD 1.17 billion) AI spend democratizes sophisticated scanning through certified independents, potentially redistributing volume away from OEM exclusivity.
Independent EV-specialist chains chase differentiation via convenience and cost transparency. Mobile fleets, free from brick-and-mortar overhead, undercut traditional rates and meet fleet downtime KPIs. Battery-focused refurbishers like Poen exploit high pack prices to offer economical alternatives, gaining traction among ride-hailing and light-commercial operators.
Strategic alliances proliferate: charger network operators contract maintenance bundles; insurers partner with certified centers to cap claim exposure; parts suppliers embed telematics in replacement components to monitor in-field performance. The market rewards depth over breadth—operators mastering high-voltage safety, cybersecurity compliance, and predictive analytics carve defensible niches even without national footprints.
Electric Vehicle Repair Service Industry Leaders
Tesla Inc.
Robert Bosch GmbH
LKQ Corporation
Hyundai Motor Co.
BYD Auto Co. Ltd
- *Disclaimer: Major Players sorted in no particular order

Market Opportunities and Future Outlook
In the near term, the clearest whitespace is around scalable diagnostics, battery health assessment, and standardized access to repair information that reduces onboarding friction for independents and multi-brand fleets. Third-party battery testing into general workshops is a tangible accelerator, with Generational and Maverick Diagnostics taking EV battery health testing to 6,000 UK workshops, improving consistency in triage of state-of-health and repair-versus-replace decisions. At the same time, policy moves that formalize repair-information access, including the EU action in Commission Delegated Regulation (EU) 2026/699, support investment cases for multi-OEM tool stacks, secure data workflows, and technician training programs across Europe.
Another opportunity centers on mobile service and geographically distributed coverage for new EV entrants and expanding OEMs, especially where fixed service bays lag vehicle deliveries. Hyundai Motor Co. launched a mobile service fleet in the United States with a stated target of 150 active units by year-end, while Aptera Motors selected RepairPal to provide certified service access nationwide, both reinforcing service models that prioritize convenience, faster scheduling, and lower fixed overhead. For operators, these moves point to demand for standardized high-voltage safety operating procedures, reinforced by China GB/T 47439-2026, and for partnerships that bundle parts availability, diagnostics, and customer routing into repeatable service capacity.
Recent Industry Developments
- July 2026: Generational partnered with Maverick Diagnostics to deploy EV battery health testing technology across 6,000 independent workshops in the United Kingdom. The rollout expands battery health diagnostics across the repair network, enabling higher-margin services. The collaboration strengthens independent workshop capabilities and shifts revenue toward software-driven maintenance.
- July 2026: Fleet Assist expands its mobile service fleet; mobile units conducted 21.3% of all EV SMR jobs in their network and grew by over 300 units to 900 vehicles. The growth of the mobile EV service model reduces fixed overhead and improves uptime for fleets. This shift elevates mobile-first service as a core channel.
- May 2026: Hyundai Motor Co. launched a mobile service fleet in the United States with factory-trained technicians and genuine parts, targeting 150 active units by year-end. The expansion broadens manufacturer-supported mobile maintenance. It bridges warranty and maintenance gaps and accelerates mobile-service adoption for EV owners.


Research Methodology Framework and Report Scope
Market Definition and Coverage
This market covers paid services used to diagnose, maintain, and repair electric vehicles, including labor and service-related parts for high-voltage, electronics, and vehicle systems performed by authorized and independent service providers.
Scope exclusions: It excludes public charging services, vehicle sales, insurance claims administration, and roadside towing unless they are billed as part of an EV repair job.
Segmentation Overview
- By Propulsion Type
- Battery Electric Vehicle (BEV)
- Plug-in Hybrid Electric Vehicle (PHEV)
- Hybrid Electric Vehicle (HEV)
- Fuel-Cell Electric Vehicle (FCEV)
- By Service Type
- Preventive Maintenance (software updates, HV-system checks)
- Corrective Mechanical Repair
- Battery Diagnostics and Remanufacture
- Body and Paint (EV-specific materials)
- Mobile and Remote Repair Services
- By Component Type
- High-Voltage Battery and BMS
- Electric Motor / Inverter
- Thermal Management and HVAC
- ADAS Sensors and Calibration
- Chassis / Suspension
- By Service Provider
- OEM-Owned Service Centers
- OEM-Authorized Franchises
- Independent EV-Specialist Garages
- Mobile Repair Networks
- By Vehicle Type
- Passenger Car
- Light Commercial Vehicle
- Medium and Heavy Commercial Vehicle
- By Geography
- North America
- United States
- Canada
- Rest of North America
- South America
- Brazil
- Argentina
- Rest of South America
- Europe
- Germany
- United Kingdom
- France
- Italy
- Spain
- Russia
- Rest of Europe
- Asia-Pacific
- China
- Japan
- India
- South Korea
- Australia and New Zealand
- Rest of Asia-Pacific
- Middle East and Africa
- United Arab Emirates
- Saudi Arabia
- Turkey
- Egypt
- South Africa
- Rest of Middle East and Africa
- North America
Data Sources, Market Sizing, and Validation
Desk Research
Desk work started by mapping the EV parc, service intensity, and typical repair categories so the model is anchored to a real-world demand pool. We mainly used public EV stock and sales releases, along with repair and parts context from official publications, to understand where service volumes and spend tend to sit.
Sources consulted include International Energy Agency (IEA) EV outlook datasets, national transport and vehicle registration statistics, US EPA and NHTSA technical and safety publications, Eurostat trade series for parts flows, and standards and safety guidance from groups such as SAE International. We also reviewed company filings, investor decks, reputable press, and selective paid subscriptions for company financials and news, plus patent databases to sanity-check where diagnostics and battery service tools are trending. This list is illustrative only, and many other sources were also used to collect data, validate assumptions, and clarify open questions.
Primary Interviews and Surveys
Primary work focused on EV service managers, workshop owners, parts-channel experts, and technical trainers so pricing, utilization, and job mix could be validated beyond what public datasets show. We also tested assumptions on battery-related repairs, calibration needs, and the practical impact of right-to-repair access, then refined the model by region so differences in parc maturity and labor rates were captured.
Distribution of primary research fieldwork respondents
| Company type | Respondent position | Region |
|---|---|---|
| Top tier: 29% | CXOs: 13% | APAC: 47% |
| Mid tier: 56% | Functional/Unit leaders: 32% | EMEA: 34% |
| Smaller Players: 15% | Managers: 55% | Americas: 19% |
Market-Sizing & Forecasting
Sizing begins with a top-down reconstruction of service spend by building from the on-road EV parc and expected annual service events, which are then converted into value using typical labor hours and billed parts per job. To keep the totals realistic, the outputs are cross-checked with selective bottom-up approximations, such as sampled workshop revenue ranges, channel checks on common repair tickets, and simple ASP-times-volume tests for a few high-frequency services.
Inputs used in the model include EV parc by region, post-warranty share, average labor rate and billed hours, battery and thermal system repair incidence, electronics and sensor calibration frequency, and parts price movement for high-voltage components. When a data gap exists for a smaller country or service line, we used proxy signals (such as parc age mix and labor indices) and then re-tested the implied spend per vehicle with interview feedback.
Forecasting is run using scenario analysis, where the baseline path is informed by expected EV parc growth, aging of early cohorts into out-of-warranty repair demand, and technician capacity build-out. The pace of parts price decline and the mix shift toward software and diagnostics were also adjusted using expert consensus, before the final curve was signed off.
Data Validation & Update Cycle
Validation is done by checking model outputs against independent signals such as EV parc growth, service bay capacity signals, and reported aftersales activity in public disclosures. If a country total implies an unusual spend per vehicle or an abrupt step-change without a clear trigger, the assumptions are revisited and, where needed, interview follow-ups are initiated.
A multi-step review is followed so calculations, unit conversions, and regional rollups are verified before publication. Reports are refreshed annually, and interim updates are made when material events occur, such as major regulation changes, repairability rules, or sharp parts price shifts. Before delivery, we do a final pass to ensure the latest public data and market signals are reflected in the narrative and numbers.
Mordor Intelligence's Electric Vehicle Repair Service Market Size Versus Other Published Estimates
Published market sizes for EV repair services can look far apart, even when they appear to cover the same topic. In most cases, the spread comes from what is counted as repair, which vehicle types are included, and whether the value includes adjacent aftersales services that sit near repair in a workshop invoice.
Charging support subscriptions and warranty administration often get bundled into wider aftersales totals, but those items are outside Mordor Intelligence's scope for the electric vehicle repair service market. This is why our 2026 number can land below estimates that capture the full post-sale wallet. Differences also show up when one source assumes a faster battery repair mix shift, uses a single global labor rate, or applies a fixed exchange rate year across regions, which can overstate or understate the same underlying service activity.
Benchmark comparison
| Source | Market Size | Gaps in Research Methodology |
|---|---|---|
| Mordor Intelligence | USD 29.82 B (2026) | |
| Regional Consultancy A | USD 35.00 B (2024) | Uses an earlier base year and includes hybrids and fuel cell vehicles, which expands the addressable parc and inflates repair demand versus a stricter EV-only framing. |
| Trade Journal B | USD 24.00 B (2025) | Uses a broader aftersales lens but relies on limited service categories and conservative repair frequency, which can undercount diagnostic and high-voltage labor as EV parc ages. |
Overall, the comparison shows that year selection and what gets counted as repair versus aftersales drives most of the gap. By tying spend to parc-based service events, practical labor and parts assumptions, and interview-tested repair incidence, the resulting market value stays traceable to a repeatable set of inputs rather than a single headline growth rate.


Key Questions Answered in the Report
What is the global value of the electric vehicle repair service market in 2026?
The electric vehicle repair service market size stands at USD 29.82 billion in 2026.
How fast is demand for EV repair services expected to grow through 2031?
Aggregate revenue is forecast to rise at a 20.3% CAGR between 2026 and 2031.
Which service type leads current spending?
Preventive maintenance delivers 32.10% of 2025 revenue, reflecting OEM focus on software updates and battery health checks.
Which component category generates the most workshop revenue?
High-voltage battery and BMS services account for 29.02% of 2025 turnover and remain the fastest-growing line item.
Which region shows the highest growth outlook?
The Middle East & Africa region projects a 21.58% CAGR, driven by large infrastructure investments and electrification mandates.
Page last updated on:






