
Market Overview
| Study Period | 2019 - 2031 |
|---|---|
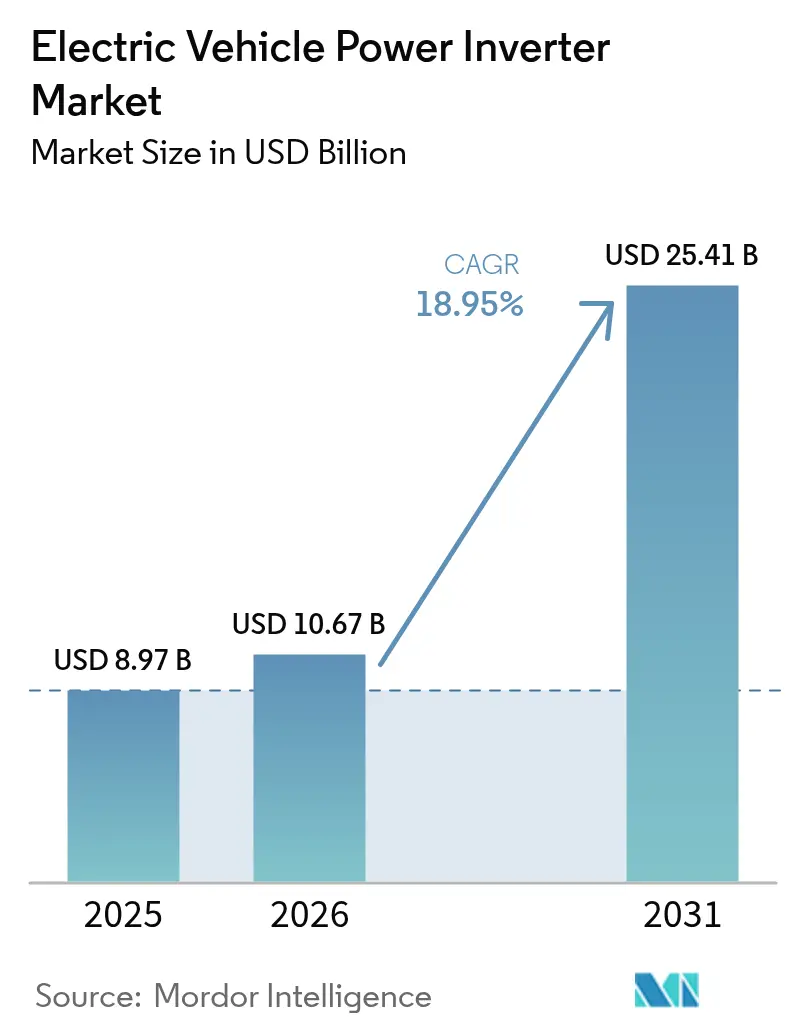
| Market Size (2026) | USD 10.67 Billion |
| Market Size (2031) | USD 25.41 Billion |
| Growth Rate (2026 - 2031) | 18.95 % |
| Fastest Growing Market | Asia Pacific |
| Largest Market | Asia-Pacific |
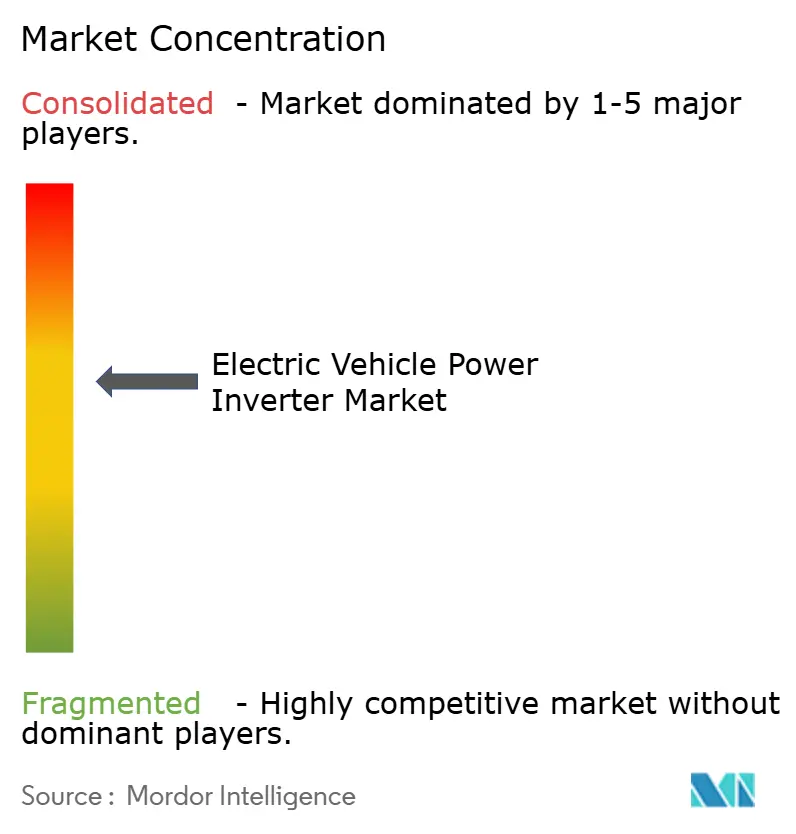
| Market Concentration | Medium |
Major Players *Disclaimer: Major Players sorted in no particular order Image © Mordor Intelligence. Reuse requires attribution under CC BY 4.0. | |
Electric Vehicle Power Inverter Market Analysis by Mordor Intelligence
The Electric Vehicle Power Inverter market size is projected to expand from USD 8.97 billion in 2025 and USD 10.67 billion in 2026 to USD 25.41 billion by 2031, registering an 18.95% CAGR between 2026 and 2031. Momentum in the Electric Vehicle Power Inverter market is driven by three forces: the wider adoption of 800-volt electrical architectures, the commercialization of silicon-carbide power semiconductors, and zero-emission regulations that phase out internal-combustion drivetrains in the largest auto-producing economies. Battery-electric models continue to anchor demand, but hydrogen fuel-cell programs aimed at heavy trucks and buses signal a diversified propulsion landscape that will keep design requirements fluid. Tier-1 suppliers are sharpening their focus on integrated e-Axles, betting that consolidating the motor, inverter, and gearbox into a single housing will give automakers a cost-and-weight advantage when high-volume platforms launch after 2026. At the same time, silicon-carbide capacity expansions, from Wolfspeed in North Carolina to Infineon in Dresden, underscore industry consensus that wide-bandgap devices, not legacy silicon IGBTs, will unlock the next step-change in inverter efficiency.
Key Report Takeaways
- By propulsion type, battery-electric vehicles held 54.12% of the Electric Vehicle Power Inverter market share in 2025, while fuel-cell models are forecast to post the fastest 19.35% CAGR through 2031.
- By vehicle type, passenger cars led the Electric Vehicle Power Inverter market with a 63.91% share in 2025; heavy commercial vehicles and buses are on track for a 19.42% CAGR to 2031.
- By voltage architecture, ≤400-volt systems accounted for 68.54% of the Electric Vehicle Power Inverter market size in 2025, yet ≥800-volt platforms are advancing at a 19.32% CAGR through 2031.
- By semiconductor material, silicon IGBTs captured 61.99% of the Electric Vehicle Power Inverter market share in 2025, whereas silicon-carbide MOSFETs show a 19.34% CAGR outlook to 2031.
- By integration level, stand-alone inverters accounted for 72.09% of the Electric Vehicle Power Inverter market in 2025; integrated e-Axles are set to grow at a 19.38% CAGR between 2026 and 2031.
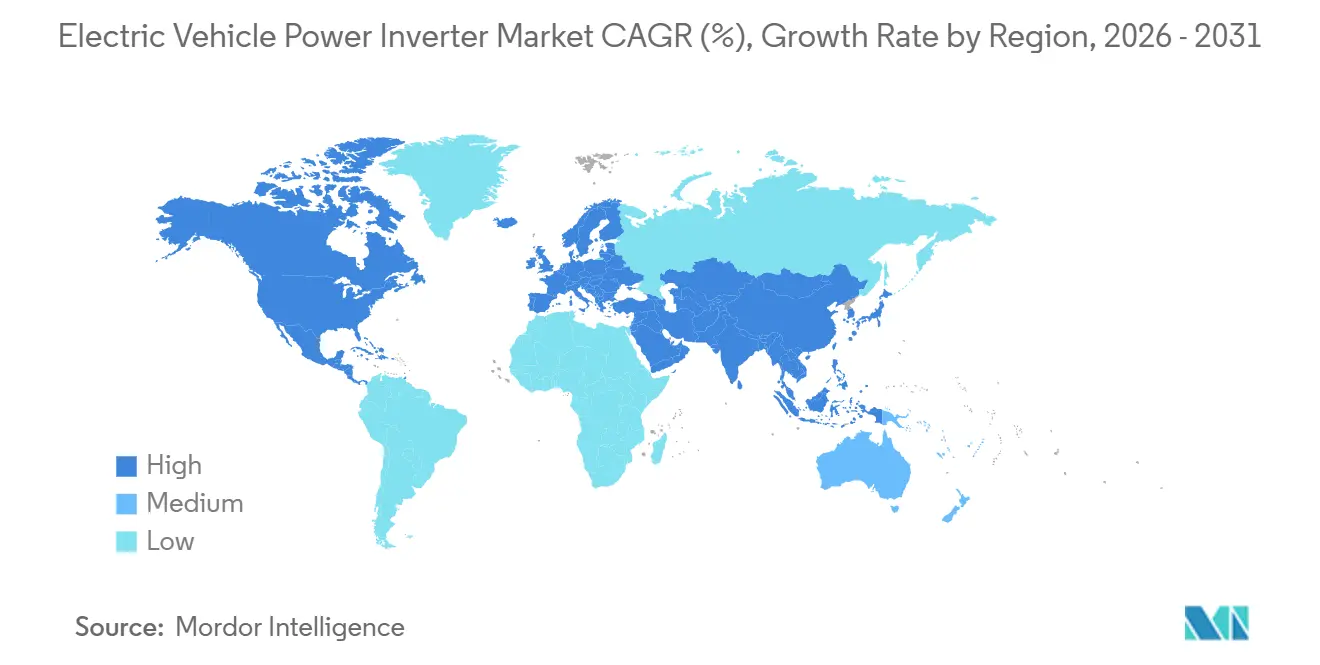
- By geography, Asia Pacific commanded 39.19% of the electric vehicle power inverter market share in 2025 and is poised for the fastest 19.36% CAGR during the forecast period (2026-2031).
Note: Market size and forecast figures in this report are generated using Mordor Intelligence’s proprietary estimation framework, updated with the latest available data and insights as of 2026.
Market Trends and Insights
Drivers Impact Analysis of Electric Vehicle Power Inverter Market*
| Driver | (~) % Impact on CAGR Forecast | Geographic Relevance | Impact Timeline |
|---|---|---|---|
| SiC & GaN Power Semiconductors | +4.2% | Global, led by North America, Europe, Asia Pacific | Medium term (2-4 years) |
| 800V Vehicle Platforms | +3.8% | Global, early adoption in Europe and China | Short term (≤ 2 years) |
| Demand for Electric Vehicles | +3.5% | Global, strongest in Asia Pacific and Europe | Long term (≥ 4 years) |
| Incentives & Emission Mandates | +3.0% | North America, Europe, China | Medium term (2-4 years) |
| Bidirectional V2G-Ready Architectures | +2.1% | Europe, North America, Japan | Long term (≥ 4 years) |
| Cost Reductions | +1.8% | Global, concentrated in Asia Pacific | Medium term (2-4 years) |
| Source: Mordor Intelligence | |||
Rapid Advances in SiC & GaN Power Semiconductors
Silicon-carbide MOSFETs and gallium-nitride HEMTs allow junction temperatures up to 175 °C, compared with 150 °C for silicon IGBTs, which reduces heat-sink mass and increases power density [1]. Wolfspeed’s USD 6.5 billion Mohawk Valley capacity build, and Infineon’s EUR 5 billion (~USD 6.5 billion) Dresden expansion illustrate how wafer supply is scaling to automotive volumes[2]. Gallium-nitride still skews toward onboard chargers, yet the mainstream inverter roadmap is firmly SiC, especially for ≥800-V platforms where switching-loss savings are multiplied. Legacy IGBTs hold share because their cost profile suits price-sensitive 400-V cars, but the efficiency delta widens each model year, accelerating the migration to wide-bandgap. Functional-safety validation under ISO 26262 adds up-front testing, but the long-term reliability data collected by early movers lowers the barrier for fast followers.
OEM Transition to 800-V Vehicle Platforms
Automakers adopt ≥800-V systems to halve DC-fast-charge times and trim copper harness mass by nearly one-third. Early showcases such as the Porsche Taycan and Hyundai Ioniq 5 proved the concept, and BMW’s Neue Klasse platform will bring high-voltage stacks into the premium-volume segment in 2027. Inverter designs must now withstand higher blocking voltages and faster dv/dt, a specification window that plays to suppliers with advanced package insulation and low-inductance layouts. Public chargers lag because most existing sites are 400 V, forcing dual-voltage compatibility that complicates inverter control loops. Even so, the performance narrative resonates with buyers, prompting OEMs to lock in 800-V supply contracts well before mass production kicks off.
Rising Demand for Electric Vehicles
Global EV registrations broke the 15 million threshold in 2025, anchored by policy levers, credit trading in China, zero-tailpipe mandates in Europe, and consumer tax credits in the United States. Fleet operators in delivery, ride-hailing, and public transit favor electric drivetrains once annual mileage exceeds 50,000 km because fuel and maintenance savings outweigh the purchase premium within 3 years. Each EV requires at least one traction inverter and sometimes a second unit for auxiliary compressors, meaning inverter shipments scale proportionally with vehicle sales. Tier-1 suppliers are therefore expanding local assembly near battery-cell gigafactories to align logistics and qualify for domestic-content incentives. As battery raw-material hedging becomes a board-level priority, secure inverter supply is now treated as equally strategic.
Government Incentives & Emission Mandates
The European Union’s Fit-for-55 legislation codifies a 100% reduction in passenger-car CO₂ emissions by 2035, effectively outlawing new internal-combustion sales. California’s Advanced Clean Cars II rule mirrors the deadline, and 17 United States states follow its lead, tightening the compliance window for global automakers. China’s dual-credit policy taxes ICE over-production while rewarding higher EV volumes, sustaining the domestic sales boom despite subsidy phase-downs. These synchronized mandates compress product-development cycles; automakers now lock in inverter technology choices at least five years before launch to avoid last-minute redesigns that jeopardize certification.
Restraints Impact Analysis of Electric Vehicle Power Inverter Market*
| Restraint | (~) % Impact on CAGR Forecast | Geographic Relevance | Impact Timeline |
|---|---|---|---|
| High Cost & Supply Volatility | -2.4% | Global, acute in North America and Europe | Short term (≤ 2 years) |
| Thermal-Management Complexity | -1.6% | Global, concentrated in heavy commercial segments | Medium term (2-4 years) |
| Charging-Infrastructure Bottlenecks | -1.2% | North America, Europe, emerging Asia Pacific | Medium term (2-4 years) |
| Cyber-Security Risk | -0.8% | Europe, North America, Japan | Long term (≥ 4 years) |
| Source: Mordor Intelligence | |||
High SiC Device Cost & Supply Volatility
Silicon-carbide wafers cost multiples of silicon, and capacity is concentrated among five foundries, leaving OEMs exposed to spot-price swings when demand spikes. Automotive qualification runs 18-24 months, so new fabs only ease shortages with a significant lag. Some automakers hedge by dual-sourcing SiC and legacy IGBT parts, trading efficiency for supply security. Export-control uncertainty adds further risk because crucible and crystal-growth tools come from a narrow supplier base. As a stopgap, several tier-1s hold strategic inventory, but carrying costs erode margin.
Thermal-Management Complexity ≥300 kW
Inverters above 300 kW face heat-flux densities that exceed the practical limits of conventional glycol cooling. SiC raises the allowable junction temperature, yet other package components, gate drivers, and capacitors still derate sharply under thermal cycling. Two-phase immersion solutions and direct-substrate bonding look promising, but automotive field data is scarce, pushing OEMs to stick with heavier, proven radiators that penalize vehicle range. Testing to ISO 16750 adds months to program timelines, pushing breakeven for experimental cooling methods further out.
*Our forecasts treat driver/restraint impacts as directional, not additive. The impact forecasts reflect baseline growth, mix effects, and variable interactions.
Electric Vehicle Power Inverter Market Segment Analysis
By Propulsion Type:
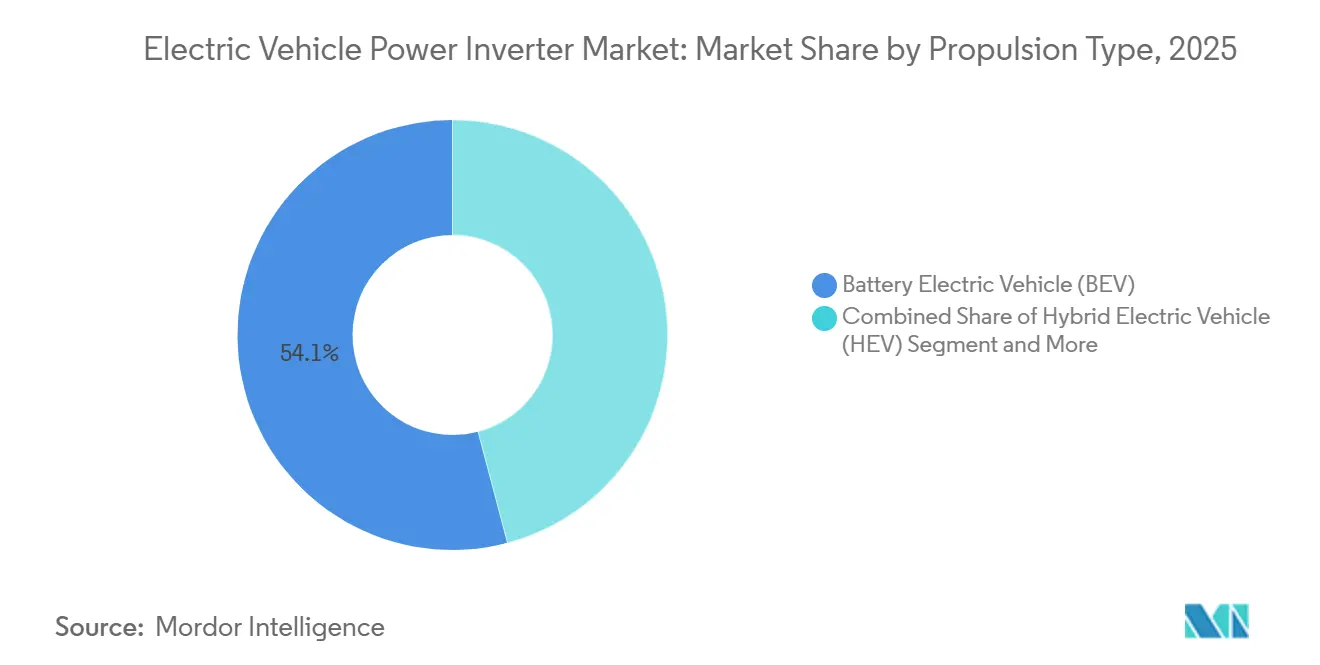
Fuel Cells Gain Traction in Heavy DutyBattery-electric cars retain 54.12% of the electric-vehicle power inverter market share in 2025, driven by dense charging networks in China and Europe. In contrast, plug-in hybrids serve as transitional solutions in regions where grid upgrades lag. Fuel-cell electric vehicles are projected to post the fastest 19.35% CAGR through 2031, as hydrogen corridors in Japan, South Korea, and parts of Europe reduce the risk of refueling infrastructure. Hybrid electrics without external charging contracts steadily because regulatory rules now credit zero tailpipe emissions rather than partial electrification.
Fuel-cell stacks output lower DC voltages than lithium-ion packs, so their inverters pair with step-down DC-DC converters and low-inductance busbars that manage rapid current rise when drivers demand torque. Continuous power delivery without battery-temperature limits favors long-haul buses and trucks where battery mass would otherwise exceed freight payload. Growth hinges on green-hydrogen cost trajectories and station density, both of which are trending positively as electrolyzer deployments piggyback on renewable overcapacity.

By Vehicle Type:
Commercial Fleets Drive Growth AccelerationPassenger cars commanded 63.91% of the electric vehicle power inverter market size in 2025, reflecting consumer uptake in the core auto markets, while heavy commercial vehicles and buses posted the strongest 19.42% CAGR as zero-emission zones lock diesel fleets out of cities. Light commercial vans also benefit from depot charging but are more price-sensitive, so adoption lags passenger cars until battery cost curves flatten.
Inverters for 40-ton trucks must handle continuous ratings above 300 kW and withstand vibration cycles far beyond those of passenger cars. Designs therefore emphasize reinforced busbars, redundant current sensors, and megawatt charging compatibility per CharIN’s specification. Passenger-car units focus on acoustic comfort and compact housings, while city-bus variants allow more envelope space in exchange for serviceability and thermal headroom.
By Voltage Architecture:
800-V Systems Redefine Charging EconomicsWhile ≤400-V architectures dominate the current installed base, capturing 68.54% of the electric vehicle power-inverter market share in 2025. ≥800-V platforms are gaining traction, growing at a 19.32% CAGR to 2031. These platforms can reduce DC fast-charge times to under 20 minutes, a duration consumers associate with the convenience of traditional refueling. As infrastructure continues to evolve, the market for electric vehicle power inverters for 800-V cars is set to surpass segment averages, with projections extending through 2031.
Higher voltage reduces system current, allowing automakers to trim copper content and slim down inverter busbars. However, insulation thickness and electromagnetic interference shielding rise, adding cost and engineering complexity. Dual-voltage onboard chargers bridge legacy 400-V stations, but weight and part-count penalties encourage a direct grid upgrade. Commercial fleets may leapfrog straight to megawatt-class chargers once standards settle, bypassing interim 400-V/800-V coexistence.
By Semiconductor Material:
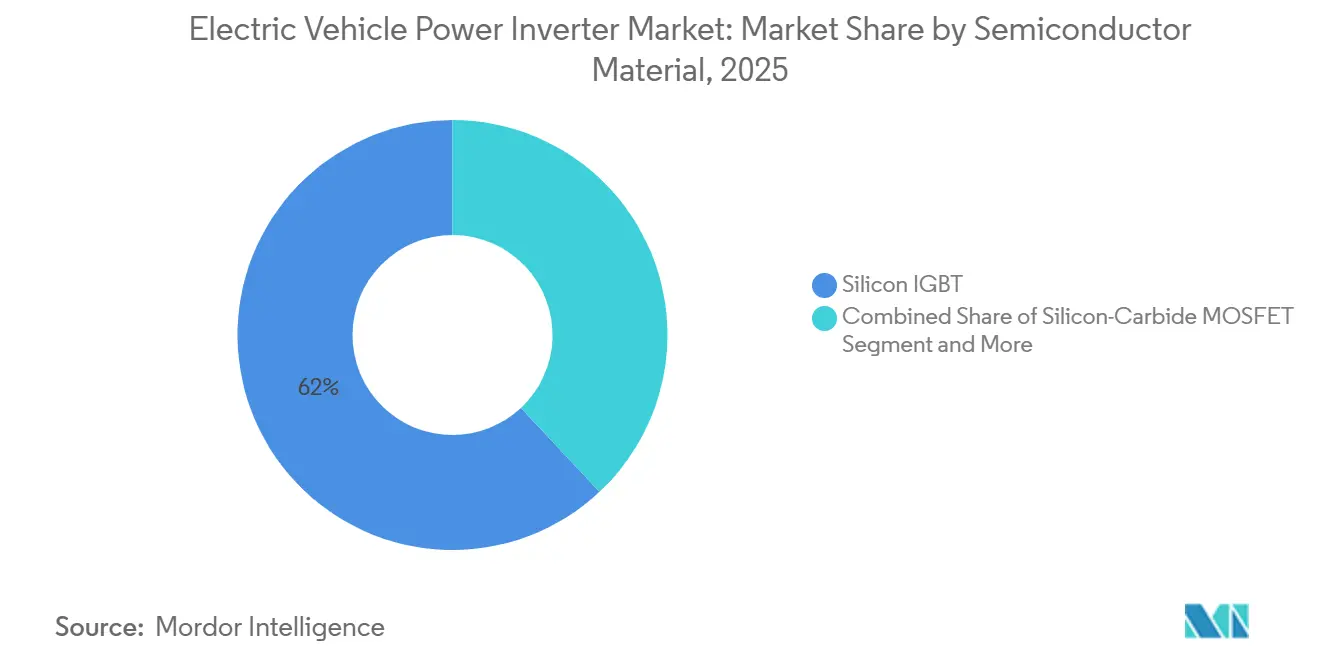
SiC Closes the Gap on Silicon IGBTSilicon IGBTs command a dominant 61.99% of the electric vehicle power inverter market share in 2025, underscoring the strength of established supply chains and amortized tooling. However, as wafer costs decline and automotive reliability data becomes more robust, the adoption of silicon-carbide MOSFETs is gaining momentum and is projected to grow at a CAGR of 19.34% through 2031. The savings from reduced switching losses are pushing SiC to the forefront for designs operating at ≥ 800 V. This is primarily because while paralleling IGBTs can help achieve efficiency targets, it negates any potential savings on the bill of materials.
Company roadmaps reinforce the trend: Wolfspeed, Infineon, and STMicroelectronics have all earmarked multi-billion-dollar expansions, and tier-1s like Bosch now integrate in-house SiC modules into third-generation inverter stacks. Regulatory standards apply uniformly across materials, but SiC’s greater thermal margin simplifies derating calculations inside functional-safety envelopes, giving it a non-cost advantage.
By Integration Level:
e-Axles Consolidate Powertrain FunctionsIn 2025, stand-alone inverters commanded a dominant 72.09% share of the electric vehicle power inverter market. These inverters cater to legacy hybrids and retrofits, as well as architectures where motor suppliers differ from gearbox vendors. Meanwhile, integrated e-Axles are set to experience the fastest growth, with a robust 19.38% CAGR. Their appeal lies in their ability to streamline design by eliminating redundant housings, connectors, and coolant loops. Furthermore, the market share of e-Axles in the electric vehicle power inverter landscape is bolstered by the advantages of automated assembly: integrating a combined unit into a skateboard chassis can significantly reduce line-side takt time by double digits.
While integration helps in managing thermal loads, it also prompts suppliers to innovate. They are now co-developing stator cooling jackets and inverter cold plates, allowing for shared fluid paths – a notable shift from traditional siloed component engineering. This evolving requirement favors companies with comprehensive powertrain capabilities. Industry giants like ZF, Bosch, and Valeo are at the forefront, while specialized inverter firms find themselves at a crossroads, needing partnerships to avoid being sidelined as mere component suppliers.
Geography Analysis
APAC Electric Vehicle Power Inverter Market
Asia Pacific held a 39.19% of the electric-vehicle power inverter market share in 2025 and is forecasted to expand at a 19.36% CAGR through 2031. China dominates the regional electric-vehicle power-inverter market owing to vertically integrated supply chains that span from SiC wafer growth to final vehicle assembly under one corporate umbrella. Japan leverages decades of power-electronics know-how, with Denso and Mitsubishi Electric holding preferred-supplier status within local OEM ecosystems. South Korea’s Hyundai Mobis partners with LG Energy Solution to roll out 800-V systems that rank among the highest-charging-speed models on sale.
Europe Electric Vehicle Power Inverter Market
Europe trails in absolute volume but benefits from tight carbon legislation that provides visibility into demand. German, French, and Scandinavian automakers localize inverter sourcing to meet domestic-content thresholds and de-risk long supply lines. Semiconductor fabs in Dresden and Catania receive public funding packages to ensure that SiC volumes remain within the single market once combustion bans take effect after 2035.
North America Electric Vehicle Power Inverter Market
North America’s growth rests on the Inflation Reduction Act, which ties a USD 7,500 consumer credit to final-assembly and mineral-origin rules that ripple through inverter sourcing. Wolfspeed’s North Carolina mega-fab and emerging tier-1 e-Axle plants in the Midwest bring critical stages stateside, but the rollout of charging infrastructure lags coastal adoption. The region’s suppliers, therefore, prioritize modular designs that support both 400-V legacy and 800-V next-gen vehicles to address a bifurcated market landscape.
Regulatory Landscape
Safety, interoperability, and grid-interconnection rules are increasingly shaping inverter architectures alongside tailpipe-emission mandates. In the United States, NHTSA finalized FMVSS No. 305a in December 2024 for electric-powered vehicle electric powertrain safety, tightening requirements around high-voltage safety performance. In parallel, UNECE Regulation No. 100 (Rev.3) continues to anchor high-voltage electrical safety expectations across markets that type-approve under the UNECE framework, reinforcing design and validation needs for traction inverters and associated high-voltage components.
Standards around bidirectional charging and communication are becoming more explicit, which is feeding into inverter control and cybersecurity requirements for V2G-ready platforms. SAE updated J3072 in June 2024 to define interconnection requirements for onboard grid-support inverter systems, and the EU is progressing requirements tied to EN ISO 15118, including EN ISO 15118-20:2022 becoming mandatory for certain charging points from 1 January 2027 under the AFIR-related compliance pathway. China also added a specific anchor for bidirectional capability via GB/T 46148-2025 (issued August 2025, implemented 1 March 2026), covering technical specifications for EV intelligent bi-directional power supply equipment, which accelerates compliance work for inverters and power-electronics modules supporting vehicle-to-grid and vehicle-to-home use cases.
Value Chain Analysis
The value chain spans wide-bandgap and silicon devices (SiC MOSFETs, silicon IGBTs, gate drivers), passive components (DC-link capacitors), substrates and packaging (DBC/AMB, baseplates, bonding and interconnects), inverter mechanicals and thermal systems (cold plates, housings), embedded control software, and final integration into stand-alone inverters or integrated e-axles. Upstream constraints remain most acute in SiC substrate and epitaxy, where crystal-growth capacity is a bottleneck and demand competes with other end markets such as energy storage and solar. Cost structure also concentrates risk: SiC modules can represent roughly 30-50% of a traction inverter bill of materials, pushing OEMs and Tier-1s toward tighter semiconductor sourcing strategies and qualification planning.
Downstream, Tier-1 suppliers (for example, Bosch, Denso, Mitsubishi Electric, Continental/Vitesco, and BorgWarner) design and industrialize inverter systems, while OEMs increasingly influence device selection and supply assurance for SiC, sometimes shifting procurement to direct OEM-to-semiconductor-supplier agreements or consignment models to manage volatility. Regionalization also reshapes flows, with China leveraging vertically integrated ecosystems and localization to shorten supply lines, while Europe and North America emphasize local assembly near vehicle and battery plants to align with domestic-content incentive structures. Integration trends toward e-axles and multi-function power electronics (inverter plus charging and DC/DC functions) increase coordination across mechanical, thermal, and software nodes, raising the importance of packaging standardization, functional-safety evidence (ISO 26262), and interoperable communication (ISO 15118) during validation.
Competitive Landscape
The electric vehicle power inverter market shows a medium level of concentration. Major players like Mitsubishi Electric, Vitesco Technologies, Valeo, Toyota Industries, and Denso are fortifying their market positions by integrating silicon-carbide capabilities into their long-term supply strategies. Meanwhile, Wolfspeed's partnership with ZF, through a wafer agreement, guarantees its foundry output until 2030. Vitesco is also making moves, expanding its Tianjin line to support Chinese OEM initiatives.
Vertical integration is reshaping the landscape. BYD's comprehensive wafer-to-vehicle approach gives it pricing flexibility, while Bosch is proactively establishing its own SiC lines to mitigate potential shortages. Start-ups focused on bidirectional V2G inverters are securing pilot contracts but struggle to scale due to capital constraints, positioning them as prime acquisition targets as industry standards become more defined. Key areas of strategic emphasis include high-switching-frequency gate drivers, substrates with low thermal resistance, and firmware modules that prioritize cybersecurity, all while adhering to ISO 26262 and ISO 15118 standards.
Geographic localization emerges as another critical arena. European firms collaborate with local fabs to navigate rules-of-origin mandates. In contrast, U.S. suppliers are validating designs in Canada and Mexico, a move aimed at countering potential policy shifts. Incumbents in the Asia Pacific, riding the wave of state incentives, are quick to capitalize on pricing but are increasingly challenged by IP enforcement, especially as Western OEMs tighten their grip on contractual terms such as software escrow and data rights.
Electric Vehicle Power Inverter Industry Leaders
-
Mitsubishi Electric Corporation
-
Tesla, Inc.
-
Toyota Industries Corporation
-
Valeo SA
-
DENSO Corporation
- *Disclaimer: Major Players sorted in no particular order
Electric Vehicle Power Inverter Market Companies Covered in this Report
- Robert Bosch GmbH
- DENSO Corporation
- Toyota Industries Corporation
- Hitachi Astemo Ltd
- Meidensha Corporation
- BorgWarner Inc.
- Mitsubishi Electric Corp.
- Tesla Inc.
- Marelli Holdings
- Valeo SA
- Lear Corporation
- Infineon Technologies AG
- Eaton Corporation
- STMicroelectronics N.V.
- ON Semiconductor Corp.
- Wolfspeed Inc.
- ROHM Semiconductor
- Continental AG
- ZF Friedrichshafen AG
- Dana Incorporated
Market Opportunities and Future Outlook
Whitespace is forming around higher-voltage and bidirectional-ready power electronics, where inverter design has to handle faster switching, insulation and EMI constraints, and multi-standard communication and grid interconnection. Policy and standards anchors make this concrete: SAE J3072 (June 2024) and China GB/T 46148-2025 (implemented 1 March 2026) formalize requirements for grid-support and intelligent bidirectional power supply equipment, while EU requirements tied to EN ISO 15118-20:2022 become mandatory for certain charging points from 1 January 2027. These developments favor suppliers that can deliver validated inverter firmware, isolation monitoring, and protection strategies aligned with both automotive functional safety and grid-interaction expectations, especially as V2G pilots move from demonstration toward hardware verification by established component makers.
Capacity localization and next-generation SiC module performance are also creating slots across regions and vehicle classes as platforms move beyond 400 V. In Europe, Valeo began operations at new high-voltage production lines in Etaples, France (April 2026), with production scheduled to start in 2026 for vehicles entering the market in 2027, while Infineon opened its EUR 5 billion Smart Power Fab in Dresden (July 2026) to expand 300 mm power semiconductor capacity. On the product side, Infineon introduced a 1300 V HybridPACK Drive SiC module (May 2026) designed for EV battery systems above 900 V, pointing to higher blocking-voltage headroom for 800 V to >900 V architectures. In India, Uno Minda announced a greenfield investment of INR 550 crore for a facility in Maharashtra focused on high-voltage EV powertrain systems including inverters (May 2026) and received Ministry of Heavy Industries approval tied to Inovance Automotive (HK) investment in an inverter-capable high-voltage powertrain subsidiary (June 2026), highlighting another geography where localized inverter and e-drive manufacturing capacity is being expanded.
Recent Industry Developments in Electric Vehicle Power Inverter Market
- June 2026: Mitsubishi Electric announced the start of shipments for fifth-generation SiC-MOSFET bare die samples targeted at xEV inverter applications. The samples support automotive qualification work and shorten iteration cycles for higher-efficiency, higher-power-density traction inverter designs using wide-bandgap devices.
- November 2025: Toyota Industries announced successful hardware verification of vehicle-to-grid operation using its bidirectional on-board charger to supply AC power from an EV to the grid. The milestone supports OEM and utility pilots that require validated bidirectional power conversion and controls, which raises requirements on inverter and power-electronics integration for grid-interactive EV platforms.
- May 2024: Mitsubishi Electric announced developments in SiC power semiconductor technology aimed at improving power conversion efficiency for electrified mobility and other applications. The work reinforces the industry shift toward SiC device roadmaps that enable smaller cooling systems and higher switching performance in traction inverters.
Electric Vehicle Power Inverter Market Report Scope and Research Methodology
Market Definition and Coverage
This market covers power inverters used in electric vehicles to convert high-voltage DC from the battery into AC required by the traction motor and related drive functions. We size the market in value terms based on shipments and typical pricing for inverters supplied into new vehicle production.
Scope exclusions: Excludes standalone charging equipment and off-vehicle power conversion hardware that is not installed as part of the vehicle powertrain.
Segments Covered in This Report
- By Propulsion Type
- Hybrid Electric Vehicle (HEV)
- Plug-in Hybrid Electric Vehicle (PHEV)
- Battery Electric Vehicle (BEV)
- Fuel Cell Electric Vehicle (FCEV)
- By Vehicle Type
- Passenger Cars
- Light Commercial Vehicles
- Heavy Commercial Vehicles & Buses
- By Voltage Architecture
- Less than or equal to 400 V Systems
- 401–799 V Systems
- More than or equal to 800 V Systems
- By Semiconductor Material
- Silicon IGBT
- Silicon-Carbide MOSFET
- Gallium-Nitride HEMT
- By Integration Level
- Stand-alone Inverter
- Integrated e-Axle (Motor + Inverter + Gearbox)
- Combined Inverter + DC/DC (CIDD)
- By Geography
- North America
- United States
- Canada
- Rest of North America
- South America
- Brazil
- Argentina
- Rest of South America
- Europe
- Germany
- United Kingdom
- France
- Italy
- Spain
- Russia
- Rest of Europe
- Asia Pacific
- China
- Japan
- India
- South Korea
- Rest of Asia Pacific
- Middle East and Africa
- Saudi Arabia
- United Arab Emirates
- Turkey
- South Africa
- Egypt
- Nigeria
- Rest of Middle East and Africa
- North America
Data Sources, Market Sizing, and Validation
Desk Research
Desk research is used to set the market context and anchor key model inputs to observable EV activity. We rely on public EV production and sales signals, trade indicators, and policy timelines that influence electrification pace and voltage platform adoption. Illustrative sources include government transport and energy statistics, customs trade data portals, standards and regulatory publications, and peer-reviewed power electronics journals, which help confirm shifts such as silicon-carbide penetration.
We also review company annual reports, investor presentations, and OEM supplier announcements to understand inverter integration trends such as stand-alone units, e-axle integration, and combined inverter with adjacent power electronics. For pricing and mix logic, we cross-check against a paid subscription focused on company financials and intelligence and a patent database to validate the maturity of materials and packaging approaches. These examples are not exhaustive, and many other public references were consulted for data collection, validation, and research clarification.
Primary Interviews and Surveys
Primary work focuses on validating shipment assumptions, voltage architecture mix, and inverter material transitions across passenger and commercial EV platforms. We speak with component suppliers and vehicle program stakeholders, plus channel participants, across APAC, EMEA, and the Americas. This helps close gaps from desk research and then checks the model against real design and buying patterns.
Distribution of primary research fieldwork respondents
| Company type | Respondent position | Region |
|---|---|---|
| Top tier: 37% | CXOs: 20% | APAC: 39% |
| Mid tier: 43% | Functional/Unit leaders: 35% | EMEA: 34% |
| Smaller Players: 20% | Managers: 45% | Americas: 27% |
Market-Sizing & Forecasting
Sizing starts with a top-down demand pool build that reconstructs inverter value from EV production by propulsion type (HEV, PHEV, BEV, and FCEV) and by vehicle type across key regions. That demand pool is then split by voltage class (up to 400V, 401V to 799V, and 800V and above) and semiconductor material (silicon IGBT, silicon-carbide MOSFET, and gallium-nitride HEMT), since these directly influence content value and pricing. Once the mix is built, pricing is applied using observed ranges and primary feedback, and the totals are rolled up into the global value.
To keep the totals realistic, we corroborate the outcome with selective bottom-up approximations such as sampled ASP times estimated unit shipments for high-volume platforms, supplier-side shipment checks, and channel conversations on integrated e-axle uptake. Where direct shipment visibility is limited for smaller programs, gaps are handled through proxy ratios tied to vehicle output and expected inverter content per vehicle, and the assumptions are re-tested during interviews. For forecasting, scenario analysis is used around EV penetration, 800V platform adoption, and material transition speed, and then the final curve is aligned to what experts view as achievable for capacity, qualification cycles, and cost-down timing.
Data Validation & Update Cycle
Validation is done through multiple checks that compare model outputs with independent signals such as EV production trends, trade flow direction, and the implied inverter value per vehicle by region and propulsion type. If a country or segment shows a sharp jump that is not supported by policy, vehicle mix, or pricing movement, the inputs are reviewed and the outliers are corrected before sign-off.
We run a multi-step analyst review where assumptions, calculations, and unit conversions are checked, followed by a final consistency pass against technology adoption timing like SiC penetration and integrated inverter architectures. Reports are refreshed annually, and interim updates are triggered when material events occur, such as regulatory changes or meaningful shifts in EV platform voltage. Before delivery, a fresh review is completed so clients receive the latest updated view.
Mordor Intelligence's Electric Vehicle Power Inverter Market Estimate Compared With Other Published Estimates
Published market values for EV power inverters can differ because the market is not always defined in the same way, and the assumed EV mix and pricing path can move totals up or down quickly. Differences also come from the base year chosen and how fast the model is updated when new platform launches and material shifts show up.
On-board chargers and off-vehicle charging hardware sit outside Mordor Intelligence scope here, which helps explain why some published values look higher when adjacent power conversion content is bundled into one number. A second common gap driver is the value per vehicle assumption, where some studies apply a uniform inverter price, and others reflect the premium for 800V architectures, SiC adoption, and integrated e-axle designs that change the bill of materials and average selling price progression.
Benchmark comparison
| Source | Market Size | Gaps in Research Methodology |
|---|---|---|
| Mordor Intelligence | USD 10.67 B (2026) | |
| Global Research Publisher A | USD 7.38 B (2024) | Uses an earlier base year and a shorter forecast window, and the average inverter value per vehicle can trend lower if 800V and SiC mix are not expanded fast across regions and vehicle types. |
| Industry Publisher B | USD 26.67 B (2024) | Appears to apply a broader content definition that can inflate totals by bundling additional power electronics around the inverter, and it may assume a different integration mix and pricing curve across passenger and commercial EVs. |
The spread across the table is mainly explained by what is counted as inverter content, the base year used, and how the price and technology mix are carried forward. By tying the value build to vehicle output, voltage architecture mix, and material transitions, our estimate stays traceable to clear inputs that can be rechecked and updated in a repeatable way as the market shifts.
Key Questions Answered in the Report
What CAGR is forecast for global inverter demand between 2026 and 2031?
The Electric Vehicle Power Inverter market is projected to log an 18.95% CAGR over the 2026–2031 interval.
Which voltage architecture is growing the fastest?
Platforms rated at or above 800 V show the highest growth outlook as automakers chase quicker charging and reduced copper mass.
Why are silicon-carbide devices important for next-gen inverters?
SiC MOSFETs cut switching losses and tolerate higher temperatures, enabling lighter, more efficient inverter designs for 800-V systems.
How does the Inflation Reduction Act influence U.S. inverter production?
The Act links consumer tax credits to domestic content, prompting suppliers to localize wafer fabrication and module assembly in North America.
What segment leads future growth by vehicle type?
Heavy commercial vehicles and buses are expected to post the fastest growth, driven by urban zero-emission mandates and fleet economics.