
| Study Period | 2017 - 2029 |
| Base Year For Estimation | 2024 |
| Forecast Data Period | 2025 - 2029 |
| Market Size (2025) | USD 1.46 Trillion |
| Market Size (2029) | USD 2.73 Trillion |
| CAGR (2025 - 2029) | 16.90 % |
| Market Concentration | Low |
Major Players*Disclaimer: Major Players sorted in no particular order |


Electric Vehicles Market Analysis
The Electric Vehicles Market size is estimated at 1.46 trillion USD in 2025, and is expected to reach 2.73 trillion USD by 2029, growing at a CAGR of 16.90% during the forecast period (2025-2029).
The global electric vehicle industry is undergoing a transformative phase, characterized by aggressive government initiatives and shifting consumer preferences toward sustainable transportation solutions. Several nations have established ambitious targets to phase out conventional vehicles, with China, India, France, and the United Kingdom announcing plans to eliminate petrol and diesel vehicle sectors by 2040. This transition is further supported by comprehensive government incentive programs, exemplified by France's May 2023 introduction of a EUR 5,000 subsidy for electric vehicles priced under EUR 47,000. The collective impact of these initiatives has been substantial, with the industry witnessing a remarkable 758.44% increase in global demand during the historic period.
The manufacturing landscape is experiencing significant restructuring as Original Equipment Manufacturers (OEMs) adapt their strategies to meet evolving market demands. Traditional automakers are rapidly expanding their electric vehicle portfolios while new entrants are challenging established players with innovative offerings. This competitive dynamic is particularly evident in the passenger vehicle segment, which currently accounts for 67% of total EV sales, driven by broader model availability and competitive pricing strategies. The industry is witnessing unprecedented collaboration between automotive manufacturers, technology providers, and infrastructure developers to create integrated mobility solutions, contributing to the growth of the electric vehicle market.
The technological evolution within the electric vehicle sector extends beyond vehicle manufacturing to encompass the entire mobility ecosystem. Manufacturers are investing heavily in research and development to enhance battery technology, improve charging capabilities, and develop advanced driver assistance systems. The industry is witnessing a surge in innovation across various vehicle categories, from compact urban vehicles to commercial transport solutions. For instance, Ford's commitment to launch four new electric commercial vehicles by 2024, including the Transit Custom one-ton van and Tourneo Custom multi-purpose vehicle, demonstrates the expanding scope of electrification across vehicle segments, aligning with trends in the electric vehicle industry.
Market dynamics are increasingly influenced by evolving consumer preferences and the growing acceptance of electric mobility solutions. The industry has responded with a broader range of vehicle options, improved performance capabilities, and enhanced user experiences. This is evidenced by strategic moves such as Kia Motors' 2022 announcement to enter the electric pickup truck segment with two models planned for release by 2027, directly competing with established players in the market. The convergence of digital technologies with electric mobility has created new opportunities for innovation in vehicle design, user interface, and connected services, fundamentally transforming the automotive landscape and impacting the forecast for the electric vehicle market.
Global Electric Vehicles Market Trends
The rising global demand and government support propel electric vehicle market growth
- Electric vehicles (EVs) have become indispensable in the automotive industry, driven by their potential to enhance energy efficiency and reduce greenhouse gas and pollution emissions. This surge is primarily attributed to growing environmental concerns and supportive government initiatives. Notably, global EV sales witnessed a robust 10.82% growth in 2022 compared to 2021. Projections indicate that annual sales of electric passenger cars will surpass 5 million by the end of 2025, accounting for approximately 15% of total vehicle sales.
- Leading manufacturers and organizations, like the London Metropolitan Police & Fire Service, have been actively pursuing their electric mobility strategies. For instance, they have set a target of a zero-emission fleet by 2025, with a goal of electrifying 40% of their vans by 2030 and achieving full electrification by 2040. Similar trends are expected globally, with the period from 2024 to 2030 witnessing a surge in demand and sales of electric vehicles.
- Asia-Pacific and Europe are poised to dominate electric vehicle production, driven by their advancements in battery technology and vehicle electrification. In May 2020, Kia Motors Europe unveiled its "Plan S," signaling a strategic shift toward electrification. This decision came on the heels of record-breaking sales of Kia's EVs in Europe. Kia has ambitious plans to introduce 11 EV models globally by 2025, spanning various segments like passenger vehicles, SUVs, and MPVs. The company aims to achieve annual global EV sales of 500,000 by 2026.

Understand The Key Trends Shaping This Market
Download PDF
OTHER KEY INDUSTRY TRENDS COVERED IN THE REPORT
- Africa's demographic evolution demonstrates consistent growth with a notable acceleration in recent years
- Several European countries are facing population declines, while others are growing, indicating a need for targeted policy interventions
- North America's demographic story highlights steady growth and adaptability, with each nation contributing uniquely to the region's vibrant mosaic, underlining its continued global significance
- Despite a GDP per capita decline in 2022-2023, Africa shows potential for future economic stability through trade agreements and infrastructure development
- Europe's GDP per capita is on track for steady growth, reflecting resilience and strategic policies
- Despite challenges in 2020, by 2023, the US experienced growth, Mexico displayed a robust recovery, while Canada witnessed a dip
- South Africa's consumer vehicle population shows signs of stabilization
- European countries are experiencing growth in CVP, driven by government incentives for eco-friendly vehicles
- North America exhibits diverse trends in CVP, with Canada experiencing a slight decrease, the US seeing an increase, and Mexico showing significant growth
- South Africa, Kenya, and Morocco exhibit declining inflation rates, while Nigeria faces a sharp inflation increase
- Europe is poised for economic stability, with concerted efforts to manage inflation and foster a balanced economic landscape
- From 2017 to 2023, North America, particularly countries like the US and Canada, navigated inflationary spikes, especially post-pandemic in 2022
- Auto interest rates across Africa, Asia-Pacific, and North America showed significant regional diversity, influenced by a combination of economic policies, market dynamics, and global conditions
- Global efforts to expand and enhance EV infrastructure are signaling a collective push toward electrification
- The demand for EVs in Asia-Pacific is fueled by falling battery prices
- The Middle East's battery market: A continuous descent in prices and promising energy trends
- South America’s surging demand for electric vehicle batteries: falling costs and strategic alliances
- The used car sales segment in Asia-Pacific is poised for growth, with China and India leading the expansion, reflecting strong economic signals and shifting consumer demands toward vehicle ownership
- The auto industry's production landscape is witnessing a dramatic shift, with electric vehicle manufacturers like BYD Auto and Tesla seeing remarkable growth while traditional giants like GM adapt to changing market demands
- Countries like Australia, India, and Indonesia project a steady upward trajectory in GDP per capita, suggesting robust economic strategies and potential investment in the automotive industries
- Saudi Arabia and UAE, both pivotal nations in the Middle East, demonstrated population growth from 2017 to 2023. While there were slight dips for both countries in between, the overarching upward trend indicates their significant roles and attractions in the region
- South America's demographic narrative, represented by Brazil and Colombia, showcases a story of consistent growth, with Brazil experiencing a pronounced surge
- Asia-Pacific displays a panorama of economic evolution: from the relentless pursuits of emerging economies to the recalibrations of established ones, painting a picture of resilience, adaptation, and ambition
- Projections for the coming years indicate a steady growth trajectory for both the UAE's diversified sectors and its role as a regional business hub. This growth can be attributed to the country's focus on diversification efforts and strategic partnerships
- During 2017-2030, Brazil and Colombia displayed contrasting economic paths. While both faced downturns around 2020, Brazil's GDP per capita showed recovery by 2023, whereas Colombia witnessed a slight decline
- The Asia-Pacific's diverse consumer spending trends on vehicle purchases not only reflect the region's evolving economic conditions but also highlight the shifting consumer preferences and vehicular market dynamics across countries
- In the short term (2022-2023), Saudi Arabia maintained stable consumer spending for vehicle purchases, while the UAE experienced a slight decline, suggesting differing market dynamics
- Brazil and Colombia are expected to see an increase in consumer spending for vehicle purchases (CVP), indicating a recovering automotive market and growing consumer confidence
- Asia-Pacific’s varied inflation rates reflect the diverse economic challenges and responses of each nation, from battling pandemic-induced fluctuations to aiming for future stability through strategic economic policies
- From 2017 to 2030, the Middle East is expected to display varied inflationary patterns, with countries like Iran facing significant challenges, while others like Saudi Arabia and the UAE expected to show stability
- Projections indicate a trend toward economic stabilization and controlled inflation in the region, highlighting a concerted push to restore equilibrium and foster growth
- The global MaaS market is growing significantly growth trajectory, indicating sustained expansion across all regions
- Battery pack prices in Africa continued to decline from USD 186 in 2022 to USD 176 in 2023, driven by technological advancements and increased market competition
- Declining battery prices and government initiatives drive demand for electric vehicles in Europe
- Declining prices of lithium-ion batteries drive the demand for electric vehicles in North America
- The global automotive industry will undergo a transformative phase, with a pronounced shift toward electrification from 2023 to 2025, followed by a period of refinement and consolidation in the subsequent years
- For over a year, Russia's invasion of Ukraine disrupted global crude oil and petroleum product markets
Segment Analysis: Vehicle Type
Passenger Vehicles Segment in Electric Vehicles Market
The passenger vehicles segment dominates the global electric vehicle market segmentation, commanding approximately 62% market share in 2024. This substantial market position is driven by increasing consumer awareness about environmental sustainability, expanding charging infrastructure, and a wider range of affordable electric vehicle options across various price points. Major automotive manufacturers have significantly expanded their electric passenger vehicle portfolios, offering everything from compact cars to luxury SUVs, catering to diverse consumer preferences. The segment's growth is further supported by government incentives, tax benefits, and subsidies specifically targeted at personal electric vehicle adoption, making them more accessible to a broader consumer base.
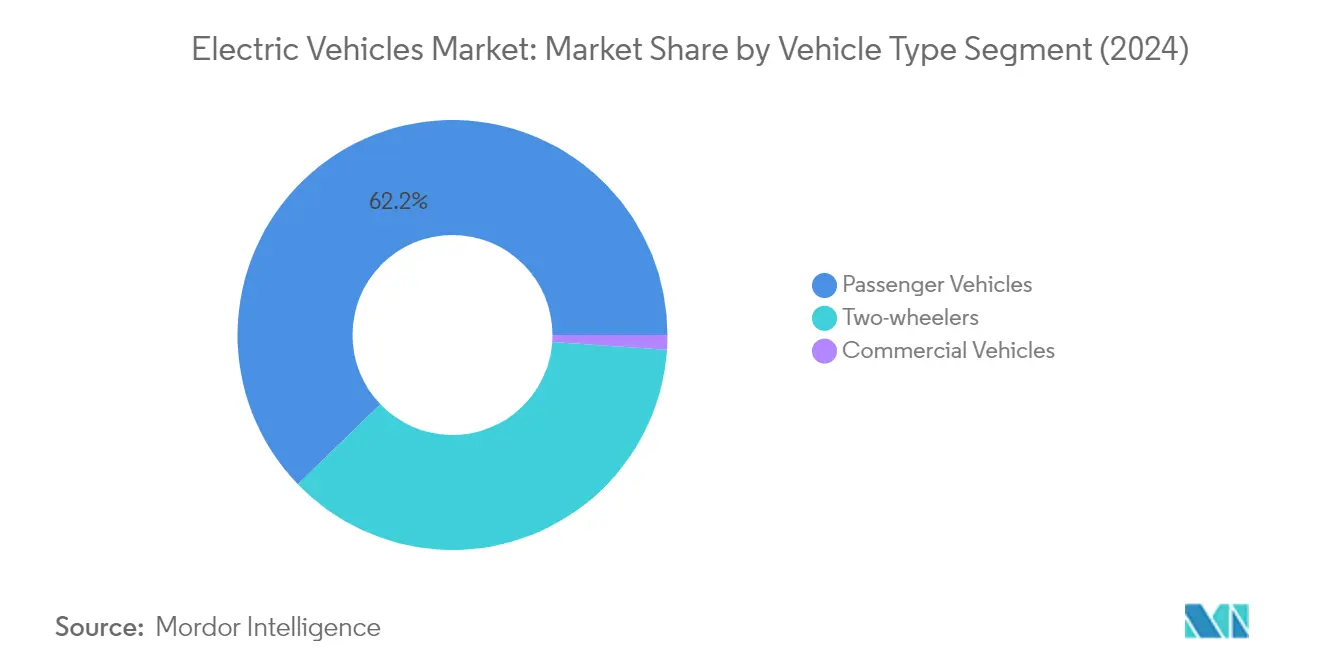
Two-wheelers Segment in Electric Vehicles Market
The two-wheelers segment is emerging as the fastest-growing category in the electric vehicle segment, demonstrating remarkable growth potential from 2024 to 2029. This exceptional growth is driven by increasing urbanization, rising demand for cost-effective transportation solutions, and growing environmental consciousness among consumers. The segment's expansion is particularly notable in Asia-Pacific regions, where two-wheelers serve as primary transportation modes. Manufacturers are introducing innovative features, improved battery technology, and enhanced range capabilities, making electric two-wheelers increasingly attractive to consumers. The segment also benefits from lower initial purchase costs compared to electric cars, minimal charging infrastructure requirements, and reduced operating expenses.
Remaining Segments in Vehicle Type
The commercial vehicles segment, encompassing both heavy-duty and medium-duty trucks, plays a crucial role in the electric vehicles market's evolution. This segment is particularly significant in the context of urban logistics, last-mile delivery, and industrial transportation applications. The transition to electric commercial vehicles is being driven by corporate sustainability goals, government regulations on commercial fleet emissions, and the long-term cost benefits of electric powertrains. Heavy-duty trucks are finding increasing adoption in long-haul transportation, while medium-duty trucks are becoming popular in urban delivery and regional distribution networks.
Segment Analysis: Fuel Category
BEV Segment in Electric Vehicles Market
Battery Electric Vehicles (BEVs) continue to dominate the global electric vehicles market, commanding approximately 66% market share in 2024. This significant market position can be attributed to several factors, including technological advancements in battery technology leading to longer ranges and shorter charging times, extensive government support through subsidies and incentives, and growing consumer awareness about environmental benefits. The segment's growth is further bolstered by major automakers' commitments to expanding their BEV portfolios and substantial investments in charging infrastructure development worldwide. Additionally, decreasing battery costs and improving energy density have made BEVs increasingly competitive with conventional vehicles, while the expanding charging network has helped address range anxiety concerns among consumers.
FCEV Segment in Electric Vehicles Market
The Fuel Cell Electric Vehicle (FCEV) segment is emerging as the fastest-growing category in the electric vehicles market, with an expected growth rate of approximately 32% from 2024 to 2029. This remarkable growth trajectory is driven by significant advancements in hydrogen fuel cell technology, increasing investments in hydrogen infrastructure, and growing recognition of FCEVs' advantages in long-distance transportation and heavy-duty applications. The segment's expansion is supported by strategic collaborations between automotive manufacturers and energy companies to develop and commercialize hydrogen technology. Furthermore, government initiatives promoting hydrogen infrastructure development and zero-emission transportation solutions are creating favorable conditions for FCEV adoption, particularly in regions with established hydrogen production capabilities.
Remaining Segments in Fuel Category
The Hybrid Electric Vehicle (HEV) and Plug-in Hybrid Electric Vehicle (PHEV) segments continue to play crucial roles in the electric vehicles market, serving as important transition technologies between conventional and fully electric vehicles. HEVs offer improved fuel efficiency and reduced emissions without the need for external charging infrastructure, making them particularly attractive in regions with limited charging networks. Meanwhile, PHEVs provide the flexibility of both electric and conventional driving modes, addressing range anxiety while offering significant environmental benefits. These segments are particularly popular among consumers seeking to reduce their environmental impact while maintaining the convenience and familiarity of traditional vehicles.
Electric Vehicles Market Geography Segment Analysis
Electric Vehicles Market in Africa
The African electric vehicle market demonstrates significant potential for growth, driven by increasing environmental consciousness and supportive government initiatives. The region is witnessing a transformation in its automotive landscape, with several countries implementing policies to promote electric vehicle adoption. South Africa leads the continent's EV transition, with robust infrastructure development and strategic partnerships with global automotive manufacturers. Countries like Morocco and Egypt are following suit, establishing frameworks for EV manufacturing and charging infrastructure. The market is characterized by growing urban mobility needs, rising fuel costs, and increasing awareness of sustainable transportation solutions. Private sector investments in charging infrastructure and battery technology are accelerating market development. Additionally, the emergence of local assembly plants and manufacturing facilities is strengthening the regional supply chain, while government incentives and tax benefits are making EVs more accessible to consumers.
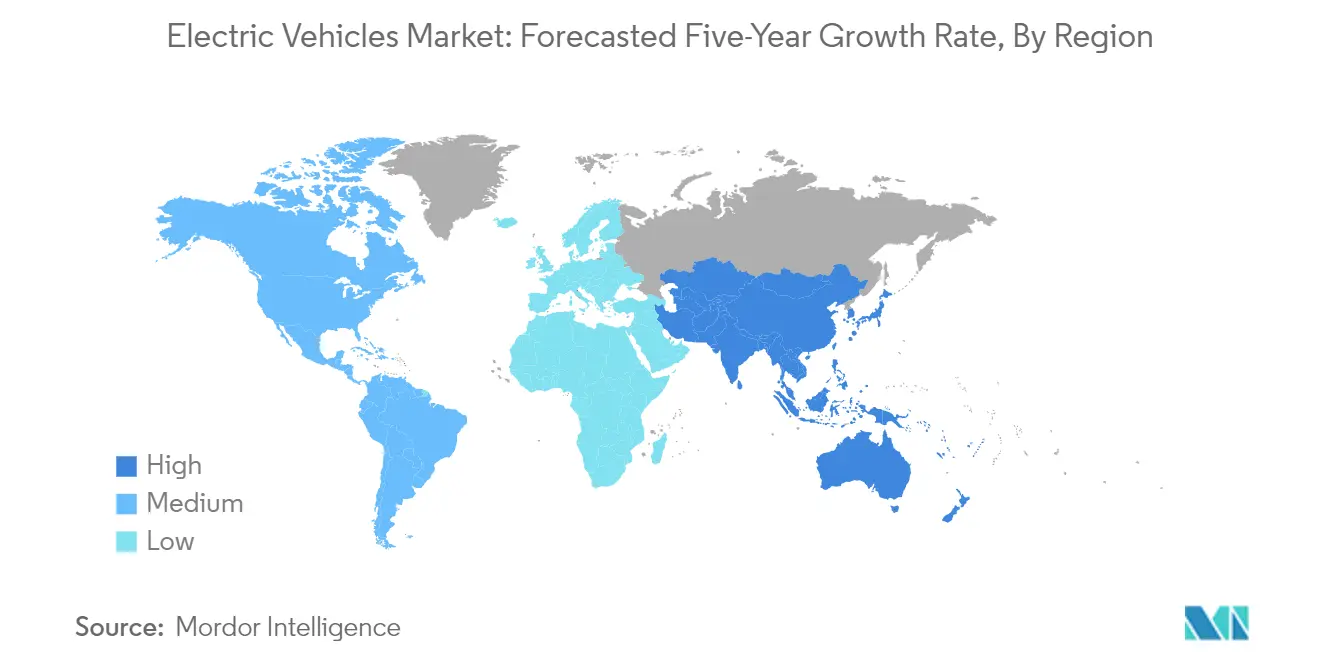
Electric Vehicles Market in Asia-Pacific
The Asia-Pacific electric vehicle market has demonstrated remarkable momentum, achieving approximately 800% growth from 2019 to 2024. This region, spearheaded by China's dominant market position, has emerged as a global powerhouse in EV manufacturing and adoption. The market's robust growth is underpinned by comprehensive government support mechanisms, including substantial subsidies and infrastructure development initiatives. Advanced battery technology development and local manufacturing capabilities have created a strong industrial ecosystem. The region benefits from extensive charging infrastructure networks, particularly in urban centers, while domestic manufacturers continue to expand their product portfolios. Consumer preferences are increasingly shifting toward electric mobility, driven by environmental concerns and favorable total cost of ownership. The market also sees significant innovation in battery technology and charging solutions, with several countries establishing themselves as key exporters of electric vehicles and components.
Electric Vehicles Market in Europe
The European electric vehicle market is projected to experience substantial expansion, with an anticipated growth of approximately 106% from 2024 to 2029. The region's commitment to sustainability and stringent emission regulations continues to drive market development. European automakers are rapidly transitioning their production lines to accommodate electric vehicle manufacturing, while governments across the continent are implementing comprehensive incentive programs. The market benefits from advanced charging infrastructure, with extensive networks covering both urban and interstate routes. Consumer acceptance of electric vehicles is particularly strong, supported by high environmental consciousness and favorable policy frameworks. The region's focus on renewable energy integration with EV charging networks creates a sustainable ecosystem. Innovation in vehicle design and technology remains a key characteristic of the European market, with manufacturers competing to deliver advanced features and improved range capabilities.
Get Analysis on Important Geographic Markets
Download PDF
Electric Vehicles Industry Overview
Top Companies in Electric Vehicles Market
The electric vehicle market is characterized by intense competition and rapid innovation among major players like Tesla, Toyota, Ford, Volkswagen, and BYD. Companies are heavily investing in research and development to advance battery technology, enhance driving range, and improve charging capabilities. Strategic partnerships and collaborations have become increasingly common, particularly in developing charging infrastructure and sharing technology platforms. Manufacturers are expanding their production facilities globally while simultaneously focusing on localizing their supply chains to reduce dependencies. Product portfolios are being diversified across various segments, from compact cars to luxury vehicles, to capture different market segments. The industry is witnessing a significant push toward autonomous driving capabilities and connected vehicle technologies, with companies integrating advanced software solutions and artificial intelligence into their offerings. Leaders in the electric vehicle market like Tesla and BYD are setting benchmarks in innovation and sustainability.
Market Dominated by Established Global Players
The electric vehicle market exhibits a moderately consolidated structure, with established global automotive conglomerates holding significant market share. These major players leverage their extensive manufacturing capabilities, established distribution networks, and strong brand recognition to maintain their market positions. Traditional automotive manufacturers are increasingly transforming their business models to focus on electric mobility, while pure-play EV manufacturers are expanding their presence through innovative technology offerings and direct-to-consumer sales approaches. The market has witnessed numerous strategic partnerships and joint ventures, particularly between automotive manufacturers and technology companies, aimed at accelerating electric vehicle development and production.
The industry is experiencing a wave of consolidation through mergers and acquisitions, as companies seek to acquire technological capabilities and scale their operations. Chinese manufacturers are rapidly expanding their global footprint through strategic partnerships and investments in emerging markets. New entrants are focusing on specific market segments or regions to establish their presence, while established players are acquiring startups to enhance their technological capabilities. The market is also seeing increased collaboration between automotive manufacturers and battery producers to secure supply chains and develop next-generation battery technologies. The market share of electric vehicle companies is significantly influenced by these strategic maneuvers, with the largest EV companies by sales continuing to dominate.
Innovation and Sustainability Drive Future Success
Success in the electric vehicle market increasingly depends on companies' ability to innovate while maintaining cost competitiveness. Manufacturers must focus on developing advanced battery technologies, improving charging infrastructure, and enhancing vehicle performance to meet evolving consumer expectations. Vertical integration of supply chains, particularly in battery production and raw material sourcing, has become crucial for maintaining competitive advantages. Companies are also investing in sustainable manufacturing practices and circular economy initiatives to address growing environmental concerns and regulatory requirements. The ability to offer comprehensive mobility solutions, including charging infrastructure and connected services, is becoming a key differentiator in the market.
For new entrants and smaller players, success lies in identifying and exploiting niche market segments or specific geographical regions. Companies must develop strong relationships with suppliers and technology partners to ensure reliable access to critical components and technologies. The regulatory landscape continues to evolve, with governments implementing stricter emissions standards and offering incentives for electric vehicle adoption, making compliance and adaptation to policy changes crucial for success. Market players must also focus on building strong after-sales networks and ensuring product quality to build consumer trust and brand loyalty. The ability to scale production while maintaining quality and managing costs will be critical for long-term success in this highly competitive market. Electric vehicle companies are increasingly focusing on these aspects to secure their position in the industry.
Electric Vehicles Market Leaders
-
Ford Motor Company
-
Stellantis N.V.
-
Tesla Inc.
-
Toyota Motor Corporation
-
Volkswagen AG
- *Disclaimer: Major Players sorted in no particular order

Need More Details on Market Players and Competiters?
Download PDF
Electric Vehicles Market News
- September 2023: Stellantis announced the forthcoming world premiere of the new Peugeot E-3008, an all-electric fastback SUV in the Sochaux factory, France, where it will be manufactured.
- September 2023: Stellantis inaugurated the first battery technology center at the Mirafiori plant in Turin, Italy.
- September 2023: Volkswagen France created a fast-charging network under the "Electrify France" label, covering its distribution networks for Volkswagen Commercial Vehicles, Audi, SEAT, CUPRA, and Škoda brands.
Free With This Report
For the Vehicle Hub report, we provide an extensive collection of over 150 free charts, delivering detailed insights on regional and country-level dynamics within the vehicle industry. This encompasses in-depth analyses of vehicle registrations, usage patterns in both consumer and business segments, and evaluations of various vehicle configurations and body types. The report delves into critical industrial trends such as shifts in vehicle production and distribution centers, changes in vehicle ownership costs, and advancements in automotive technologies. Further, our report offers comprehensive market segmentation by vehicle type, body type, propulsion, and fuel categories, providing a nuanced understanding of the market landscape. It also explores the adoption rate of new technologies, the impact of regulatory changes, and the influence of economic factors on the vehicle market. We include a thorough examination of key industry players, regulatory frameworks, and market size in terms of both revenue and unit sales, leading to strategic projections and forecasts that account for emerging trends and potential shifts in the industry.


Electric Vehicles Market Report - Table of Contents
1. EXECUTIVE SUMMARY & KEY FINDINGS
2. REPORT OFFERS
3. INTRODUCTION
- 3.1 Study Assumptions & Market Definition
- 3.2 Scope of the Study
- 3.3 Research Methodology
4. KEY INDUSTRY TRENDS
-
4.1 Population
- 4.1.1 Africa
- 4.1.2 Asia-Pacific
- 4.1.3 Europe
- 4.1.4 Middle East
- 4.1.5 North America
- 4.1.6 South America
-
4.2 GDP Per Capita
- 4.2.1 Africa
- 4.2.2 Asia-Pacific
- 4.2.3 Europe
- 4.2.4 Middle East
- 4.2.5 North America
- 4.2.6 South America
-
4.3 Consumer Spending For Vehicle Purchase (cvp)
- 4.3.1 Africa
- 4.3.2 Asia-Pacific
- 4.3.3 Europe
- 4.3.4 Middle East
- 4.3.5 North America
- 4.3.6 South America
-
4.4 Inflation
- 4.4.1 Africa
- 4.4.2 Asia-Pacific
- 4.4.3 Europe
- 4.4.4 Middle East
- 4.4.5 North America
- 4.4.6 South America
- 4.5 Interest Rate For Auto Loans
- 4.6 Shared Rides
- 4.7 Impact Of Electrification
- 4.8 EV Charging Station
-
4.9 Battery Pack Price
- 4.9.1 Africa
- 4.9.2 Asia-Pacific
- 4.9.3 Europe
- 4.9.4 Middle East
- 4.9.5 North America
- 4.9.6 South America
- 4.10 New Xev Models Announced
- 4.11 Used Car Sales
- 4.12 Fuel Price
- 4.13 Oem-wise Production Statistics
- 4.14 Regulatory Framework
- 4.15 Value Chain & Distribution Channel Analysis
5. MARKET SEGMENTATION (includes market size in Value in USD and Volume, Forecasts up to 2029 and analysis of growth prospects)
-
5.1 Vehicle Type
- 5.1.1 Commercial Vehicles
- 5.1.1.1 Heavy-duty Commercial Trucks
- 5.1.1.2 Medium-duty Commercial Trucks
- 5.1.2 Passenger Vehicles
- 5.1.2.1 Multi-purpose Vehicle
- 5.1.3 Two-Wheelers
-
5.2 Fuel Category
- 5.2.1 BEV
- 5.2.2 FCEV
- 5.2.3 HEV
- 5.2.4 PHEV
-
5.3 Region
- 5.3.1 Africa
- 5.3.2 Asia-Pacific
- 5.3.3 Europe
- 5.3.3.1 Austria
- 5.3.3.2 Belgium
- 5.3.3.3 Czech Republic
- 5.3.3.4 Denmark
- 5.3.3.5 Estonia
- 5.3.3.6 France
- 5.3.3.7 Germany
- 5.3.3.8 Ireland
- 5.3.3.9 Italy
- 5.3.3.10 Latvia
- 5.3.3.11 Lithuania
- 5.3.3.12 Norway
- 5.3.3.13 Poland
- 5.3.3.14 Russia
- 5.3.3.15 Spain
- 5.3.3.16 Sweden
- 5.3.3.17 UK
- 5.3.3.18 Rest-of-Europe
- 5.3.4 Middle East
- 5.3.5 North America
- 5.3.6 South America
- 5.3.6.1 Brazil
6. COMPETITIVE LANDSCAPE
- 6.1 Key Strategic Moves
- 6.2 Market Share Analysis
- 6.3 Company Landscape
-
6.4 Company Profiles
- 6.4.1 BYD Auto Co. Ltd.
- 6.4.2 Daimler AG (Mercedes-Benz AG)
- 6.4.3 Ford Motor Company
- 6.4.4 Gac Aion New Energy Automobile Co.Ltd
- 6.4.5 General Motors Company
- 6.4.6 Groupe Renault
- 6.4.7 Nissan Motor Co. Ltd.
- 6.4.8 Stellantis N.V.
- 6.4.9 Tesla Inc.
- 6.4.10 Toyota Motor Corporation
- 6.4.11 Volkswagen AG
- *List Not Exhaustive
7. KEY STRATEGIC QUESTIONS FOR VEHICLES CEOS
8. APPENDIX
-
8.1 Global Overview
- 8.1.1 Overview
- 8.1.2 Porter’s Five Forces Framework
- 8.1.3 Global Value Chain Analysis
- 8.1.4 Market Dynamics (DROs)
- 8.2 Sources & References
- 8.3 List of Tables & Figures
- 8.4 Primary Insights
- 8.5 Data Pack
- 8.6 Glossary of Terms
You Can Purchase Parts Of This Report. Check Out Prices For Specific Sections
Get Price Break-up Now
List of Tables & Figures
- Figure 1:
- POPULATION TRENDS, VOLUME IN UNITS, AFRICA, 2017 - 2030
- Figure 2:
- POPULATION TRENDS, VOLUME IN UNITS, ASIA-PACIFIC, 2017 - 2030
- Figure 3:
- POPULATION TRENDS, VOLUME IN UNITS, EUROPE, 2017 - 2030
- Figure 4:
- POPULATION TRENDS, VOLUME IN UNITS, MIDDLE EAST, 2017 - 2030
- Figure 5:
- POPULATION TRENDS, VOLUME IN UNITS, NORTH AMERICA, 2017 - 2030
- Figure 6:
- POPULATION TRENDS, VOLUME IN UNITS, SOUTH AMERICA, 2017 - 2030
- Figure 7:
- GDP PER CAPITA AT CURRENT PRICES, VALUE IN USD, AFRICA, 2017 - 2030
- Figure 8:
- GDP PER CAPITA AT CURRENT PRICES, VALUE IN USD, ASIA-PACIFIC, 2017 - 2030
- Figure 9:
- GDP PER CAPITA AT CURRENT PRICES, VALUE IN USD, EUROPE, 2017 - 2030
- Figure 10:
- GDP PER CAPITA AT CURRENT PRICES, VALUE IN USD, MIDDLE EAST, 2017 - 2030
- Figure 11:
- GDP PER CAPITA AT CURRENT PRICES, VALUE IN USD, NORTH AMERICA, 2017 - 2030
- Figure 12:
- GDP PER CAPITA AT CURRENT PRICES, VALUE IN USD, SOUTH AMERICA, 2017 - 2030
- Figure 13:
- AVERAGE CONSUMER SPENDING PER CAPITA ON PURCHASE OF VEHICLES, VALUE IN USD, AFRICA, 2017 - 2030
- Figure 14:
- AVERAGE CONSUMER SPENDING PER CAPITA ON PURCHASE OF VEHICLES, VALUE IN USD, ASIA-PACIFIC, 2017 - 2030
- Figure 15:
- AVERAGE CONSUMER SPENDING PER CAPITA ON PURCHASE OF VEHICLES, VALUE IN USD, EUROPE, 2017 - 2030
- Figure 16:
- AVERAGE CONSUMER SPENDING PER CAPITA ON PURCHASE OF VEHICLES, VALUE IN USD, MIDDLE EAST, 2017 - 2030
- Figure 17:
- AVERAGE CONSUMER SPENDING PER CAPITA ON PURCHASE OF VEHICLES, VALUE IN USD, NORTH AMERICA, 2017 - 2030
- Figure 18:
- AVERAGE CONSUMER SPENDING PER CAPITA ON PURCHASE OF VEHICLES, VALUE IN USD, SOUTH AMERICA, 2017 - 2030
- Figure 19:
- INFLATION RATE AT AVERAGE CONSUMER PRICES, PERCENTAGE CHANGE, AFRICA, 2017 - 2030
- Figure 20:
- INFLATION RATE AT AVERAGE CONSUMER PRICES, PERCENTAGE CHANGE, ASIA-PACIFIC, 2017 - 2030
- Figure 21:
- INFLATION RATE AT AVERAGE CONSUMER PRICES, PERCENTAGE CHANGE, EUROPE, 2017 - 2030
- Figure 22:
- INFLATION RATE AT AVERAGE CONSUMER PRICES, PERCENTAGE CHANGE, MIDDLE EAST, 2017 - 2030
- Figure 23:
- INFLATION RATE AT AVERAGE CONSUMER PRICES, PERCENTAGE CHANGE, NORTH AMERICA, 2017 - 2030
- Figure 24:
- INFLATION RATE AT AVERAGE CONSUMER PRICES, PERCENTAGE CHANGE, SOUTH AMERICA, 2017 - 2030
- Figure 25:
- AUTO LOAN INTEREST RATES, PERCENTAGE, GLOBAL, 2017 - 2022
- Figure 26:
- ELECTRIC VEHICLE MARKET PENETRATION RATE, BY VEHICLE TYPE, PERCENTAGE OF VOLUME, GLOBAL, 2017 - 2030
- Figure 27:
- CHARGING STATION DEPLOYMENT, BY TYPE, VOLUME IN UNITS, GLOBAL, 2017 - 2022
- Figure 28:
- AVERAGE LITHIUM-ION BATTERY PACK PRICE, VALUE IN USD, AFRICA, 2017 - 2030
- Figure 29:
- AVERAGE LITHIUM-ION BATTERY PACK PRICE, VALUE IN USD, ASIA-PACIFIC, 2017 - 2030
- Figure 30:
- AVERAGE LITHIUM-ION BATTERY PACK PRICE, VALUE IN USD, EUROPE, 2017 - 2030
- Figure 31:
- AVERAGE LITHIUM-ION BATTERY PACK PRICE, VALUE IN USD, MIDDLE EAST, 2017 - 2030
- Figure 32:
- AVERAGE LITHIUM-ION BATTERY PACK PRICE, VALUE IN USD, NORTH AMERICA, 2017 - 2030
- Figure 33:
- AVERAGE LITHIUM-ION BATTERY PACK PRICE, VALUE IN USD, SOUTH AMERICA, 2017 - 2030
- Figure 34:
- ANNOUNCEMENT OF NEW XEV MODELS, BY VEHICLE TYPE, VOLUME IN UNITS, GLOBAL, 2023 - 2027
- Figure 35:
- FUEL PRICE, BY FUEL TYPE, USD/LITER, GLOBAL, 2017 - 2022
- Figure 36:
- GLOBAL ELECTRIC VEHICLES MARKET, VOLUME IN UNITS, 2017 - 2030
- Figure 37:
- GLOBAL ELECTRIC VEHICLES MARKET, VALUE IN USD, 2017 - 2030
- Figure 38:
- GLOBAL ELECTRIC VEHICLES MARKET, BY VEHICLE TYPE, BY VOLUME IN UNITS, 2017 - 2030
- Figure 39:
- GLOBAL ELECTRIC VEHICLES MARKET, BY VEHICLE TYPE, BY VALUE IN USD, 2017 - 2030
- Figure 40:
- GLOBAL ELECTRIC VEHICLES MARKET MARKET, SHARE(%), BY VEHICLE TYPE, 2017 - 2030
- Figure 41:
- GLOBAL ELECTRIC VEHICLES MARKET MARKET, SHARE(%), BY VEHICLE TYPE, 2017 - 2030
- Figure 42:
- GLOBAL ELECTRIC VEHICLES MARKET, BY VEHICLE BODY TYPE, BY VOLUME IN UNITS, 2017 - 2030
- Figure 43:
- GLOBAL ELECTRIC VEHICLES MARKET, BY VEHICLE BODY TYPE, BY VALUE IN USD, 2017 - 2030
- Figure 44:
- GLOBAL ELECTRIC VEHICLES MARKET MARKET, SHARE(%), BY VEHICLE BODY TYPE, 2017 - 2030
- Figure 45:
- GLOBAL ELECTRIC VEHICLES MARKET MARKET, SHARE(%), BY VEHICLE BODY TYPE, 2017 - 2030
- Figure 46:
- GLOBAL ELECTRIC VEHICLES MARKET, BY HEAVY-DUTY COMMERCIAL TRUCKS, BY VOLUME IN UNITS, 2017 - 2030
- Figure 47:
- GLOBAL ELECTRIC VEHICLES MARKET, BY HEAVY-DUTY COMMERCIAL TRUCKS, BY VALUE IN USD, 2017 - 2030
- Figure 48:
- GLOBAL ELECTRIC VEHICLES MARKET MARKET, SHARE(%), BY VEHICLE BODY TYPE, 2017 - 2030
- Figure 49:
- GLOBAL ELECTRIC VEHICLES MARKET, BY MEDIUM-DUTY COMMERCIAL TRUCKS, BY VOLUME IN UNITS, 2017 - 2030
- Figure 50:
- GLOBAL ELECTRIC VEHICLES MARKET, BY MEDIUM-DUTY COMMERCIAL TRUCKS, BY VALUE IN USD, 2017 - 2030
- Figure 51:
- GLOBAL ELECTRIC VEHICLES MARKET MARKET, SHARE(%), BY VEHICLE BODY TYPE, 2017 - 2030
- Figure 52:
- GLOBAL ELECTRIC VEHICLES MARKET, BY VEHICLE BODY TYPE, BY VOLUME IN UNITS, 2017 - 2030
- Figure 53:
- GLOBAL ELECTRIC VEHICLES MARKET, BY VEHICLE BODY TYPE, BY VALUE IN USD, 2017 - 2030
- Figure 54:
- GLOBAL ELECTRIC VEHICLES MARKET MARKET, SHARE(%), BY VEHICLE BODY TYPE, 2017 - 2030
- Figure 55:
- GLOBAL ELECTRIC VEHICLES MARKET MARKET, SHARE(%), BY VEHICLE BODY TYPE, 2017 - 2030
- Figure 56:
- GLOBAL ELECTRIC VEHICLES MARKET, BY MULTI-PURPOSE VEHICLE, BY VOLUME IN UNITS, 2017 - 2030
- Figure 57:
- GLOBAL ELECTRIC VEHICLES MARKET, BY MULTI-PURPOSE VEHICLE, BY VALUE IN USD, 2017 - 2030
- Figure 58:
- GLOBAL ELECTRIC VEHICLES MARKET MARKET, SHARE(%), BY VEHICLE BODY TYPE, 2017 - 2030
- Figure 59:
- GLOBAL ELECTRIC VEHICLES MARKET, BY TWO-WHEELERS, BY VOLUME IN UNITS, 2017 - 2030
- Figure 60:
- GLOBAL ELECTRIC VEHICLES MARKET, BY TWO-WHEELERS, BY VALUE IN USD, 2017 - 2030
- Figure 61:
- GLOBAL ELECTRIC VEHICLES MARKET, BY FUEL CATEGORY, BY VOLUME IN UNITS, 2017 - 2030
- Figure 62:
- GLOBAL ELECTRIC VEHICLES MARKET, BY FUEL CATEGORY, BY VALUE IN USD, 2017 - 2030
- Figure 63:
- GLOBAL ELECTRIC VEHICLES MARKET MARKET, SHARE(%), BY FUEL CATEGORY, 2017 - 2030
- Figure 64:
- GLOBAL ELECTRIC VEHICLES MARKET MARKET, SHARE(%), BY FUEL CATEGORY, 2017 - 2030
- Figure 65:
- GLOBAL ELECTRIC VEHICLES MARKET, BY BEV, BY VOLUME IN UNITS, 2017 - 2030
- Figure 66:
- GLOBAL ELECTRIC VEHICLES MARKET, BY BEV, BY VALUE IN USD, 2017 - 2030
- Figure 67:
- GLOBAL ELECTRIC VEHICLES MARKET MARKET, SHARE(%), BY FUEL CATEGORY, 2017 - 2030
- Figure 68:
- GLOBAL ELECTRIC VEHICLES MARKET, BY FCEV, BY VOLUME IN UNITS, 2017 - 2030
- Figure 69:
- GLOBAL ELECTRIC VEHICLES MARKET, BY FCEV, BY VALUE IN USD, 2017 - 2030
- Figure 70:
- GLOBAL ELECTRIC VEHICLES MARKET MARKET, SHARE(%), BY FUEL CATEGORY, 2017 - 2030
- Figure 71:
- GLOBAL ELECTRIC VEHICLES MARKET, BY HEV, BY VOLUME IN UNITS, 2017 - 2030
- Figure 72:
- GLOBAL ELECTRIC VEHICLES MARKET, BY HEV, BY VALUE IN USD, 2017 - 2030
- Figure 73:
- GLOBAL ELECTRIC VEHICLES MARKET MARKET, SHARE(%), BY FUEL CATEGORY, 2017 - 2030
- Figure 74:
- GLOBAL ELECTRIC VEHICLES MARKET, BY PHEV, BY VOLUME IN UNITS, 2017 - 2030
- Figure 75:
- GLOBAL ELECTRIC VEHICLES MARKET, BY PHEV, BY VALUE IN USD, 2017 - 2030
- Figure 76:
- GLOBAL ELECTRIC VEHICLES MARKET MARKET, SHARE(%), BY FUEL CATEGORY, 2017 - 2030
- Figure 77:
- GLOBAL ELECTRIC VEHICLES MARKET, BY REGION, BY VOLUME IN UNITS, 2017 - 2030
- Figure 78:
- GLOBAL ELECTRIC VEHICLES MARKET, BY REGION, BY VALUE IN USD, 2017 - 2030
- Figure 79:
- GLOBAL ELECTRIC VEHICLES MARKET MARKET, SHARE(%), BY REGION, 2017 - 2030
- Figure 80:
- GLOBAL ELECTRIC VEHICLES MARKET MARKET, SHARE(%), BY REGION, 2017 - 2030
- Figure 81:
- GLOBAL ELECTRIC VEHICLES MARKET, BY COUNTRY, BY VOLUME IN UNITS, 2017 - 2030
- Figure 82:
- GLOBAL ELECTRIC VEHICLES MARKET, BY COUNTRY, BY VALUE IN USD, 2017 - 2030
- Figure 83:
- GLOBAL ELECTRIC VEHICLES MARKET MARKET, SHARE(%), BY COUNTRY, 2017 - 2030
- Figure 84:
- GLOBAL ELECTRIC VEHICLES MARKET MARKET, SHARE(%), BY COUNTRY, 2017 - 2030
- Figure 85:
- GLOBAL ELECTRIC VEHICLES MARKET, BY COUNTRY, BY VOLUME IN UNITS, 2017 - 2030
- Figure 86:
- GLOBAL ELECTRIC VEHICLES MARKET, BY COUNTRY, BY VALUE IN USD, 2017 - 2030
- Figure 87:
- GLOBAL ELECTRIC VEHICLES MARKET MARKET, SHARE(%), BY COUNTRY, 2017 - 2030
- Figure 88:
- GLOBAL ELECTRIC VEHICLES MARKET MARKET, SHARE(%), BY COUNTRY, 2017 - 2030
- Figure 89:
- GLOBAL ELECTRIC VEHICLES MARKET, BY COUNTRY, BY VOLUME IN UNITS, 2017 - 2030
- Figure 90:
- GLOBAL ELECTRIC VEHICLES MARKET, BY COUNTRY, BY VALUE IN USD, 2017 - 2030
- Figure 91:
- GLOBAL ELECTRIC VEHICLES MARKET MARKET, SHARE(%), BY COUNTRY, 2017 - 2030
- Figure 92:
- GLOBAL ELECTRIC VEHICLES MARKET MARKET, SHARE(%), BY COUNTRY, 2017 - 2030
- Figure 93:
- GLOBAL ELECTRIC VEHICLES MARKET, BY AUSTRIA, BY VOLUME IN UNITS, 2017 - 2030
- Figure 94:
- GLOBAL ELECTRIC VEHICLES MARKET, BY AUSTRIA, BY VALUE IN USD, 2017 - 2030
- Figure 95:
- GLOBAL ELECTRIC VEHICLES MARKET MARKET, SHARE(%), BY VEHICLE BODY TYPE, 2017 - 2030
- Figure 96:
- GLOBAL ELECTRIC VEHICLES MARKET, BY BELGIUM, BY VOLUME IN UNITS, 2017 - 2030
- Figure 97:
- GLOBAL ELECTRIC VEHICLES MARKET, BY BELGIUM, BY VALUE IN USD, 2017 - 2030
- Figure 98:
- GLOBAL ELECTRIC VEHICLES MARKET MARKET, SHARE(%), BY VEHICLE BODY TYPE, 2017 - 2030
- Figure 99:
- GLOBAL ELECTRIC VEHICLES MARKET, BY CZECH REPUBLIC, BY VOLUME IN UNITS, 2017 - 2030
- Figure 100:
- GLOBAL ELECTRIC VEHICLES MARKET, BY CZECH REPUBLIC, BY VALUE IN USD, 2017 - 2030
- Figure 101:
- GLOBAL ELECTRIC VEHICLES MARKET MARKET, SHARE(%), BY VEHICLE BODY TYPE, 2017 - 2030
- Figure 102:
- GLOBAL ELECTRIC VEHICLES MARKET, BY DENMARK, BY VOLUME IN UNITS, 2017 - 2030
- Figure 103:
- GLOBAL ELECTRIC VEHICLES MARKET, BY DENMARK, BY VALUE IN USD, 2017 - 2030
- Figure 104:
- GLOBAL ELECTRIC VEHICLES MARKET MARKET, SHARE(%), BY VEHICLE BODY TYPE, 2017 - 2030
- Figure 105:
- GLOBAL ELECTRIC VEHICLES MARKET, BY ESTONIA, BY VOLUME IN UNITS, 2017 - 2030
- Figure 106:
- GLOBAL ELECTRIC VEHICLES MARKET, BY ESTONIA, BY VALUE IN USD, 2017 - 2030
- Figure 107:
- GLOBAL ELECTRIC VEHICLES MARKET MARKET, SHARE(%), BY VEHICLE BODY TYPE, 2017 - 2030
- Figure 108:
- GLOBAL ELECTRIC VEHICLES MARKET, BY FRANCE, BY VOLUME IN UNITS, 2017 - 2030
- Figure 109:
- GLOBAL ELECTRIC VEHICLES MARKET, BY FRANCE, BY VALUE IN USD, 2017 - 2030
- Figure 110:
- GLOBAL ELECTRIC VEHICLES MARKET MARKET, SHARE(%), BY VEHICLE BODY TYPE, 2017 - 2030
- Figure 111:
- GLOBAL ELECTRIC VEHICLES MARKET, BY GERMANY, BY VOLUME IN UNITS, 2017 - 2030
- Figure 112:
- GLOBAL ELECTRIC VEHICLES MARKET, BY GERMANY, BY VALUE IN USD, 2017 - 2030
- Figure 113:
- GLOBAL ELECTRIC VEHICLES MARKET MARKET, SHARE(%), BY VEHICLE BODY TYPE, 2017 - 2030
- Figure 114:
- GLOBAL ELECTRIC VEHICLES MARKET, BY IRELAND, BY VOLUME IN UNITS, 2017 - 2030
- Figure 115:
- GLOBAL ELECTRIC VEHICLES MARKET, BY IRELAND, BY VALUE IN USD, 2017 - 2030
- Figure 116:
- GLOBAL ELECTRIC VEHICLES MARKET MARKET, SHARE(%), BY VEHICLE BODY TYPE, 2017 - 2030
- Figure 117:
- GLOBAL ELECTRIC VEHICLES MARKET, BY ITALY, BY VOLUME IN UNITS, 2017 - 2030
- Figure 118:
- GLOBAL ELECTRIC VEHICLES MARKET, BY ITALY, BY VALUE IN USD, 2017 - 2030
- Figure 119:
- GLOBAL ELECTRIC VEHICLES MARKET MARKET, SHARE(%), BY VEHICLE BODY TYPE, 2017 - 2030
- Figure 120:
- GLOBAL ELECTRIC VEHICLES MARKET, BY LATVIA, BY VOLUME IN UNITS, 2017 - 2030
- Figure 121:
- GLOBAL ELECTRIC VEHICLES MARKET, BY LATVIA, BY VALUE IN USD, 2017 - 2030
- Figure 122:
- GLOBAL ELECTRIC VEHICLES MARKET MARKET, SHARE(%), BY VEHICLE BODY TYPE, 2017 - 2030
- Figure 123:
- GLOBAL ELECTRIC VEHICLES MARKET, BY LITHUANIA, BY VOLUME IN UNITS, 2017 - 2030
- Figure 124:
- GLOBAL ELECTRIC VEHICLES MARKET, BY LITHUANIA, BY VALUE IN USD, 2017 - 2030
- Figure 125:
- GLOBAL ELECTRIC VEHICLES MARKET MARKET, SHARE(%), BY VEHICLE BODY TYPE, 2017 - 2030
- Figure 126:
- GLOBAL ELECTRIC VEHICLES MARKET, BY NORWAY, BY VOLUME IN UNITS, 2017 - 2030
- Figure 127:
- GLOBAL ELECTRIC VEHICLES MARKET, BY NORWAY, BY VALUE IN USD, 2017 - 2030
- Figure 128:
- GLOBAL ELECTRIC VEHICLES MARKET MARKET, SHARE(%), BY VEHICLE BODY TYPE, 2017 - 2030
- Figure 129:
- GLOBAL ELECTRIC VEHICLES MARKET, BY POLAND, BY VOLUME IN UNITS, 2017 - 2030
- Figure 130:
- GLOBAL ELECTRIC VEHICLES MARKET, BY POLAND, BY VALUE IN USD, 2017 - 2030
- Figure 131:
- GLOBAL ELECTRIC VEHICLES MARKET MARKET, SHARE(%), BY VEHICLE BODY TYPE, 2017 - 2030
- Figure 132:
- GLOBAL ELECTRIC VEHICLES MARKET, BY RUSSIA, BY VOLUME IN UNITS, 2017 - 2030
- Figure 133:
- GLOBAL ELECTRIC VEHICLES MARKET, BY RUSSIA, BY VALUE IN USD, 2017 - 2030
- Figure 134:
- GLOBAL ELECTRIC VEHICLES MARKET MARKET, SHARE(%), BY VEHICLE BODY TYPE, 2017 - 2030
- Figure 135:
- GLOBAL ELECTRIC VEHICLES MARKET, BY SPAIN, BY VOLUME IN UNITS, 2017 - 2030
- Figure 136:
- GLOBAL ELECTRIC VEHICLES MARKET, BY SPAIN, BY VALUE IN USD, 2017 - 2030
- Figure 137:
- GLOBAL ELECTRIC VEHICLES MARKET MARKET, SHARE(%), BY VEHICLE BODY TYPE, 2017 - 2030
- Figure 138:
- GLOBAL ELECTRIC VEHICLES MARKET, BY SWEDEN, BY VOLUME IN UNITS, 2017 - 2030
- Figure 139:
- GLOBAL ELECTRIC VEHICLES MARKET, BY SWEDEN, BY VALUE IN USD, 2017 - 2030
- Figure 140:
- GLOBAL ELECTRIC VEHICLES MARKET MARKET, SHARE(%), BY VEHICLE BODY TYPE, 2017 - 2030
- Figure 141:
- GLOBAL ELECTRIC VEHICLES MARKET, BY UK, BY VOLUME IN UNITS, 2017 - 2030
- Figure 142:
- GLOBAL ELECTRIC VEHICLES MARKET, BY UK, BY VALUE IN USD, 2017 - 2030
- Figure 143:
- GLOBAL ELECTRIC VEHICLES MARKET MARKET, SHARE(%), BY VEHICLE BODY TYPE, 2017 - 2030
- Figure 144:
- GLOBAL ELECTRIC VEHICLES MARKET, BY REST-OF-EUROPE, BY VOLUME IN UNITS, 2017 - 2030
- Figure 145:
- GLOBAL ELECTRIC VEHICLES MARKET, BY REST-OF-EUROPE, BY VALUE IN USD, 2017 - 2030
- Figure 146:
- GLOBAL ELECTRIC VEHICLES MARKET MARKET, SHARE(%), BY VEHICLE BODY TYPE, 2017 - 2030
- Figure 147:
- GLOBAL ELECTRIC VEHICLES MARKET, BY COUNTRY, BY VOLUME IN UNITS, 2017 - 2030
- Figure 148:
- GLOBAL ELECTRIC VEHICLES MARKET, BY COUNTRY, BY VALUE IN USD, 2017 - 2030
- Figure 149:
- GLOBAL ELECTRIC VEHICLES MARKET MARKET, SHARE(%), BY COUNTRY, 2017 - 2030
- Figure 150:
- GLOBAL ELECTRIC VEHICLES MARKET MARKET, SHARE(%), BY COUNTRY, 2017 - 2030
- Figure 151:
- GLOBAL ELECTRIC VEHICLES MARKET, BY COUNTRY, BY VOLUME IN UNITS, 2017 - 2030
- Figure 152:
- GLOBAL ELECTRIC VEHICLES MARKET, BY COUNTRY, BY VALUE IN USD, 2017 - 2030
- Figure 153:
- GLOBAL ELECTRIC VEHICLES MARKET MARKET, SHARE(%), BY COUNTRY, 2017 - 2030
- Figure 154:
- GLOBAL ELECTRIC VEHICLES MARKET MARKET, SHARE(%), BY COUNTRY, 2017 - 2030
- Figure 155:
- GLOBAL ELECTRIC VEHICLES MARKET, BY COUNTRY, BY VOLUME IN UNITS, 2017 - 2030
- Figure 156:
- GLOBAL ELECTRIC VEHICLES MARKET, BY COUNTRY, BY VALUE IN USD, 2017 - 2030
- Figure 157:
- GLOBAL ELECTRIC VEHICLES MARKET MARKET, SHARE(%), BY COUNTRY, 2017 - 2030
- Figure 158:
- GLOBAL ELECTRIC VEHICLES MARKET MARKET, SHARE(%), BY COUNTRY, 2017 - 2030
- Figure 159:
- GLOBAL ELECTRIC VEHICLES MARKET, BY BRAZIL, BY VOLUME IN UNITS, 2017 - 2030
- Figure 160:
- GLOBAL ELECTRIC VEHICLES MARKET, BY BRAZIL, BY VALUE IN USD, 2017 - 2030
- Figure 161:
- GLOBAL ELECTRIC VEHICLES MARKET MARKET, SHARE(%), BY VEHICLE BODY TYPE, 2017 - 2030
- Figure 162:
- GLOBAL ELECTRIC VEHICLES MARKET, MOST ACTIVE COMPANIES, BY NUMBER OF STRATEGIC MOVES, 2017 - 2030
- Figure 163:
- GLOBAL ELECTRIC VEHICLES MARKET, MOST ADOPTED STRATEGIES, 2017 - 2030
- Figure 164:
- GLOBAL ELECTRIC VEHICLES MARKET SHARE(%), BY MAJOR PLAYERS
Electric Vehicles Industry Segmentation
Commercial Vehicles, Passenger Vehicles, Two-Wheelers are covered as segments by Vehicle Type. BEV, FCEV, HEV, PHEV are covered as segments by Fuel Category. Africa, Asia-Pacific, Europe, Middle East, North America, South America are covered as segments by Region.| Vehicle Type | Commercial Vehicles | Heavy-duty Commercial Trucks | |
| Medium-duty Commercial Trucks | |||
| Passenger Vehicles | Multi-purpose Vehicle | ||
| Two-Wheelers | |||
| Fuel Category | BEV | ||
| FCEV | |||
| HEV | |||
| PHEV | |||
| Region | Africa | ||
| Asia-Pacific | |||
| Europe | Austria | ||
| Belgium | |||
| Czech Republic | |||
| Denmark | |||
| Estonia | |||
| France | |||
| Germany | |||
| Ireland | |||
| Italy | |||
| Latvia | |||
| Lithuania | |||
| Norway | |||
| Poland | |||
| Russia | |||
| Spain | |||
| Sweden | |||
| UK | |||
| Rest-of-Europe | |||
| Middle East | |||
| North America | |||
| South America | Brazil | ||
Need A Different Region or Segment?
Customize Now
Market Definition
- Vehicle Type - The category includes passenger cars, commercial vehicles, and two-wheelers.
- Vehicle Body Type - TUnder Passenger Cars, the category includes Hatchbacks, Sedans, Sports Utility Vehicles, and Multi-purpose Vehicles; for Commercial Vehicles, it covers Light Commercial Pick-up Trucks, Light Commercial Vans, Medium-duty Commercial Trucks, Heavy-duty Commercial Trucks, and Medium and Heavy Duty Buses; and for Two-Wheelers, it encompasses Scooters and Motorcycles.
- Fuel Category - The category exclusively covers electric propulsion systems, including various types such as HEV (Hybrid Electric Vehicles), PHEV (Plug-in Hybrid Electric Vehicles), BEV (Battery Electric Vehicles), and FCEV (Fuel Cell Electric Vehicles).
| Keyword | Definition |
|---|---|
| Electric Vehicle (EV) | A vehicle which uses one or more electric motors for propulsion. Includes cars, buses, and trucks. This term includes all-electric vehicles or battery electric vehicles and plug-in hybrid electric vehicles. |
| BEV | A BEV relies completely on a battery and a motor for propulsion. The battery in the vehicle must be charged by plugging it into an outlet or public charging station. BEVs do not have an ICE and hence are pollution-free. They have a low cost of operation and reduced engine noise as compared to conventional fuel engines. However, they have a shorter range and higher prices than their equivalent gasoline models. |
| PEV | A plug-in electric vehicle is an electric vehicle that can be externally charged and generally includes all-electric vehicles as well as plug-in hybrids. |
| Plug-in Hybrid EV | A vehicle that can be powered either by an ICE or an electric motor. In contrast to normal hybrid EVs, they can be charged externally. |
| Internal combustion engine | An engine in which the burning of fuels occurs in a confined space called a combustion chamber. Usually run with gasoline/petrol or diesel. |
| Hybrid EV | A vehicle powered by an ICE in combination with one or more electric motors that use energy stored in batteries. These are continually recharged with power from the ICE and regenerative braking. |
| Commercial Vehicles | Commercial vehicles are motorized road vehicles designed for transporting people or goods. The category includes light commercial vehicles (LCVs) and medium and heavy-duty vehicles (M&HCV). |
| Passenger Vehicles | Passenger cars are electric motor– or engine-driven vehicles with at least four wheels. These vehicles are used for the transport of passengers and comprise no more than eight seats in addition to the driver’s seat. |
| Light Commercial Vehicles | Commercial vehicles that weigh less than 6,000 lb (Class 1) and in the range of 6,001–10,000 lb (Class 2) are covered under this category. |
| M&HDT | Commercial vehicles that weigh in the range of 10,001–14,000 lb (Class 3), 14,001–16,000 lb (Class 4), 16,001–19,500 lb (Class 5), 19,501–26,000 lb (Class 6), 26,001–33,000 lb (Class 7) and above 33,001 lb (Class 8) are covered under this category. |
| Bus | A mode of transportation that typically refers to a large vehicle designed to carry passengers over long distances. This includes transit bus, school bus, shuttle bus, and trolleybuses. |
| Diesel | It includes vehicles that use diesel as their primary fuel. A diesel engine vehicle have a compression-ignited injection system rather than the spark-ignited system used by most gasoline vehicles. In such vehicles, fuel is injected into the combustion chamber and ignited by the high temperature achieved when gas is greatly compressed. |
| Gasoline | It includes vehicles that use gas/petrol as their primary fuel. A gasoline car typically uses a spark-ignited internal combustion engine. In such vehicles, fuel is injected into either the intake manifold or the combustion chamber, where it is combined with air, and the air/fuel mixture is ignited by the spark from a spark plug. |
| LPG | It includes vehicles that use LPG as their primary fuel. Both dedicated and bi-fuel LPG vehicles are considered under the scope of the study. |
| CNG | It includes vehicles that use CNG as their primary fuel. These are vehicles that operate like gasoline-powered vehicles with spark-ignited internal combustion engines. |
| HEV | All the electric vehicles that use batteries and an internal combustion engine (ICE) as their primary source for propulsion are considered under this category. HEVs generally use a diesel-electric powertrain and are also known as hybrid diesel-electric vehicles. An HEV converts the vehicle momentum (kinetic energy) into electricity that recharges the battery when the vehicle slows down or stops. The battery of HEV cannot be charged using plug-in devices. |
| PHEV | PHEVs are powered by a battery as well as an ICE. The battery can be charged through either regenerative breaking using the ICE or by plugging into some external charging source. PHEVs have a better range than BEVs but are comparatively less eco-friendly. |
| Hatchback | These are compact-sized cars with a hatch-type door provided at the rear end. |
| Sedan | These are usually two- or four-door passenger cars, with a separate area provided at the rear end for luggage. |
| SUV | Popularly known as SUVs, these cars come with four-wheel drive, and usually have high ground clearance. These cars can also be used as off-road vehicles. |
| MPV | These are multi-purpose vehicles (also called minivans) designed to carry a larger number of passengers. They carry between five and seven people and have room for luggage too. They are usually taller than the average family saloon car, to provide greater headroom and ease of access, and they are usually front-wheel drive. |
Need More Details on Market Definition?
Ask a Question
Research Methodology
Mordor Intelligence follows a four-step methodology in all its reports.
- Step-1: Identify Key Variables: To build a robust forecasting methodology, the variables and factors identified in Step-1 are tested against available historical market numbers. Through an iterative process, the variables required for market forecast are set and the model is built based on these variables.
- Step-2: Build a Market Model: Market-size estimations for the historical and forecast years have been provided in revenue and volume terms. Market revenue is calculated by multiplying the sales volume with their respective average selling price (ASP). While estimating ASP factors like average inflation, market demand shift, manufacturing cost, technological advancement, and varying consumer preference, among others have been taken into account.
- Step-3: Validate and Finalize: In this important step, all market numbers, variables, and analyst calls are validated through an extensive network of primary research experts from the market studied. The respondents are selected across levels and functions to generate a holistic picture of the market studied.
- Step-4: Research Outputs: Syndicated Reports, Custom Consulting Assignments, Databases & Subscription Platforms.

Get More Details On Research Methodology
Download PDF


