
Market Overview
| Study Period | 2020 - 2031 |
|---|---|
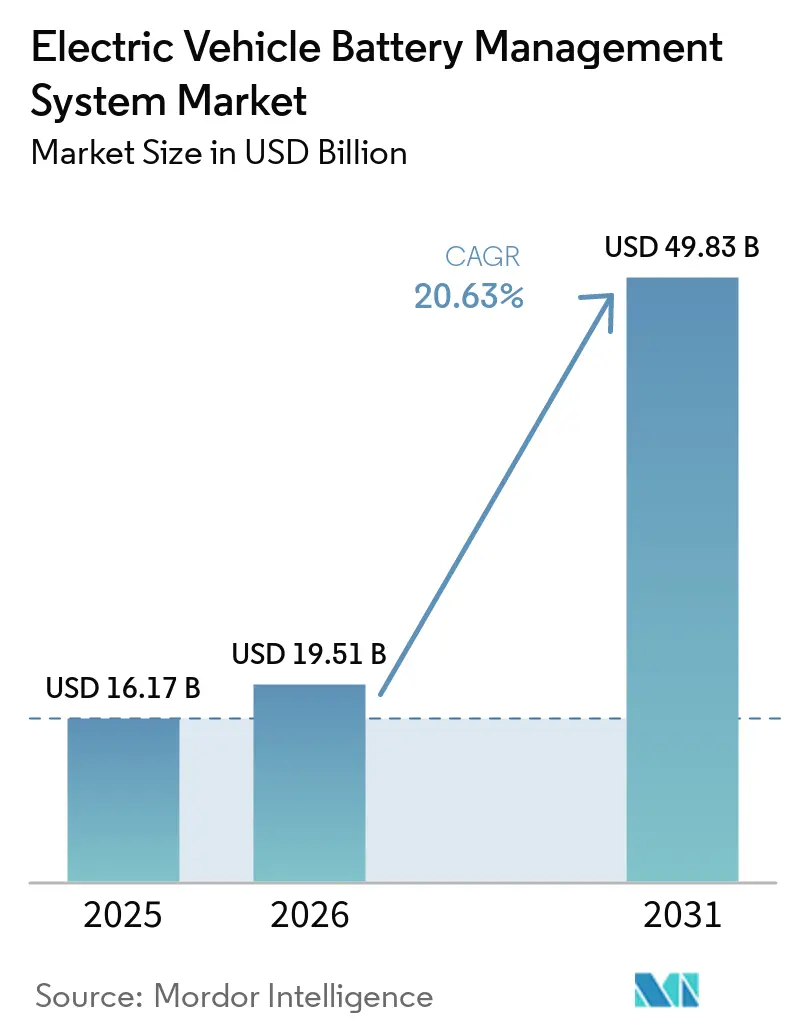
| Market Size (2026) | USD 19.51 Billion |
| Market Size (2031) | USD 49.83 Billion |
| Growth Rate (2026 - 2031) | 20.63 % |
| Fastest Growing Market | Middle East and Africa |
| Largest Market | Asia Pacific |
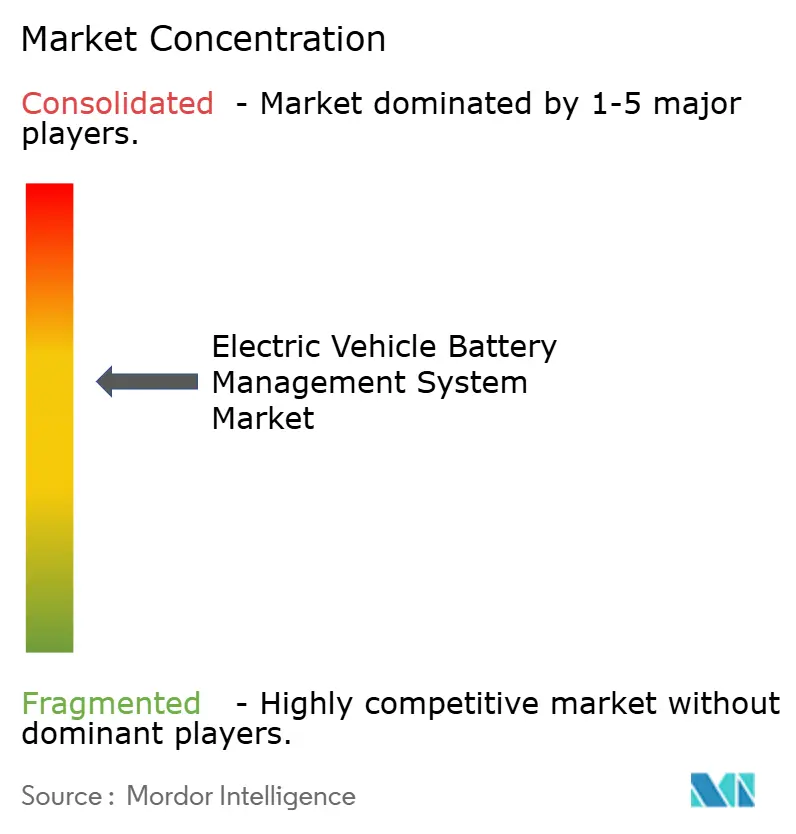
| Market Concentration | Medium |
Major Players *Disclaimer: Major Players sorted in no particular order Image © Mordor Intelligence. Reuse requires attribution under CC BY 4.0. | |
Electric Vehicle Battery Management System Market Analysis by Mordor Intelligence
Electric Vehicle Battery Management System Market size in 2026 is estimated at USD 19.51 billion, growing from 2025 value of USD 16.17 billion with 2031 projections showing USD 49.83 billion, growing at 20.63% CAGR over 2026-2031. Demand is powered by rapid vehicle electrification, falling lithium-ion cell prices, and regulations that now push every new electric model toward ASIL-D safety compliance. OEMs favour lighter wireless topologies that cut up to 90% of wiring, enable over-the-air updates and simplify pack service, while tier-one suppliers bundle cloud analytics so fleets can monitor battery health in real time. Declining semiconductor shortages, government incentive schemes, and energy-density gains to 400–500 Wh/kg further expand addressable volumes.
Key Report Takeaways
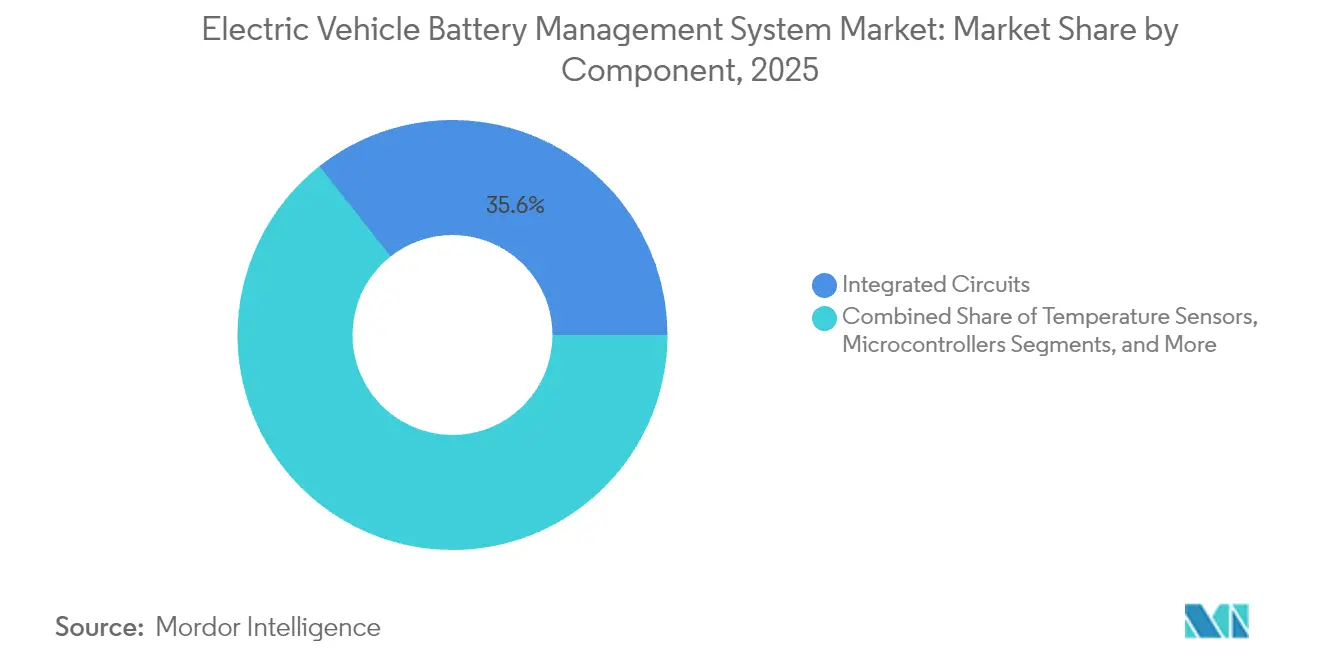
- By component, integrated circuits led with 35.62% revenue share in 2025; wireless communication ICs post the fastest growth at 21.05% CAGR to 2031.
- By battery chemistry, lithium-ion dominated with 87.35% of the battery management system market share in 2025, while solid-state batteries expand at 21.18% CAGR through 2031.
- By topology, modular systems held 42.55% of the battery management system market size in 2025; wireless architectures accelerate at 21.40% CAGR to 2031.
- By communication technology, wired CAN remained at 72.20% share in 2025; wireless RF registers 21.95% CAGR to 2031.
- By propulsion type, BEVs represented 67.80% revenue in 2025; FCEVs grow quickest at 21.30% CAGR.
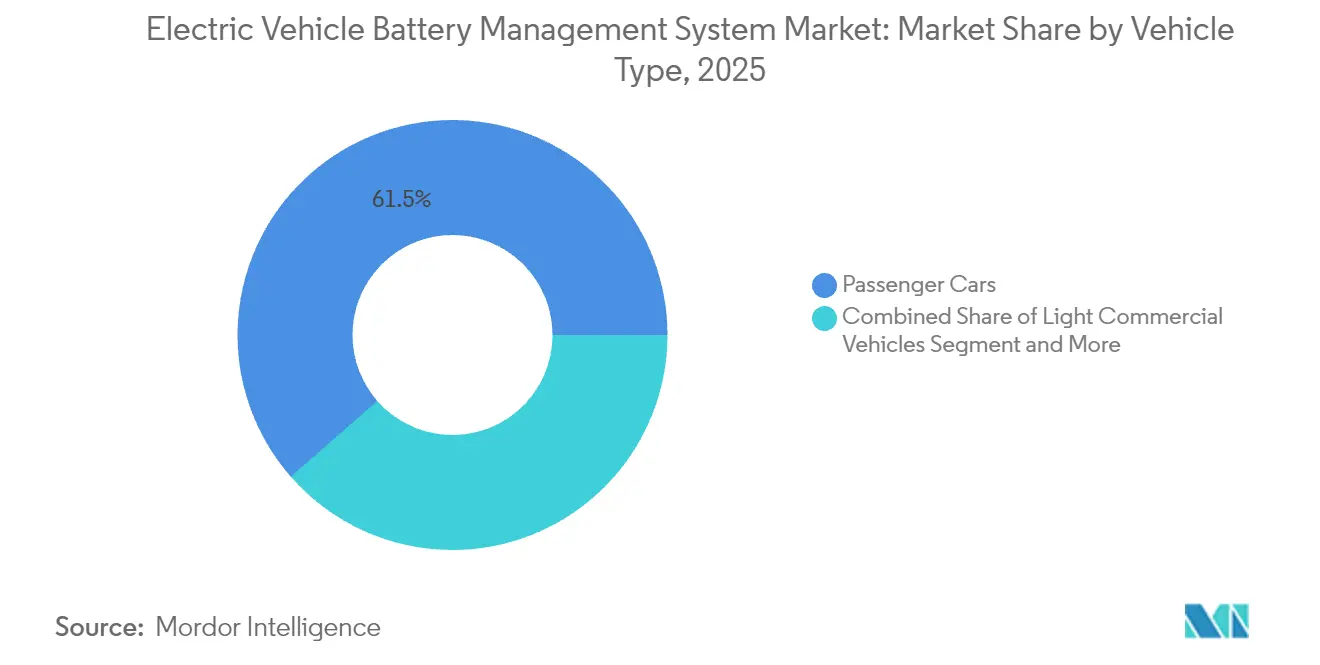
- By vehicle type, passenger cars accounted for 61.45% share of the battery management system market size in 2025; two-wheelers and micro-mobility gain 21.70% CAGR.
- By sales channel, OEM-fitted systems dominated with 84.60% in 2025; the retrofit channel climbs 21.80% CAGR to 2031.
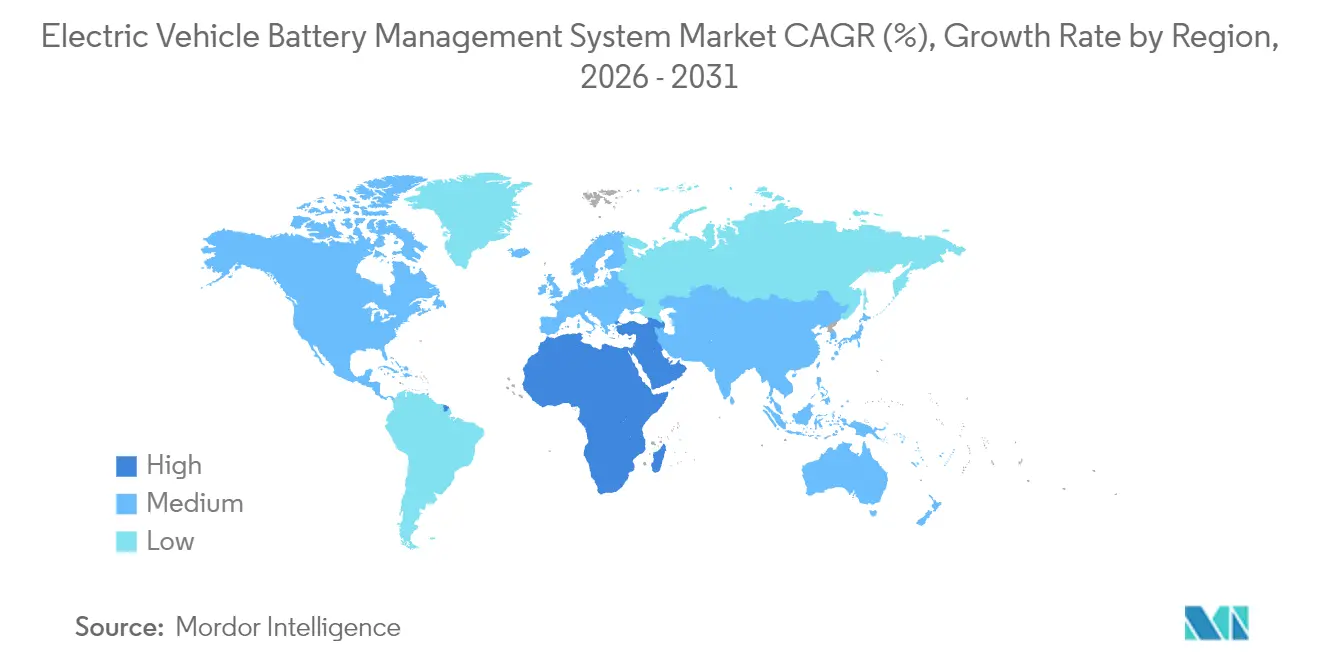
- By geography, Asia-Pacific controlled 47.10% revenue in 2025; the Middle East and Africa region delivers the strongest 21.25% CAGR to 2031.
Note: Market size and forecast figures in this report are generated using Mordor Intelligence’s proprietary estimation framework, updated with the latest available data and insights as of 2026.
Global Electric Vehicle Battery Management System Market Trends and Insights
Drivers Impact Analysis*
| Driver | (~) % Impact on CAGR Forecast | Geographic Relevance | Impact Timeline |
|---|---|---|---|
| Rapid Scale-up of Global EV Production | +4.2% | Global, with Concentration in China, Europe, North America | Medium term (2-4 years) |
| Declining Lithium-ion Battery Costs | +3.8% | Global, Particularly Benefiting Emerging Markets | Long term (≥ 4 years) |
| Stringent Safety Regulations | +3.1% | North America and EU, Expanding to APAC | Short term (≤ 2 years) |
| Government Incentives and Emissions Targets | +2.9% | Global, with Strongest Impact in China, EU, California | Medium term (2-4 years) |
| Shift Toward Wireless BMS Architectures | +2.7% | North America and EU Premium Segments, Scaling Globally | Medium term (2-4 years) |
| OEM Subscription-based Battery Analytics Services | +1.8% | North America and EU initially, Expanding to APAC | Long term (≥ 4 years) |
| Source: Mordor Intelligence | |||
Rapid Scale-up of Global EV Production Volumes
Global EV battery consumption hit 285.4 GWh in the first five months of 2024, a 23% year-on-year jump. This surge forces manufacturers to adopt modular battery management system market architectures so that a single design works across multiple vehicle platforms. Transitioning to 800 V and even 1,200 V packs obliges BMS vendors to upgrade monitoring precision, thermal models and fault isolation logic. General Motors adopted a wireless BMS on its Ultium platform to standardize packs while removing heavy harnesses. Automated BMS test rigs replace manual validation to meet higher production cadence, and suppliers bundle cloud dashboards so fleets can view cell-level data remotely.[1]
Declining Lithium-ion Battery Costs and Energy-density Gains
Pack prices fell fast enough that AI chips, cloud modems and precision current sensors now fit inside mainstream EV price points. Rising energy density from 250–300 Wh/kg toward 400–500 Wh/kg compresses more heat into smaller volumes, so BMS firmware must react within sub-millisecond windows to avoid thermal runaway. CATL’s 500 Wh/kg condensed cell highlights the need for ±1% state-of-charge accuracy and real-time state-of-health prediction. Lower cell costs free capex for advanced microcontrollers, giving suppliers room to integrate on-chip neural nets that learn degradation patterns in the field.
Stringent Safety Regulations Mandating Advanced BMS
ASIL-D now sits in most RFQs, so BMS boards double up voltage and temperature channels and place hardware security modules inside master controllers. Certification pushes smaller vendors out because documentation, FMEA work and audit cycles can add 18–24 months and lift budgets 30–50%. In return, compliance becomes a pricing moat: validated suppliers win higher share of the battery management system market despite the added cost burden.
Government Incentives and Emissions Targets Accelerating EV Uptake
The U.S. Inflation Reduction Act, EU CO₂ limits and China’s NEV policy funnel long-run demand signals into OEM planning cycles. Vehicle makers lock in BMS volume agreements two to three years ahead, giving integrated-circuit vendors forward-visibility. California’s eight-year 70% capacity rule, for example, requires state-of-health tracking so owners can claim warranty remedies. Infrastructure investment that reduces range anxiety in turn raises BEV penetration, which then cycles back into bigger annual orders for battery management system market products.[2]
Restraints Impact Analysis*
| Restraint | (~) % Impact on CAGR Forecast | Geographic Relevance | Impact Timeline |
|---|---|---|---|
| Semiconductor Shortages | -2.8% | Global, with Acute Impact in Automotive Supply Chains | Short term (≤ 2 years) |
| High Cost of ASIL-D Functional Safety | -2.1% | North America and EU primarily, Expanding Globally | Medium term (2-4 years) |
| Data-ownership Disputes | -1.5% | Global, with Concentration in Data-sensitive Regions | Medium term (2-4 years) |
| Stringent Cyber-security Certification Delaying Launches | -1.3% | North America and EU Leading, Expanding to APAC | Short term (≤ 2 years) |
| Source: Mordor Intelligence | |||
Semiconductor Shortages Inflating BMS IC Lead-times
Automotive-grade analog front ends and SiC gate drivers still face lead times beyond 52 weeks. Suppliers redesign boards to swap scarce dies for larger-geometry alternatives, yet those changes trigger fresh validation loops. Larger tier-ones leverage volume contracts while smaller firms queue, prompting industry consolidation. Scarcity spills into the battery management system market price stack because OEMs hold buffer stock that ties up working capital. Long-term capital expansion among foundries should ease pressure by late 2026, but uncertainty lingers around older 28 nm nodes that dominate powertrain electronics.
High Cost of ASIL-D Functional-safety Compliance
Reaching ASIL-D means exhaustive DFMEA, traceability audits and independent assessment. Programs often stretch an extra 18 months and lift spend by 30–50%. Smaller BMS specialists lack the headcount for redundant software teams and formal verification, so many either license reference designs or become acquisition targets. For those that succeed, compliance underpins premium margins and deepens customer loyalty, but development risk and certification backlog temper near-term supply in the battery management system market.[3]
*Our forecasts treat driver/restraint impacts as directional, not additive. The impact forecasts reflect baseline growth, mix effects, and variable interactions.
Segment Analysis
By Component: Integrated Circuits Drive Innovation
Integrated circuits commanded 35.62% of 2025 revenue, signalling how much value has moved onto silicon. High-accuracy analog front ends, microcontrollers with AI accelerators and RF transceivers now live on the same die, trimming board area and cost. Wireless communication ICs record a 21.05% CAGR because they facilitate modular packs and slash harness weight, escalating adoption across OEMs that release multiple battery platforms per model cycle.
System-on-chip designs that fuse analog acquisition, wireless networking and cryptographic blocks enable smaller boards and faster certification. The density improvement lifts reliability, while automated calibration on the production line lowers end-of-line test time. Vendors pair these chips with firmware libraries for ISO 26262 compliance, reducing development cycles for tier-ones. In parallel, external fuel-gauge ICs integrate 24-bit ADCs that push state-of-charge error to ±1%, essential for packs moving from 250 Wh/kg toward 500 Wh/kg. As a result, component innovation remains the heartbeat of the battery management system market.

By Battery Chemistry: Lithium-ion Dominance With Solid-state Emergence
Lithium-ion held 87.35% share in 2025, underpinning almost every EV program. Its mature supply base, known ageing profile and falling cost curve keep it entrenched. Solid-state technologies, however, post a 21.18% CAGR to 2031 because they promise higher volumetric energy and intrinsic safety. Nickel-based packs survive in industrial traction where low-temperature performance matters, while lead-acid still backs 12 V auxiliaries on some platforms. Flow batteries appear mainly in stationary storage, but the modular nature of their cells invites reuse of automotive BMS logic, letting vendors repurpose designs and widen their serviceable opportunities inside the battery management system industry.
Chemistry shifts alter sensing requirements. Solid-state eliminates liquid electrolyte checks yet raises sensitivity to stack pressure and interface defects, so next-generation BMS integrates pressure and acoustic sensors. Lithium-ion modules increasingly rely on machine-learning balance algorithms that extend cycle life. Suppliers with electrochemistry know-how win design-in because they tune firmware to each cathode composition. The pivot from NMC to LFP in cost-sensitive segments also changes voltage windows, pushing boards to adopt 16-bit micro-controllers that handle wider ADC ranges without losing resolution. All told, chemistry diversity keeps the battery management system market vibrant and open to newcomers with niche expertise.
By Topology: Modular Systems Enable Scalability
Modular designs secured 42.55% of 2025 revenue because they balance cost, redundancy and ease of manufacturing. Their board-per-module approach standardizes pack construction across vehicle classes and simplifies field service. Wireless architectures, rising at 21.40% CAGR, remove most low-voltage wiring and reduce pack build times, a decisive benefit for high-throughput plants. Centralized layouts still appeal for low-energy applications such as micro-mobility, where a single board is cheapest. Distributed topologies serve buses, trucks and stationary storage that need graceful degradation if any node fails.
The shift toward modular and wireless schemes supports second-life repurposing. Decommissioned automotive modules can slot into home storage systems with minimal rework because each module carries its own controller. OEMs also leverage the same modular tooling across sedans, SUVs and vans, cutting capital expenditure. In parallel, wireless pico-gateways inside each module enable over-the-air updates that fine-tune balancing or add new chemistries after sale. As a result, topology choice shapes not just cost but long-run revenue streams, embedding value beyond hardware in the battery management system market.
By Communication Technology: Wireless RF Disrupts Traditional Protocols
Wired CAN commanded 72.20% revenue in 2025. Its deterministic timing and 1 Mbit/s rate meet legacy pack needs and plug into existing toolchains. Yet wireless RF links expand at 21.95% CAGR because they slash harnesses, allow pack form-factor flexibility and support mesh self-healing. Automotive Ethernet gains niche appeal where full-resolution cell data streams into AI loggers for advanced prognostics. Each step up the bandwidth ladder coincides with new service potential: higher rates allow voltage and impedance signatures to be pushed to the cloud for digital-twin simulations, bolstering predictive maintenance earnings inside the battery management system market.
Security now drives protocol selection. ISO 21434 pushes encryption and authentication, so vendors embed hardware root-of-trust into transceivers. 2.4 GHz mesh chips integrate AES-256 engines and random-number generators to satisfy regulation. Redundant channels mitigate interference and maintain sub-100 μs latency needed for safety trips. Transition costs slow adoption in cost-down vehicle classes, yet component prices fall as volumes ramp, paving the path for crossover models to adopt wireless by 2027.
By Propulsion Type: BEVs Lead with FCEV Growth Potential
Battery-electric vehicles accounted for 67.80% revenue in 2025 because they rely solely on packs for traction. Fuel-cell electric vehicles see 21.30% CAGR as hydrogen refuelling infrastructure rolls out for heavy-duty fleets, giving BMS suppliers entry points into small buffer packs that manage transient loads. Hybrids and plug-in hybrids continue to ship in regions where charging grids lag yet emissions norms tighten; their BMS designs differ, focusing on rapid cycling and high power pulses rather than deep energy throughput. Each propulsion class pushes unique algorithm tweaks, encouraging modular code libraries that OEMs license across platforms.
FCEV BMS tasks include tight power-sharing with fuel-cell controllers and frequent rapid charging from regenerative braking. Safety demands remain high even though pack energy is lower because hydrogen systems must avoid thermal cross-talk. Vendors that can tailor architectures without expensive hardware redesign unlocking faster FCEV launches will grow their footprint within the battery management system market.
By Vehicle Type: Passenger Cars Dominate with Micro-mobility Acceleration
Passenger cars delivered 61.45% share in 2025, reflecting broad consumer subsidies and model variety. Two-wheelers and micro-mobility vehicles log a 21.70% CAGR through 2031, pushed by urban congestion policies and the rise of battery-swap networks. Their packs are smaller but manufactured by the millions, supporting demand for electric two wheeler battery management system solutions with cost-optimized single-chip designs and Bluetooth interfaces. Light commercial vans see steady orders as e-commerce insists on zero-emission last-mile fulfillment, raising the battery management system market size in duty-cycle-intensive segments.
Fleet operators ask for predictive analytics that guarantee eight-year pack life or 200,000 km service; BMS dashboards now integrate fleet management APIs. At the other end, heavy trucks and construction equipment order ruggedized boards that withstand vibration and higher ambient heat. Specialist niches such as mining vehicles seek intrinsically safe designs, while agricultural OEMs want cold-temperature resilience. These diversifying requirements fuel continuous innovation across the battery management system industry.
By Sales Channel: OEM Integration with Aftermarket Growth
OEM-installed solutions formed 84.60% of 2025 revenue as automakers bundle BMS boards during pack assembly to secure warranty integrity. Retrofits and aftermarket kits rise at 21.80% CAGR because owners look to upgrade early-generation EVs with new packs or extend range. Commercial fleets often swap degrading modules before a full vehicle refit, creating pull for drop-in BMS boards that learn existing cell chemistry without factory calibration. Second-life energy-storage integrators install stationary systems based on retired automotive packs, demanding BMS software that handles shallower depth of discharge and different thermal duty cycles.
Standardized connectors and auto-identification now allow plug-and-play swap boards, cutting installation time to under one hour. Regulatory inspection regimes, however, still favour OEM parts, so retrofit suppliers partner with certified workshops. The sales-channel mix therefore broadens but OEM dominance endures, reinforcing the high-volume base of the battery management system market.
Geography Analysis
Asia-Pacific retained 47.10% revenue in 2025. China’s cell giants CATL and BYD jointly shipped more than half of global batteries, anchoring a supply chain that extends from raw lithium processing to finished BMS assembly. Japan and South Korea supply precision semiconductors and software tools, while India hosts more than 60 local BMS firms that tailor boards to indigenous two-wheeler brands. Government funding through production-linked incentives and solid-state pilot lines keeps the battery management system market expanding at scale even as EV adoption in the region matures.
The Middle East and Africa post 21.25% CAGR, the fastest worldwide, because countries leapfrog traditional engine platforms. Ghana and Morocco promote two-wheeler electrification tied to solar micro-grids, spurring demand for affordable BMS single-board products. African start-ups collaborate with Asian IC vendors to design humidity-tolerant boards that handle rough roads and high ambient heat. Agency support lowers import duties on cell imports, so assemblers can focus capital on electronics that differentiate reliability. North America benefits from the Inflation Reduction Act, which links tax credits to local BMS content and cell sourcing. Chip-maker expansion in the United States pulls high-value analog front-end production closer to OEM plants, mitigating future supply shocks. Canada’s mining sector positions itself as a low-carbon nickel supplier, and Mexico’s assembly clusters attract tier-ones building pack lines with embedded wireless BMS. Europe concentrates on battery passports that require end-to-end traceability from 2026, pushing cloud-connected boards that stream life-cycle data into blockchain registries. Both regions grow steadily, yet Asia-Pacific scale advantages preserve its lead in the battery management system market.
Regulatory Landscape
Safety and cybersecurity requirements increasingly shape BMS hardware and software architectures across major EV markets. UNECE Regulation No. 100 Rev.3 (Part II) tightened rechargeable energy storage system testing, covering vibration, thermal shock, mechanical integrity, and over-current protection. Mandatory compliance for new type approvals begins in September 2023 and extends to all type approvals by September 2025, which pushes OEM RFQs toward higher diagnostic coverage and redundancy aligned with ISO 26262 ASIL-D practices.
Region-specific rules also add data and testing obligations that move the BMS from a control board into a compliance data node. In the EU, Regulation (EU) 2023/1542 (Battery Regulation) applies from August 18, 2024 and requires up-to-date data for parameters determining state of health and expected lifetime, supporting demand for cloud-connected and traceability-ready BMS implementations. In China, GB 38031-2025 for EV traction battery safety takes effect on July 1, 2026, adding thermal diffusion and impact-related tests that increase validation load and favor suppliers with established test capabilities. In the United States, EPA requirements under 40 CFR 86.1815-27 introduce battery-related provisions beginning with model year 2027, referencing GTR No. 22 expectations for rechargeable energy storage systems and strengthening the case for in-vehicle monitoring and documentation workflows.
Value Chain Analysis
The EV BMS value chain starts with upstream semiconductors (analog front ends, microcontrollers, isolation, and communication ICs), moves into software for SOC/SOH algorithms, diagnostics, and cybersecurity, then proceeds to Tier-1 integration (PCB assembly, pack-level validation, and functional safety documentation). Downstream, OEM pack assembly, vehicle integration, and lifecycle services such as OTA updates and fleet analytics complete the chain. Integrated circuits remain a major value capture point, while battery makers and vehicle OEMs increasingly shape requirements by coupling control logic to specific cell chemistries and pack form factors, particularly for 800 V-class architectures and wireless topologies that reduce harness complexity.
Midstream dynamics are also shifting toward vertical integration and service-enabled BMS deployments. In China, industry tracking in early 2026 highlighted consolidation and in-house supply trends, with CATL and FinDreams Battery leading BMS provision alongside accelerating automaker internalization. That pattern compresses opportunities for smaller independent module suppliers, but it also expands demand for automotive-qualified AFE/MCU platforms and safety-ready software stacks. Further downstream, quality incidents and extended warranty commitments increase the value of remote monitoring and diagnostic depth, lifting the role of cloud telemetry, pack traceability, and field analytics for Tier-1s and semiconductor ecosystem partners.
Competitive Landscape
The market shows moderate concentration. Top semiconductor suppliers Texas Instruments, Infineon Technologies and Analog Devices dominate analog front ends and micro-controllers; battery makers CATL, LG Energy Solution and BYD increasingly design in-house BMS to align cell chemistries with control logic. Infineon’s USD 2.5 billion purchase of Marvell’s automotive Ethernet unit deepens its stack by adding high-bandwidth networking IP to MCU and power modules, positioning it as a one-stop platform supplier. LG Energy Solution’s B.around software achieves above 90% anomaly-detection accuracy using AI, converting hardware installations into subscription revenue.
Roughly 325 start-ups target specialization such as pressure sensing for solid-state packs, sub-10 USD micro-mobility boards or cloud analytics for fleet optimization. Yet ASIL-D certification cost and silicon shortages spur consolidation; smaller firms license IP or exit. Tier-ones form alliances: Stellantis and Infineon’s Joint Power Lab builds standardized power architecture that folds BMS requirements into the wider vehicle domain controller.
Meanwhile, vehicle OEMs like General Motors prefer wireless topologies for platform reuse, granting early suppliers high-volume purchase orders that lock in design wins across multiple model years. Competitive differentiation thus rotates around integration depth, safety pedigree and data-service potential within the battery management system market.
Electric Vehicle Battery Management System Industry Leaders
-
Renesas Electronics Corporation
-
NXP Semiconductors
-
Analog Devices Inc.
-
Texas Instruments
-
Infineon Technologies
- *Disclaimer: Major Players sorted in no particular order
Market Opportunities and Future Outlook
Opportunities are clustering around compliance-driven intelligence, pack data infrastructure, and integration into broader vehicle power domains. In China, bringing GB 38031-2025 traction-battery safety into force from July 1, 2026 increases the need for faster fault detection, stronger thermal event management logic, and more intensive validation tooling. That creates whitespace for suppliers that can deliver ASIL-aligned architectures with test evidence and reusable safety documentation. At the same time, the EU Battery Regulation (EU) 2023/1542, applicable from August 18, 2024, reinforces demand for BMS platforms that can store and maintain up-to-date state-of-health and lifetime-related parameters, supporting embedded logging, secure communications, and lifecycle traceability workflows.
Technology headroom is widening for advanced diagnostics and simplified wiring as OEMs look for lighter packs and more detailed health prediction. Texas Instruments introduced the BQ79826Z-Q1 in June 2026 with an integrated electrochemical impedance spectroscopy (EIS) engine, pointing toward cell-level internal health signals moving onto automotive-qualified silicon and into production-ready BMS designs. Vehicle-side consolidation also creates design-in points, such as Geelys July 2026 unveiling of its Thunder 16-in-1 electric drive system that integrates battery management software into a power domain unit. This increases the emphasis on software portability, cybersecurity, and defined interfaces between BMS sensing layers and centralized compute. Additional whitespace exists in low-voltage and auxiliary applications, where BMS capabilities are expanding beyond traction packs, highlighted by FORVIA HELLA launching a 12-volt lithium-ion battery pack with integrated low-voltage battery management in July 2026.
Recent Industry Developments
- June 2026: Texas Instruments introduced the BQ79826Z-Q1 battery monitor with an integrated electrochemical impedance spectroscopy (EIS) engine for real-time internal cell diagnostics. By embedding impedance-based health signals in automotive-qualified monitoring silicon, the launch strengthens the product stack for predictive state-of-health and fast-charge safety use cases in EV packs.
- April 2025: Infineon Technologies completed its acquisition of Marvell Technology's Automotive Ethernet business for USD 2.5 billion. The addition of high-bandwidth automotive networking IP supports more data-rich, connected BMS architectures and aligns with the shift toward centralized compute and secure in-vehicle communications.
- September 2024: LG Energy Solution launched B.around, an AI-driven battery management service reporting more than 90% safety-event detection accuracy for automakers. The release pushed BMS differentiation further into software analytics and subscriptions, encouraging tighter coupling of pack telemetry, anomaly detection, and fleet monitoring workflows.
Research Methodology Framework and Report Scope
Market Definition and Coverage
This market covers revenue generated from battery management systems used in electric vehicles to monitor, protect, and balance battery packs, including the core electronics and sensing elements that support safe charging, discharging, and thermal control.
Scope exclusions: We exclude battery cells and packs, external charging equipment, and standalone vehicle control units that do not perform BMS functions.
Segmentation Overview
- By Component
- Integrated Circuits
- Cut-off FETs and Drivers
- Temperature Sensors
- Fuel-Gauge/Current-Measurement Devices
- Microcontrollers
- Communication Interface ICs
- Other Components
- By Battery Chemistry
- Lithium-ion
- Solid-state
- Nickel-based
- Lead-acid
- Flow Batteries
- By Topology
- Centralized
- Modular
- Distributed
- Wireless (Cable-less)
- By Communication Technology
- Wired CAN
- Wired Ethernet
- Wireless RF
- By Propulsion Type
- Battery Electric Vehicles (BEV)
- Hybrid Electric Vehicles (HEV)
- Plug-in Hybrid Vehicles (PHEV)
- Fuel-Cell Electric Vehicles (FCEV)
- By Vehicle Type
- Passenger Cars
- Light Commercial Vehicles
- Medium and Heavy Commercial Vehicles
- Two-Wheelers and Micro-mobility
- Off-highway and Specialty Vehicles
- By Sales Channel
- OEM-fitted
- Aftermarket/Retrofit
- By Geography
- North America
- United States
- Canada
- Rest of North America
- South America
- Brazil
- Argentina
- Rest of South America
- Europe
- Germany
- United Kingdom
- France
- Italy
- Spain
- Russia
- Rest of Europe
- Asia-Pacific
- China
- India
- Japan
- South Korea
- Australia and New Zealand
- Rest of Asia-Pacific
- Middle East and Africa
- United Arab Emirates
- Saudi Arabia
- Turkey
- South Africa
- Egypt
- Rest of Middle East and Africa
- North America
Data Sources, Market Sizing, and Validation
Desk Research
Desk research was used to set the EV demand context and keep assumptions tied to public signals that can be checked. We reviewed EV production and registration indicators, battery supply chain context, and safety and performance requirements that influence BMS content per vehicle.
Key public sources used for direction included materials such as IEA EV outlook datasets, US DOE and NREL publications on batteries and vehicle electrification, UN Comtrade trade statistics for electronics categories, and standards and guidance from ISO and SAE, plus research articles indexed in peer-reviewed engineering journals. We also reviewed company filings and investor presentations to understand product positioning and revenue mix cues, along with reputable press and association websites for program timelines. To tighten a few inputs, we referenced paid subscriptions for company financials and patent databases, using them only to cross-check what was already visible through public sources. The list of desk research sources mentioned here is not exhaustive, and we referred to other sources for data collection, validation, and research clarification.
Primary Interviews and Surveys
Primary work focused on confirming what is counted as an EV BMS sale, how content differs across BEVs and HEVs, and how pricing shifts with higher-voltage platforms and added sensing requirements. We spoke with a mix of BMS value-chain participants and informed buyers, and the discussions were spread across APAC, EMEA, and the Americas so we could test regional build plans and localization effects before finalizing the model.
Distribution of primary research fieldwork respondents
| Company type | Respondent position | Region |
|---|---|---|
| Top tier: 28% | CXOs: 12% | APAC: 45% |
| Mid tier: 55% | Functional/Unit leaders: 43% | EMEA: 30% |
| Smaller Players: 17% | Managers: 45% | Americas: 25% |
Market-Sizing & Forecasting
Our sizing starts from a top-down demand pool built around EV output by region and propulsion type. We then convert that into BMS value using attach rates and a realistic content-per-vehicle view. Where data was patchy, the model stayed practical by using ranges for BMS content and narrowing them through interview feedback and publicly visible platform direction.
Several market fingerprints were used as inputs, including BEV versus HEV production mix, average battery pack voltage progression, battery pack capacity trends that affect sensing and balancing needs, BMS hardware content split (for example microcontrollers, sensors, and power devices), and typical BMS pricing movements as integration increases. Results were corroborated with selective bottom-up checks, including sampled ASP times unit volumes for key EV cohorts and channel checks on how BMS is sourced at the vehicle level. When coverage gaps remained for smaller programs, we used conservative proxy pricing based on similar vehicle classes, then rechecked the impact at the regional total.
For forecasting, scenario analysis was used so adoption curves for electrified vehicles, platform shifts, and price pressure could be reflected without forcing one single trajectory. The final forecast path was then aligned with what interviewees expected for EV build plans, higher voltage rollouts, and the pace at which BMS functionality moves from basic protection toward more advanced monitoring.
Data Validation & Update Cycle
Outputs were cross-checked against independent signals, including EV production trends, battery supply chain build-outs, and implied BMS value per vehicle by major region. Any outliers were investigated before sign-off. We also ran variance checks across propulsion types and vehicle types to ensure totals did not drift away from what is reasonable for hardware content and pricing in each cohort.
Before publication, the model and key assumptions go through multi-step analyst reviews. Follow-up outreach is triggered when interview feedback conflicts with desk findings or when a large regional swing appears. Reports are refreshed annually, with interim updates when material events occur, and a final pre-delivery pass is completed so clients receive the latest updated view.
Mordor Intelligence's Electric Vehicle Battery Management System Market Estimate Compared With Other Published Estimates
Published market values for EV battery management systems can vary, even when the topic name looks identical. The biggest differences usually come from what is counted inside the BMS revenue line, which vehicle types are included, and how pricing is handled as platforms move to higher voltage and larger packs.
A second set of gaps comes from how the demand pool is constructed and refreshed, including whether the model is tied to EV production by propulsion type, whether HEVs are included consistently, and how currency conversion timing is handled when regional totals are rolled up. In this study, the sizing stays aligned to the BMS component scope and attaches value to vehicles through production and content assumptions that are then stress-tested through interviews, which is a modeling choice applied by Mordor Intelligence.
Benchmark comparison
| Source | Market Size | Gaps in Research Methodology |
|---|---|---|
| Mordor Intelligence | USD 19.51 B (2026) | |
| Media Outlet A | USD 7.20 B (2026) | This figure is commonly presented as an EV BMS outlook but often reflects a narrower monetization view that undercounts HEV-related demand and does not fully translate higher pack voltage and capacity into higher BMS content per vehicle. |
| Industry Report Digest B | USD 11.77 B (2026) | This estimate tends to use a shorter forecast window and a broader product grouping, which can compress the 2026 value if pricing is averaged across mixed BMS architectures and if EV production inputs are not reconciled by region and propulsion type. |
Overall, the spread is mainly explained by differences in scope and by how EV output is converted into BMS revenue, rather than by one single assumption. By keeping the steps traceable from EV production to BMS content and then validating pricing and attach rates with industry feedback, we aim to provide a number that is reproducible and can be updated as new vehicle and platform signals emerge.
Key Questions Answered in the Report
What is the current size of the battery management system market?
The market reached USD 19.51 billion in 2026 and is projected to rise to USD 49.83 billion by 2031 at 20.63% CAGR.
Which component segment leads the battery management system market?
Integrated circuits led with 35.62% revenue share in 2025, reflecting their central role in cell monitoring and control.
Why are wireless BMS architectures important?
Wireless designs eliminate up to 90% of wiring, cut pack assembly time and enable over-the-air updates, driving a 21.40% CAGR to 2031.
Which region is the fastest-growing for battery management systems?
The Middle East and Africa record the highest 21.25% CAGR because of aggressive electrification policies and green-energy investments.
How do safety regulations influence BMS design?
Standards such as UN ECE R100-Rev3 and ISO/SAE 21434 require ASIL-D functional safety and cybersecurity, leading to redundant sensing and encrypted communications.
What is driving aftermarket demand for BMS solutions?
Owners and fleets seek to upgrade early EVs, extend vehicle life and repurpose retired packs for stationary storage, resulting in a 21.80% CAGR for retrofit systems.