
Electric Traction Motor Market Size and Share
Market Overview
| Study Period | 2021 - 2031 |
|---|---|
| Market Size (2026) | USD 17.35 Billion |
| Market Size (2031) | USD 26.33 Billion |
| Growth Rate (2026 - 2031) | 8.70 % |
| Fastest Growing Market | Asia Pacific |
| Largest Market | Asia Pacific |
| Market Concentration | Medium |
Major Players *Disclaimer: Major Players sorted in no particular order Image © Mordor Intelligence. Reuse requires attribution under CC BY 4.0. | |
Electric Traction Motor Market Analysis by Mordor Intelligence
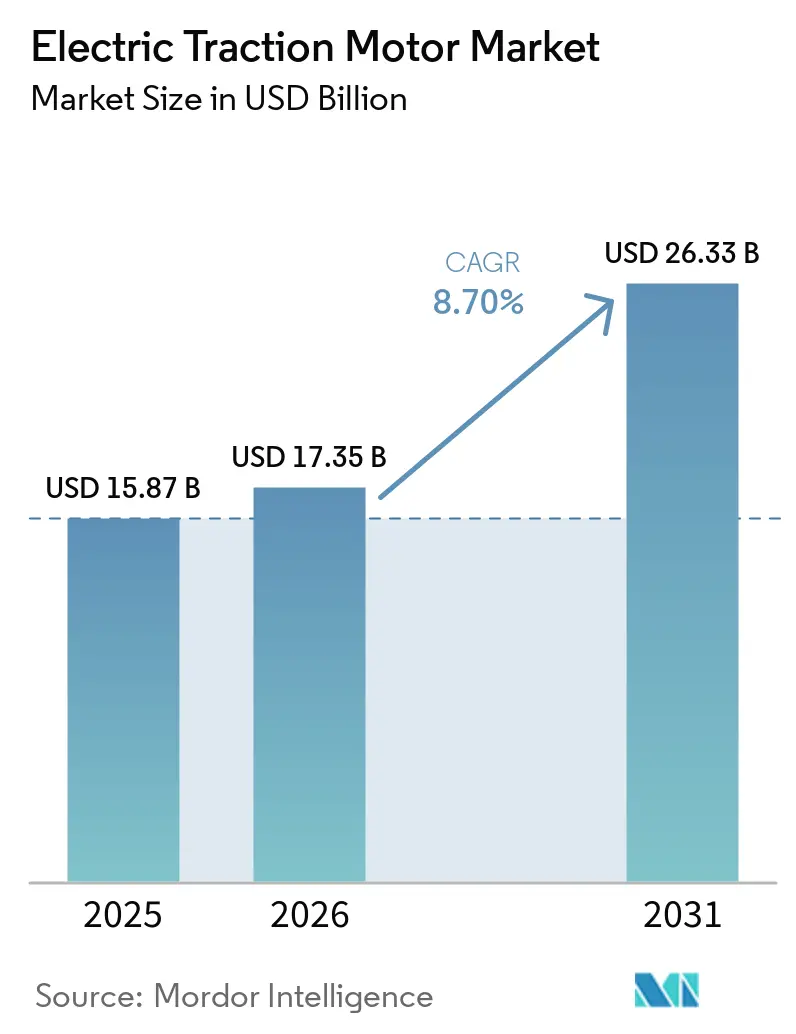
The Electric Traction Motor Market size was valued at USD 15.87 billion in 2025 and is estimated to grow from USD 17.35 billion in 2026 to reach USD 26.33 billion by 2031, at a CAGR of 8.70% during the forecast period (2026-2031).
The growth path reflects rapid rail electrification programs in Asia-Pacific, the spread of 800-volt automotive platforms, and the fast adoption of silicon-carbide inverters that let designers cut motor weight below 70 kilograms without losing torque density. Rising price pressure on rare-earth magnets has eased after new mining capacity in Australia and the United States, while localization mandates in the European Union and India continue to pull new factories closer to end markets. Competition is shifting as premium vehicle makers bring e-axle production in-house, prompting incumbent suppliers to move into higher power and service-oriented niches. Thermal management above 400 kilowatts, uneven rail procurement cycles in South America, and slow rare-earth recycling roll-outs in Europe remain near-term brakes on the electric traction motor market.
Key Report Takeaways
- By type, alternating-current motors held 65.3% revenue share in 2025, and the same is expanding at a 12.1% CAGR through 2031.
- By application, the railway captured 45.4% of the electric traction motor market size in 2025, whereas electric vehicles are advancing at a 15.8% CAGR to 2031.
- By cooling method, air-cooled units led with 59.6% share of the electric traction motor market size in 2025; liquid-cooled systems record the highest projected CAGR at 11.3% through 2031.
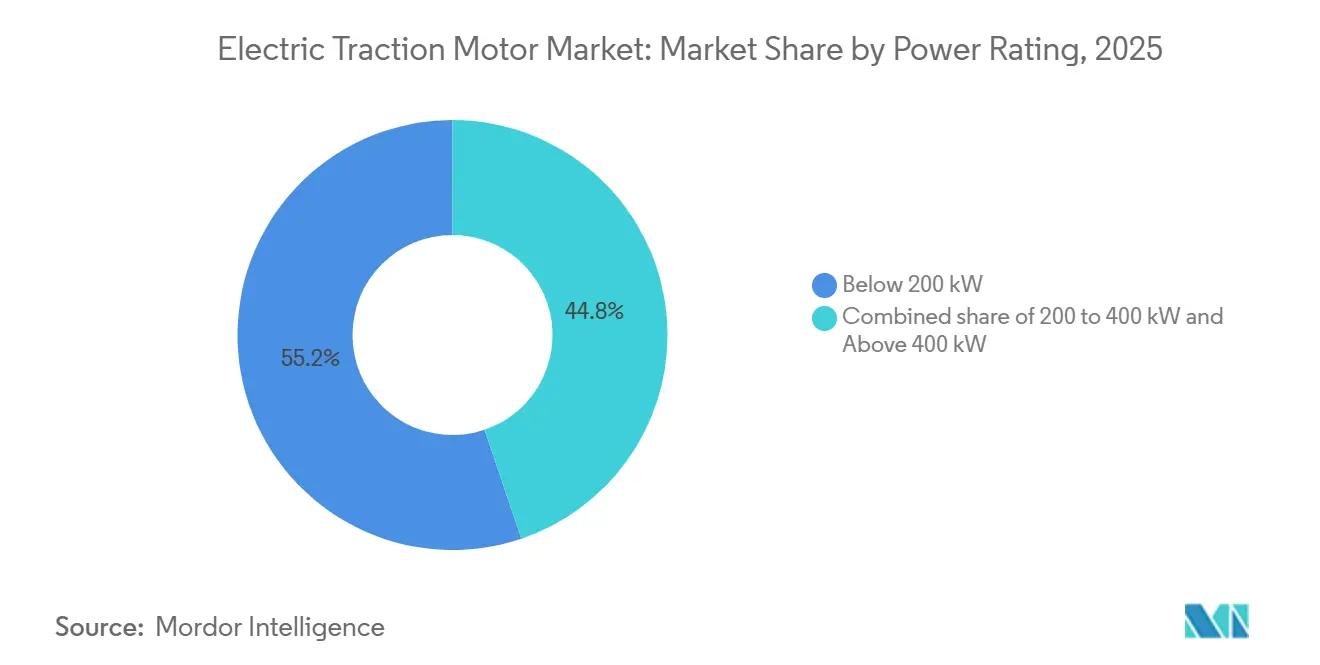
- By power rating, sub-200-kilowatt motors accounted for a 55.2% share of the electric traction motor market size in 2025, while the 200-kilowatt to 400-kilowatt band is forecast to grow at a 10.2% CAGR.
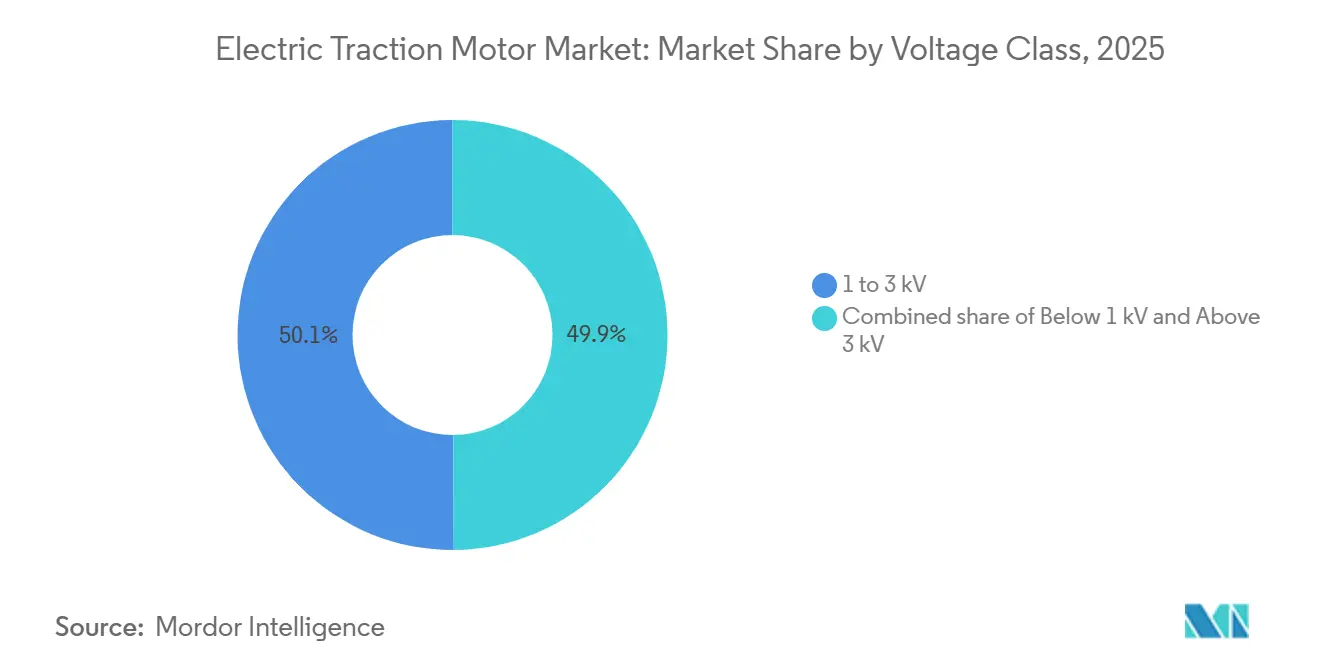
- By voltage class, the 1-kilovolt to 3-kilovolt segment commanded a 50.1% share in 2025; the sub-1-kilovolt class posts the fastest growth at a 10.4% CAGR through 2031.
- By geography, Asia-Pacific led with 49.5% electric traction motor market share in 2025 and is projected to post a 10.0% CAGR, outpacing Europe and North America.
Note: Market size and forecast figures in this report are generated using Mordor Intelligence’s proprietary estimation framework, updated with the latest available data and insights as of January 2026.
Market Trends and Insights
Drivers Impact Analysis of Electric Traction Motor Market*
| Driver | (~) % Impact on CAGR Forecast | Geographic Relevance | Impact Timeline |
|---|---|---|---|
| Surge in High-Speed Rail Electrification Projects Across Asia | 2.1% | Asia-Pacific core, spill-over to Middle East | Medium term (2-4 years) |
| OEM Shift Toward In-House e-Axle Integration Using 800-V Traction Motors in Premium EVs | 1.8% | Global, led by Europe & North America | Short term (≤ 2 years) |
| Adoption of Silicon Carbide (SiC) Inverters Enabling Higher-Frequency Motors Below 70 kg | 1.5% | Global | Short term (≤ 2 years) |
| Government-Backed Localisation Mandates for Motor Manufacturing in India and EU CBAM | 1.3% | India, European Union | Medium term (2-4 years) |
| Rapid Decline in NdFeB Magnet Prices Post-China Supply Diversification | 1.2% | Global, early gains in North America & Australia | Long term (≥ 4 years) |
| Source: Mordor Intelligence | |||
Surge in High-Speed Rail Electrification Projects Across Asia
Governments in China, India, and Southeast Asia are accelerating high-speed rail corridors to lower aviation emissions and ease highway congestion. China’s CR450 prototype entered trial runs in 2025 at 400 kilometers per hour using permanent-magnet motors that add 22 megawatts of continuous power over the CR400 platform.[1]Railway Gazette International, “CR450 Sets New Benchmark in High-Speed Rail Trials,” railwaygazette.com India’s Mumbai–Ahmedabad corridor is ordering 24 trainsets that carry 305-kilowatt motors per axle for delivery by 2028. Japan’s N700S expansion uses silicon-carbide inverters that trim traction energy by 7% relative to legacy systems. Thailand, Malaysia, and Indonesia have open tenders that reward suppliers able to localize assembly under IEC 60349 rules.
OEM Shift Toward In-House 800-V E-Axle Integration in Premium EVs
Premium automakers are adopting e-axle design to secure thermal control, software optimization, and bill-of-materials savings. BMW’s Gen6 eDrive reduced system mass by 30 kilograms and lifted efficiency to 93% across the duty cycle in models launched during 2024.[2]BMW Group, “Gen6 eDrive Technology Briefing,” bmwgroup.com Volkswagen’s unified e-axle platform, produced at Kassel and Salzgitter, targets a 15% cost cut and pushes over-the-air calibration updates across multiple brands. Stellantis committed EUR 500 million to produce 800-volt motors in France for 1 million units yearly by 2027.
Adoption of Silicon-Carbide Inverters for Sub-70 kg Motors
Silicon-carbide devices switch above 20 kilohertz, letting engineers downsize magnetic cores and copper windings. Wolfspeed’s 1,200-volt MOSFET modules reach inverter efficiencies of 98.5% at up to 175 °C junction temperature.[3]Wolfspeed, “1200 V SiC Power Module Roadmap,” wolfspeed.com Mitsubishi Electric’s full-SiC inverters on the E956 test train delivered a 10% energy cut and a 20% weight drop in 2024. Marelli and Fraunhofer unveiled a 400-volt SiC module housed within four liters, targeting space-constrained A- and B-segment cars.
Government-Backed Localization Mandates in India and EU CBAM
India’s Production Linked Incentive scheme reimburses up to 13% of incremental sales for locally produced traction motors and related parts, driving new green-field capacity.[4]Press Information Bureau of India, “PLI Scheme for Auto Components,” pib.gov.in Tata Motors opened a Sanand plant able to ship 500,000 motors each year by 2027. Europe’s Carbon Border Adjustment Mechanism begins full enforcement in 2026 and raises landed costs of imported motors by up to 12%, prompting Siemens and ABB to add lines in Poland and Romania.
Restraints Impact Analysis of Electric Traction Motor Market*
| Restraint | (~) % Impact on CAGR Forecast | Geographic Relevance | Impact Timeline |
|---|---|---|---|
| Limited Rare-Earth Recycling Infrastructure Constraining Permanent-Magnet Motor Supply in Europe | -0.9% | Europe, spill-over to North America | Medium term (2-4 years) |
| Thermal Management Challenges Above 400 kW in Compact EV Platforms | -0.7% | Global, acute in premium EV segment | Short term (≤ 2 years) |
| Fragmented Rail Procurement Cycles Causing Lumpy Demand in South America | -0.5% | South America, primarily Brazil & Argentina | Medium term (2-4 years) |
| High Certification Costs under EN 45545-2 Fire Safety for Rail Traction Motors | -0.4% | Europe, extending to export markets | Long term (≥ 4 years) |
| Source: Mordor Intelligence | |||
Limited Rare-Earth Recycling Infrastructure Constraining Permanent-Magnet Motor Supply in Europe
Recycling plants in Europe process less than 2% of end-of-life motor magnets. Solvay’s pilot facility in France handled only 50 tons in 2024. The Critical Raw Materials Act calls for 15% recycled content by 2030, yet collection and sorting networks remain fragmented. Metrea opened a 1,200-ton plant in Belgium in 2025, but is ramping slowly due to inconsistent feedstock quality.
Thermal Management Challenges Above 400 kW in Compact EV Platforms
Motors above 400 kilowatts generate heat that air or jacket cooling cannot expel inside tight passenger-car engine bays. BorgWarner’s direct-oil system adds an extra pump and exchanger, lifting the cost by USD 150-200 per motor. Laboratory tests show rotor hotspots above 180 °C demagnetize neodymium segments without dysprosium doping. Porsche’s Taycan relies on motor derating to 320 kilowatts for continuous output.
*Our forecasts treat driver/restraint impacts as directional, not additive. The impact forecasts reflect baseline growth, mix effects, and variable interactions.
Electric Traction Motor Market Segment Analysis
By Type:
Permanent-Magnet Synchronous Dominance Drives AC LeadershipAlternating-current machines held 65.3% of the electric traction motor market share in 2025 and are advancing at a 12.1% CAGR on the back of permanent-magnet synchronous designs that exceed 96% peak efficiency. Model 3, BYD Seal, and many rail sets rely on these high-density rotors. Induction units still serve industrial hoists and freight locomotives because they shrug off voltage transients and need little maintenance. Switched-reluctance motors attract cost-sensitive buyers by removing magnets, although torque ripple keeps them out of luxury models.
Direct-current machines fill legacy metro cars and niche drones where simple control outweighs efficiency loss. Brushed units in Delhi Metro’s early phases will be swapped for AC drives by 2027. Brushless DC propulsors power eVTOL aircraft such as Joby’s S4, where low weight and smooth thrust are critical. As more operators retrofit aging fleets with variable-frequency drives, the AC segment is slated to widen its lead.
By Power Rating:
Sub-200 kW Segment Anchors Volume, Mid-Range AcceleratesSub-200-kilowatt motors commanded a 55.2% share of the electric traction motor market size in 2025. Predictable urban duty cycles let ride-sharing operators deploy standardized motor platforms, boosting the automotive traction motor market size among low-power classes. Passenger cars and light rail favor this range because cost and packaging take priority. Economies of scale stem from annual automotive volumes above 10 million units. The 200-kilowatt to 400-kilowatt bracket is set to rise at a 10.2% CAGR as delivery vans, buses, and medium trucks electrify. Volvo’s FH Electric combines twin 250-kilowatt units to match diesel payloads.
Motors above 400 kilowatts remain a premium niche, under 10% of shipments, yet command high margins under IEC 60349 certification rules. CRRC’s CR400 trainset uses eight 550-kilowatt motors for 350 kilometers per hour service. Demand for continuous high power without derating is steering commercial fleets toward dual-motor layouts rather than single ultra-high-power units.


By Cooling Type:
Liquid Systems Gain as Power Density ClimbsAir-cooled units led with 59.6% share in 2025, dominating sub-100 kilowatt classes where forced ventilation suffices. Nissan’s Leaf e+ shows that a 2% efficiency trade-off is acceptable when avoiding coolant plumbing. Liquid cooling is expanding fastest at an 11.3% CAGR. Direct-oil circuits extract heat 40% better than water-glycol jackets and allow densities above 5 kilowatts per kilogram. Dana’s Sumo HP reaches 6.2 kilowatts per kilogram for Class 8 trucks.
Self-ventilated motors hold pockets in industrial conveyors where ambient temperatures stay moderate. Nevertheless, rising continuous-power targets in premium EVs and new high-speed trains are shifting the pendulum toward liquid cooling despite higher bill-of-materials cost.
By Voltage Class:
Sub-1 kV Surges on EV Adoption, Rail Anchors Mid-RangeThe 1-kilovolt to 3-kilovolt class held 50.1% of the electric traction motor market size in 2025, reflecting entrenched rail standards such as 1.5 kilovolts DC and 3 kilovolts DC; many rail networks also operate at 25 kilovolts AC. Below 1 kilovolt, motors are growing at a 10.4% CAGR as automakers standardize 400-volt and 800-volt packs. Porsche’s 800-volt system cuts charging to 18 minutes and trims copper mass by a quarter. Hyundai’s E-GMP suits 160- to 430-kilowatt units across multiple models.
Ratings above 3 kilovolts live mainly in high-speed rail and freight locomotives. Alstom’s Avelia Horizon for Amtrak runs sixteen 1.6-megawatt motors optimized for 25 kilovolt grids. Automotive economies of scale continue to push sub-1 kilovolt architectures toward higher voltage within that bracket, aiming to cut resistive losses without breaking current safety norms.
By Application:
Railway Dominates Revenue, EVs Lead GrowthRailway accounted for 45.4% of the electric traction motor market share in 2025, thanks to multi-decade contracts and high unit values. One high-speed trainset can need up to 48 motors. Electric vehicles, in contrast, are the volume engine, expanding at 15.8% CAGR as battery prices fall and carbon limits tighten. China sold 9.5 million passenger EVs in 2024, up 35% year on year.
Industrial machinery, including cranes and mining trucks, records steadier but lower growth. Konecranes fits four 75-kilowatt motors in each automated guided vehicle to raise uptime in ports. Emerging uses such as drones and eVTOL aircraft remain small yet draw venture capital.
Geography Analysis
APAC Electric Traction Motor Market
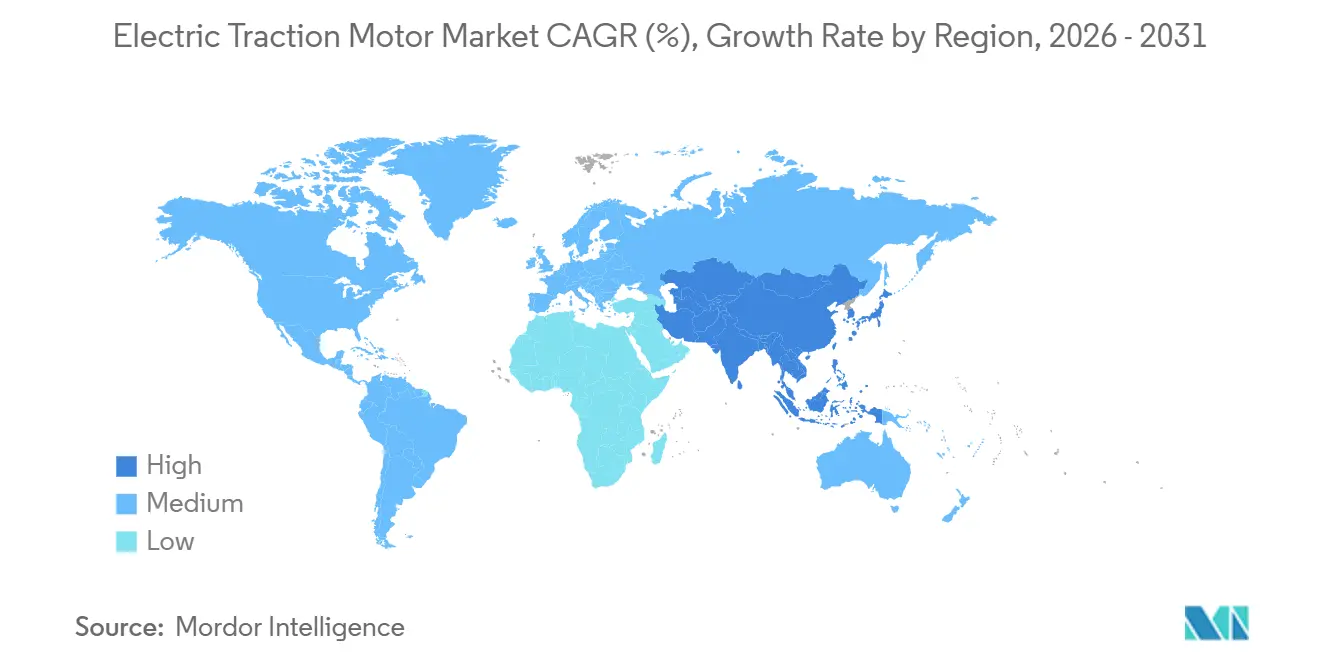
Asia-Pacific led the electric traction motor market with 49.5% share in 2025 and is on track for a 10.0% CAGR. China’s CR450 testing employed permanent-magnet motors rated at 550 kilowatts per axle and moved into revenue trials on the Beijing–Shanghai line in late 2025. India reserved USD 3.5 billion for advanced components under its PLI plan, unlocking large domestic capacity additions. Japan’s rail operators are retrofitting silicon-carbide inverters to cut energy by up to 10%. ASEAN metro tenders now specify local assembly clauses, opening room for joint ventures.
Europe Electric Traction Motor Market
Europe keeps the second-largest share. The Carbon Border Adjustment Mechanism, which starts full enforcement in 2026, adds 8-12% cost on motors shipped from outside the bloc. Volkswagen ramped in-house capacity to 1.2 million motors per year by the end of 2025. Germany, France, and Italy are converting diesel loco fleets to battery-electric for branch lines, giving traction to modular retrofit kits.
The Americas and MEA Electric Traction Motor Market
North America is adding plants in Mexico and the southern United States. GM’s joint venture with LG is targeting 1 million motors a year by 2027. Tesla’s Texas factory shipped 1.8 million units in 2024. Freight rail trials use four 500-kilowatt motors in Wabtec’s FLXdrive locomotive. South American demand remains cyclical, and the Middle East and Africa still account for modest volume, with Saudi Arabia’s Riyadh Metro providing the main near-term lift.

Regulatory Landscape
Electric traction motors for rail and road vehicles are covered through traction-specific testing and performance frameworks, with the IEC 60349 series commonly referenced for rail traction electrical equipment, distinct from general rotating-machine standards such as IEC 60034. In 2026, IEC published IEC 60034-1:2026 (15th edition) for rotating electrical machines (excluding rail and road traction motors), which reinforces the separation between industrial motor compliance pathways and traction-motor qualification regimes.
For adjacent motor categories that influence designs, documentation, and factory test systems used by traction-motor manufacturers, regulators are also tightening efficiency and product-scope requirements. In the United States, the Department of Energy issued a final rule in January 2025 setting updated energy conservation standards for expanded scope electric motors (ESEMs), with mandatory compliance starting January 1, 2029. In the European Union, the European Commission is reviewing Regulation (EU) 2019/1781 on ecodesign requirements for electric motors and variable speed drives, with stakeholder consultations running through mid-2026 and further engagement planned for late 2026, while the ecodesign regime has been in force since July 2021 with IE-class efficiency thresholds linked to power ratings.
Competitive Landscape
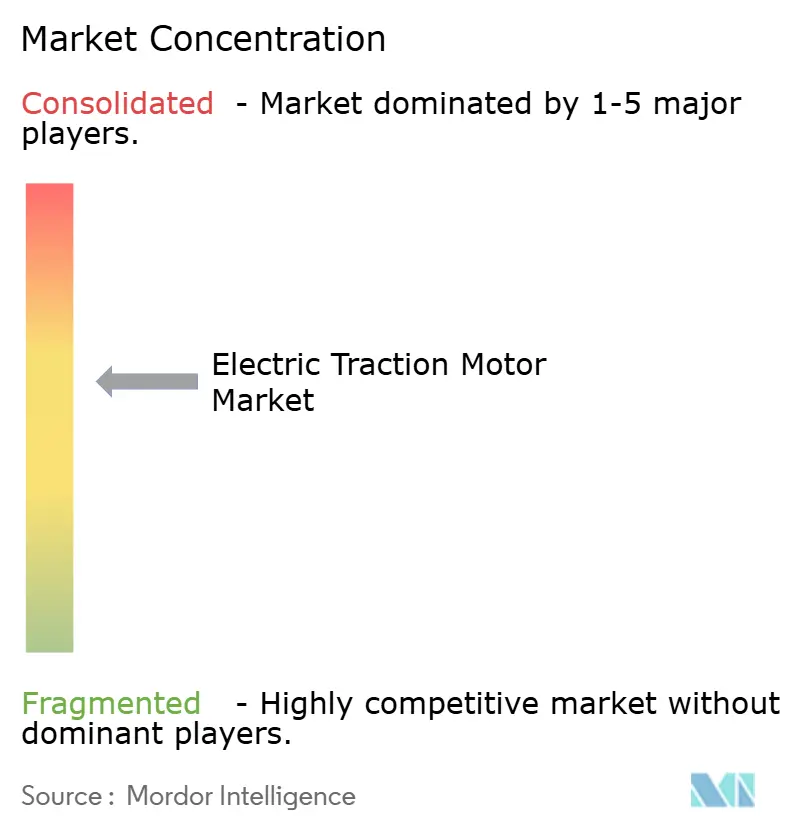
The top five suppliers, ABB, Siemens, CRRC, Nidec, and Bosch, held about 45% of revenue in 2025, so the market shows moderate concentration. Siemens and ABB dominate rail by bundling long service contracts and proprietary control software. Automotive traction is fragmenting as Volkswagen, BMW, and Stellantis internalize e-axles, squeezing Tier-1 margins. CRRC’s fully integrated chain from rare-earth mining to final assembly produces motors at up to 25% lower cost, yet export ambitions face Buy America clauses in the United States rail projects.
White-space growth lies in motors above 500 kilowatts for freight, rare-earth-free topologies for budget passenger cars, and direct-drive solutions that skip gearboxes in industrial equipment. Nidec’s 2024 purchase of Embraco’s motor assets broadens its reach in adjacent electrification segments. Valeo joined Siemens in 2025 to build 800-volt e-axles for trucks, pooling thermal and control know-how. Patent filings for switched-reluctance control and silicon-carbide thermal management jumped 35% in 2024, underscoring a technology race that will reshape rankings in the next model cycle.
Electric Traction Motor Industry Leaders
Siemens AG
CRRC Corporation Limited
ABB Ltd
Nidec Corporation
Toshiba Corporation
- *Disclaimer: Major Players sorted in no particular order
Electric Traction Motor Market Companies Covered in this Report
- ABB Ltd
- Siemens AG
- CRRC Corporation Limited
- Toshiba Corporation
- Nidec Corporation
- WEG SA
- Mitsubishi Electric Corporation
- General Electric Company
- Robert Bosch GmbH
- Hitachi Ltd
- TECO Electric & Machinery Co. Ltd
- Bharat Heavy Electricals Limited (BHEL)
- CG Power & Industrial Solutions Ltd
- Kirloskar Electric Company Ltd
- Traktionssysteme Austria GmbH
- Alstom SA
- Skoda Transportation a.s.
- Dana TM4 Inc.
- Magnetek (Columbus McKinnon)
- Valeo SA
- Yaskawa Electric Corporation
- Brook Crompton Holdings

Market Opportunities and Future Outlook
Localization-driven capacity buildouts in India are creating near-term whitespace for traction-motor suppliers across EV and rail applications, aligned with the incentives and local-content direction described in the market context. In March 2026, ABB committed USD 75 million in India to expand manufacturing and R&D for motion and electrification, explicitly referencing propulsion systems, traction motors, and converters for rail and sustainable mobility. In May 2026, L&T Electronic Products & Systems partnered with EVR Motors to manufacture next-generation EV traction motors at a 40-acre facility in Coimbatore, supporting indigenous powertrain sourcing and adding options for OEMs that are internalizing e-axle content.
Higher-voltage and higher-power roadmaps are also creating room for new motor architectures, cooling solutions, and localized supply chains for laminations and cores, which become pressure points as platforms move to 800 V and continuous-power targets rise. Tsuyo received approval in March 2026 for an INR 250 crore EV powertrain manufacturing facility in Karnataka with phased capability up to 1,100 kW and 850 V DC architectures, and POSCO International announced plans for pilot production of traction motor cores in Pune, shifting from appliance and industrial lines toward mobility use. Together, these developments align with the report’s shift toward silicon-carbide-enabled higher-frequency drives and the thermal management needs that emerge above 400 kW, supporting opportunities in liquid cooling, integrated e-axles, and localized component ecosystems that reduce exposure to import costs and certification lead times.
Recent Industry Developments in Electric Traction Motor Market
- June 2026: Siemens Limited received an order from Titagarh Rail Systems Limited to deliver metro propulsion systems including traction motors for 12 trainsets for the Pune Metro Rail Project extension. The award supports local execution of rail traction packages in India and helps suppliers that can meet localization and lifecycle support expectations tied to metro procurements.
- March 2026: Siemens Mobility signed a framework agreement with Akiem for 80 Vectron locomotives, including the launch of a new battery-electric dual-mode version. The program expands the addressable traction-motor and powertrain scope for operations that combine electrified and non-electrified routes, shifting demand toward more flexible propulsion configurations.
- March 2024: ABB signed a USD 150 million deal with Hyundai Rotem to supply traction packages including traction motors for 65 trains for Queensland, Australia. The contract highlights the continued scale of turnkey traction-package awards in rail and the value of bundled motors, converters, and system integration in large fleet procurements.


Electric Traction Motor Market Report Scope and Research Methodology
Market Definition and Coverage
For this study, the market covers electric traction motors that convert electrical power into wheel or axle torque to move a vehicle, and includes OEM fitment and replacement demand across major mobility uses.
Scope exclusions: We exclude motors used only for fixed-speed industrial drives and stand-alone generator sets that are not installed as propulsion traction motors.
Segments Covered in This Report
- By Type
- Alternating Current (Induction, Permanent-Magnet Synchronous, Switched Reluctance)
- Direct Current (Brushed, Brushless DC)
- By Power Rating
- Below 200 kW
- 200 to 400 kW
- Above 400 kW
- By Cooling Type
- Air-Cooled
- Liquid-Cooled
- Self-Ventilated
- By Voltage Class
- Below 1 kV
- 1 to 3 kV
- Above 3 kV
- By Application
- Railway
- Electric Vehicles
- Industrial Machinery
- Other Applications (Drones, eVTOL)
- By Geography
- North America
- United States
- Canada
- Mexico
- Europe
- Germany
- France
- United Kingdom
- Italy
- Spain
- Netherlands
- Rest of Europe
- Asia-Pacific
- China
- Japan
- South Korea
- India
- ASEAN Countries
- Rest of Asia-Pacific
- South America
- Brazil
- Argentina
- Rest of South America
- Middle East and Africa
- Saudi Arabia
- United Arab Emirates
- South Africa
- Egypt
- Rest of Middle East and Africa
- North America
Data Sources, Market Sizing, and Validation
Desk Research
We start with desk research to set the demand pool and the rules for counting, before any math is finalized. Public sources used to anchor the model include International Energy Agency EV outlook tables, national vehicle registration and sales releases (for example, U.S. DOE and EU sources), rail fleet and electrification updates from transport ministries, and trade and tariff statistics from UN Comtrade. For motor and materials context, we also review U.S. Geological Survey outputs and peer reviewed papers on traction motor efficiency and magnet use.
Next, we align these demand-side inputs with supply side signals such as company annual reports, investor decks, and credible press coverage on platform wins, capacity additions, and localization plans. Where useful, we supplement with paid subscriptions for company financials and intelligence, patent databases, and import-export shipment-level tracking to cross-check directional trends. The desk research sources listed here are illustrative, and additional public documents were used for data collection, validation, and research clarification.
Primary Interviews and Surveys
Our primary work focuses on validating unit volumes, typical motor value per vehicle, and how quickly different motor types are being adopted across passenger EVs, commercial EVs, and rail applications. We speak with OEM-side stakeholders, component suppliers, and channel participants across APAC, EMEA, and the Americas, and then use the responses to confirm assumptions that were unclear in public data.
Distribution of primary research fieldwork respondents
| Company type | Respondent position | Region |
|---|---|---|
| Top tier: 36% | CXOs: 15% | APAC: 52% |
| Mid tier: 48% | Functional/Unit leaders: 39% | EMEA: 29% |
| Smaller Players: 16% | Managers: 46% | Americas: 19% |
Market-Sizing & Forecasting
The sizing logic begins with a top-down build where EV production, rail rolling-stock additions, and electrification activity are used to reconstruct the install base that needs traction motors, which is then converted into value using typical motors-per-vehicle assumptions and price bands. To keep totals realistic, we corroborate them with selective bottom-up checks such as sampled ASP x unit volumes by major application, supplier shipment disclosures where available, and channel checks on replacement demand.
Inputs that materially shape the model include EV sales by powertrain, average motor power class mix (below 200 kW, 200-400 kW, and above 400 kW), penetration of permanent-magnet designs versus other motor types, magnet and copper cost movement that influences ASPs, and the split between OEM demand and aftermarket replacements. Where public data is missing for certain geographies, we handle gaps using proxy indicators like vehicle parc growth, regional electrification targets, and expert-confirmed adoption curves, and then normalize the results so they do not exceed feasible production and supply capacity.
For forecasting, we mainly use scenario analysis supported by a light multivariate check, since policy changes, battery cost trends, and rail spending cycles can shift the trajectory. Assumptions on EV rollout pace, rail electrification timing, and ASP progression are reviewed with industry respondents, and then the final path is selected based on what is most consistent with observed shipment and production signals.
Data Validation & Update Cycle
We validate outputs by comparing results against independent signals such as EV registrations, motor production indicators, and announced platform volumes, and then review any large deviations before numbers are finalized. If an assumption creates an unrealistic jump in ASP or implied unit volume, it is flagged and revisited with a second source, followed by an internal analyst review.
The report is refreshed annually, and interim updates are triggered when material events occur, such as major policy shifts, large capacity announcements, or sharp input-cost changes that can move pricing. Before delivery, we run a final pass so clients receive the latest updated view tied back to clear variables and repeatable steps.
Mordor Intelligence's Electric Traction Motor Market Size Versus Other Published Estimates
Published market values for electric traction motors often vary because firms count different applications, apply different pricing logic, and use different base years or currency timing. Some figures also lean heavily on one demand signal, which can inflate the total when adoption is accelerating.
The table points to a clear spread that is mostly explained by what gets included and how unit value is built. Under Mordor Intelligence's model, the market is tied to propulsion traction motors supplied into EV and rail demand pools and separated from adjacent motor uses, while some external figures fold in elevators and conveyors or apply a faster ASP ramp without enough checks against real vehicle and rail volumes.
Benchmark comparison
| Source | Market Size | Gaps in Research Methodology |
|---|---|---|
| Mordor Intelligence | USD 17.35 B (2026) | |
| Industry Newswire A | USD 20.09 B (2024) | Uses a broader application frame that includes elevators, conveyors, and wider industrial machinery, which increases totals beyond vehicle and rail propulsion demand. |
| Trade Release B | USD 18.50 B (2024) | Relies on a long-horizon growth narrative with limited visibility on unit build-up and currency timing, and it can overstate near-term value when ASP and adoption are assumed to rise together. |
Overall, differences come down to scope and the way value per motor is estimated, followed by base-year choice. By anchoring the model to observable EV and rail volumes and then checking pricing against realistic power-class mixes, we end up with a market value that can be traced back to a few practical inputs.


Key Questions Answered in the Report
What is the projected size of the electric traction motor market by 2031?
The market is forecast to reach USD 26.33 billion by 2031.
Which segment is growing fastest within traction motors?
Electric-vehicle applications post the highest growth at a 15.8% CAGR through 2031.
Why are OEMs bringing traction-motor production in-house?
Automakers want tighter control of thermal performance, software updates, and cost, which improves margins and reduces supply risk.
How does the Carbon Border Adjustment Mechanism affect suppliers?
CBAM raises the imported motor cost into Europe by 8-12%, encouraging local production to avoid tariffs.
Which cooling method is gaining share in high-power motors?
Liquid cooling, especially direct-oil systems, is expanding at 11.3% CAGR because it handles higher heat loads efficiently.
Page last updated on:


 Your data is secure and never sold or shared.


