
Electric Toothbrush Market Size and Share
Market Overview
| Study Period | 2021 - 2031 |
|---|---|
| Market Size (2026) | USD 6.75 Billion |
| Market Size (2031) | USD 9.85 Billion |
| Growth Rate (2026 - 2031) | 7.25 % |
| Fastest Growing Market | Asia-Pacific |
| Largest Market | Europe |
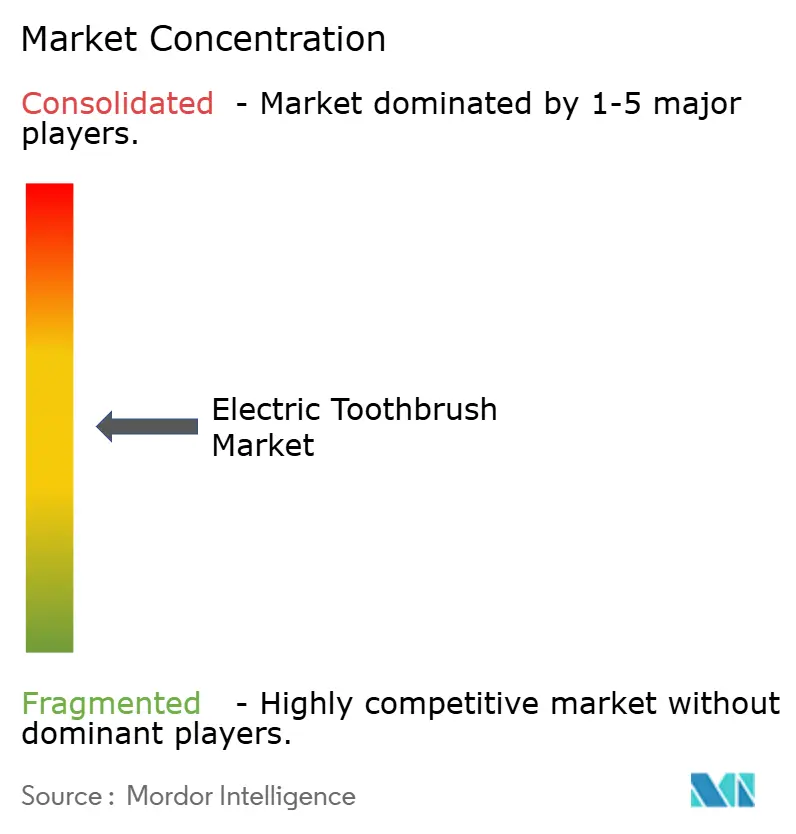
| Market Concentration | Medium |
Major Players *Disclaimer: Major Players sorted in no particular order Image © Mordor Intelligence. Reuse requires attribution under CC BY 4.0. | |
Electric Toothbrush Market Analysis by Mordor Intelligence
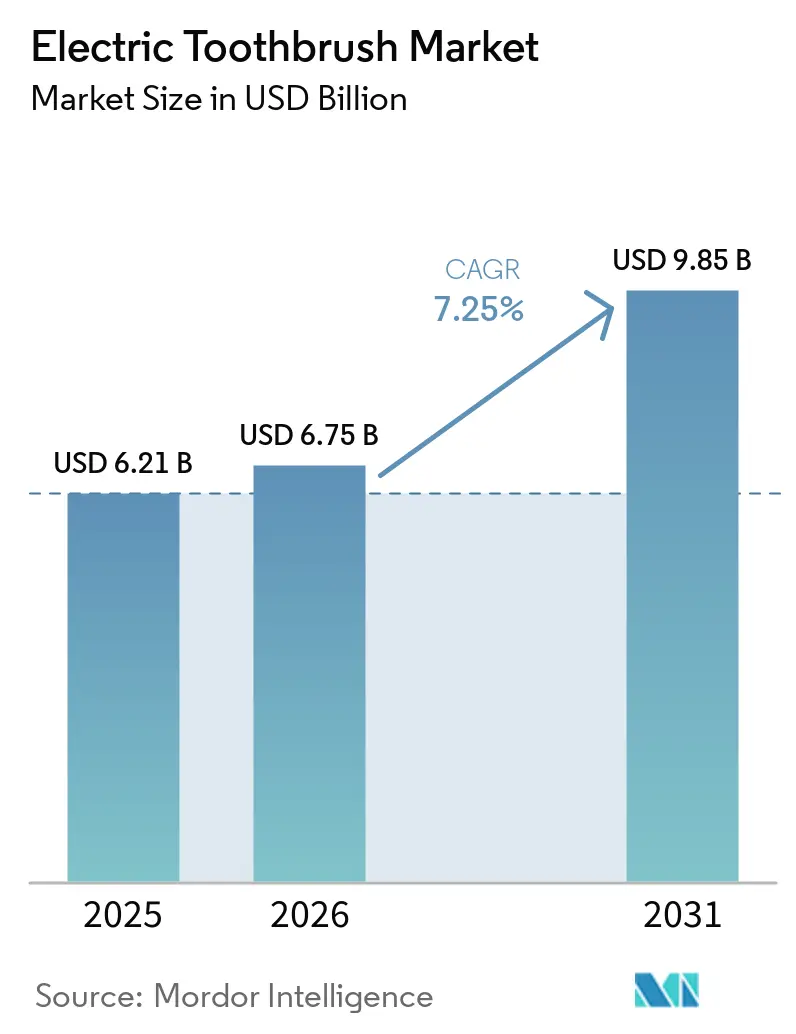
The electric toothbrush market size is valued at USD 6.75 billion in 2026, growing from the 2025 value of USD 6.21 billion, and is forecast to climb to USD 9.85 billion by 2031, advancing at a 7.25% CAGR. The expansion reflects rising clinical acceptance that powered brushing removes plaque up to 21% better than manual methods, supportive FDA Class I categorization that shortens innovation cycles, and price-ratio improvements that bring connected models below the USD 50 threshold in many regions. Sustainability regulations, notably the European Union’s 2023 Battery Regulation, are accelerating rechargeable adoption and nudging brands toward modular, recyclable designs. Simultaneously, DTC subscriptions that ship brush heads every quarter are locking users into ecosystems, enhancing lifetime value while shielding brands from raw-material volatility. Competitive intensity, however, is rising as Chinese challengers deploy AI-guided devices at 30-40% lower price points, obliging incumbents to differentiate through patented motor technologies and clinical endorsements.
Key Report Takeaways
- By product form, rechargeable models led with 82.14% of the electric toothbrush market share in 2025, while battery-powered variants are forecast to post an 8.75% CAGR through 2031.
- By brushing technology, oscillating-rotating heads commanded 54.68% revenue in 2025; sonic and ultrasonic designs are projected to accelerate at a 9.95% CAGR to 2031.
- By end user, adults captured 85.14% sales in 2025, whereas the kids segment is expected to expand at 8.95% CAGR over the forecast period.
- By distribution channel, supermarkets and hypermarkets held 43.68% share in 2025, yet online retail is set to register the quickest growth at 9.56% CAGR to 2031.
- By geography, Europe accounted for 36.89% of 2025 revenue; Asia-Pacific is on track for the fastest 8.74% CAGR through 2031.
Note: Market size and forecast figures in this report are generated using Mordor Intelligence’s proprietary estimation framework, updated with the latest available data and insights as of January 2026.
Market Trends and Insights
Drivers Impact Analysis of Electric Toothbrush Market*
| Drivers | (~) % Impact on CAGR Forecast | Geographic Relevance | Impact Timeline |
|---|---|---|---|
| Increasing Consumer Awareness of Oral Hygiene | +1.2% | Global, with accelerated gains in Asia-Pacific and Latin America | Medium term (2-4 years) |
| Technological Advancements in Product Design and Functionality | +1.5% | North America & Europe lead adoption; Asia-Pacific follows with localized innovation | Short term (≤ 2 years) |
| Rising Prevalence of Dental Diseases | +1.0% | Global, concentrated in aging populations (Europe, Japan) and high-sugar-diet regions | Long term (≥ 4 years) |
| Growing Demand for Eco-friendly and Rechargeable Products | +0.9% | Europe (driven by EU Battery Regulation), North America, Australia | Medium term (2-4 years) |
| Favorable Government Initiatives on Oral Hygiene | +0.7% | Emerging markets (India, Brazil, Southeast Asia) with national dental health programs | Long term (≥ 4 years) |
| Aggressive Marketing and Advertising by Brands | +0.8% | Global, with highest intensity in North America, Europe, and urban Asia-Pacific | Short term (≤ 2 years) |
| Source: Mordor Intelligence | |||
Increasing Consumer Awareness of Oral Hygiene
The World Health Organization's 2022 Global Oral Health Status Report documented that 3.5 billion people suffer from oral diseases, positioning preventive care as a public health imperative rather than discretionary spending. This awareness translates into behavioral shifts: consumers now recognize that electric toothbrushes deliver superior plaque removal compared to manual brushing, a fact validated by clinical studies showing up to 21% better cleaning efficacy. Japan's Ministry of Health, Labour and Welfare reported rising per-capita dental medical expenditure from 2009 through 2024. What matters strategically is that awareness alone does not guarantee adoption—88.6% of Japanese youth still use manual toothbrushes despite high health literacy, revealing a gap between knowledge and behavior that brands must bridge through education and trial programs. The impact peaks in the medium term as digital health platforms integrate oral care tracking, creating feedback loops that reinforce usage.
Technological Advancements in Product Design and Functionality
Oclean launched the world's first Wi-Fi-enabled electric toothbrush in 2024, featuring AI-guided brushing with bone-conduction voice prompts and real-time feedback on 8 oral zones, illustrating how connectivity is transforming a commodity product into a data-driven health device. Philips Sonicare's patented sonic technology operates at 31,000 brush strokes per minute, generating fluid dynamics that clean interdental spaces without mechanical abrasion, while Oral-B's iO series integrates 3D motion tracking and pressure sensors that alert users to over-brushing. The strategic implication is that technology is bifurcating the market: premium segments justify USD 100-140 price points through app connectivity and personalized brushing plans, while mid-tier products at USD 35-50 adopt maglev motors and multiple cleaning modes to compete on performance. Battery life has become a differentiator—Oclean Flow claims 180 days per charge, reducing friction for travelers and eliminating the need for proprietary chargers that lock consumers into ecosystems. This driver delivers short-term impact because product cycles in consumer electronics run 18-24 months, compelling continuous innovation.
Rising Prevalence of Dental Diseases
Dental caries, periodontal disease, and tooth loss affect 3.69 billion people globally, with prevalence rising in aging populations and regions with high-sugar diets, according to WHO epidemiological data. Electric toothbrushes address this burden through timers that enforce the dentist-recommended 2-minute brushing duration and quadrant reminders that ensure comprehensive coverage. The long-term impact stems from demographic inevitability—aging populations in Europe and Japan will drive demand for devices that compensate for declining manual dexterity, while emerging markets face rising disease incidence as Western diets proliferate. Insurers and dental associations increasingly recommend powered brushing for patients with orthodontic appliances or periodontal conditions, embedding electric toothbrushes into clinical care pathways.
Growing Demand for Eco-friendly and Rechargeable Products
The European Union's Battery Regulation, enacted in 2023, mandates that by 2027 all portable batteries must meet collection targets, disclose carbon footprints, and incorporate minimum recycled content, forcing electric toothbrush manufacturers to redesign supply chains and product architectures, according to the EU Battery Regulation[1]Source: European Union, “Battery Regulation (EU) 2023,” eur-lex.europa.eu. Laifen's Wave toothbrush uses packaging made from 90%+ recyclable materials, while multiple brands now offer biodegradable brush heads to address the 3.6 billion plastic toothbrushes discarded annually by Laifen. Rechargeable models dominate 82.14% of 2025 sales because they eliminate battery waste and reduce lifetime cost, but the strategic tension lies in balancing sustainability claims with planned obsolescence—most devices use sealed lithium-ion batteries that cannot be replaced, creating e-waste when the battery degrades after 2-3 years. Consumers in Europe and North America increasingly scrutinize lifecycle impacts, and brands that fail to offer take-back programs or modular designs risk reputational damage. This driver peaks in the medium term as regulatory enforcement tightens and sustainability becomes a table-stakes expectation rather than a differentiator.
Restraints Impact Analysis of Electric Toothbrush Market*
| Restraints | (~) % Impact on CAGR Forecast | Geographic Relevance | Impact Timeline |
|---|---|---|---|
| Prevalence of Traditional Way of Tooth Cleaning | -0.6% | Asia-Pacific, Africa, Latin America, with strongest persistence in rural areas | Long term (≥ 4 years) |
| Fluctuating Raw Material Prices | -0.4% | Global, with acute pressure in Asia-Pacific manufacturing hubs (China, Vietnam) | Short term (≤ 2 years) |
| Low Penetration in Developing and Under-Developed Countries | -0.5% | Sub-Saharan Africa, South Asia, parts of Latin America | Long term (≥ 4 years) |
| High Cost Associated with the Product | -0.3% | Emerging markets (India, Indonesia, Brazil) and low-income consumer segments globally | Medium term (2-4 years) |
| Source: Mordor Intelligence | |||
Prevalence of Traditional Way of Tooth Cleaning
Cultural preferences and behavioral inertia sustain manual toothbrush dominance in emerging markets, where 88.6% of Japanese youth continue using manual brushes despite high health literacy and product availability. This persistence stems from multiple factors: manual brushing is embedded in childhood routines, parents do not perceive electric toothbrushes as necessary for children, and the tactile feedback of manual brushing provides a sense of control that powered devices disrupt. In rural areas across Asia-Pacific, Africa, and Latin America, inconsistent electricity access makes rechargeable models impractical, while battery-powered alternatives face skepticism about performance and durability. The long-term impact reflects the generational time horizon required to shift ingrained habits—brands must target children through gamified devices and school partnerships to normalize powered brushing before adulthood. The strategic challenge is that overcoming this restraint requires sustained investment in education and trial programs that may not yield returns for 5-10 years, testing the patience of public-market investors focused on quarterly results.
Fluctuating Raw Material Prices
Lithium-ion battery prices, which fell from USD 780 per kWh in 2015 to USD 139 per kWh in 2024 according to the International Energy Agency, have stabilized but remain vulnerable to supply-chain disruptions and geopolitical tensions affecting lithium, cobalt, and nickel mining[2]Source: International Energy Agency, “Battery Price Data 2024,” iea.org. Electric toothbrush manufacturers also source plastics, electronic components, and DuPont nylon bristles, all subject to commodity price volatility. Procter and Gamble projected USD 200 million in after-tax headwinds from commodity costs in 2025, while Colgate-Palmolive expects USD 200 million in incremental tariff impacts, illustrating how input-cost inflation compresses margins. The short-term impact is acute because manufacturers operate on 6-12 month procurement cycles, limiting their ability to hedge against price spikes. Brands respond through productivity initiatives—P&G delivered 280 basis points in savings last quarter—but these gains eventually plateau, forcing either price increases that dampen demand or margin erosion that constrains innovation investment. The strategic implication is that vertical integration or long-term supply contracts become competitive advantages, enabling cost stability that smaller players cannot replicate.
*Our forecasts treat driver/restraint impacts as directional, not additive. The impact forecasts reflect baseline growth, mix effects, and variable interactions.
Electric Toothbrush Market Segment Analysis
By Product Form:
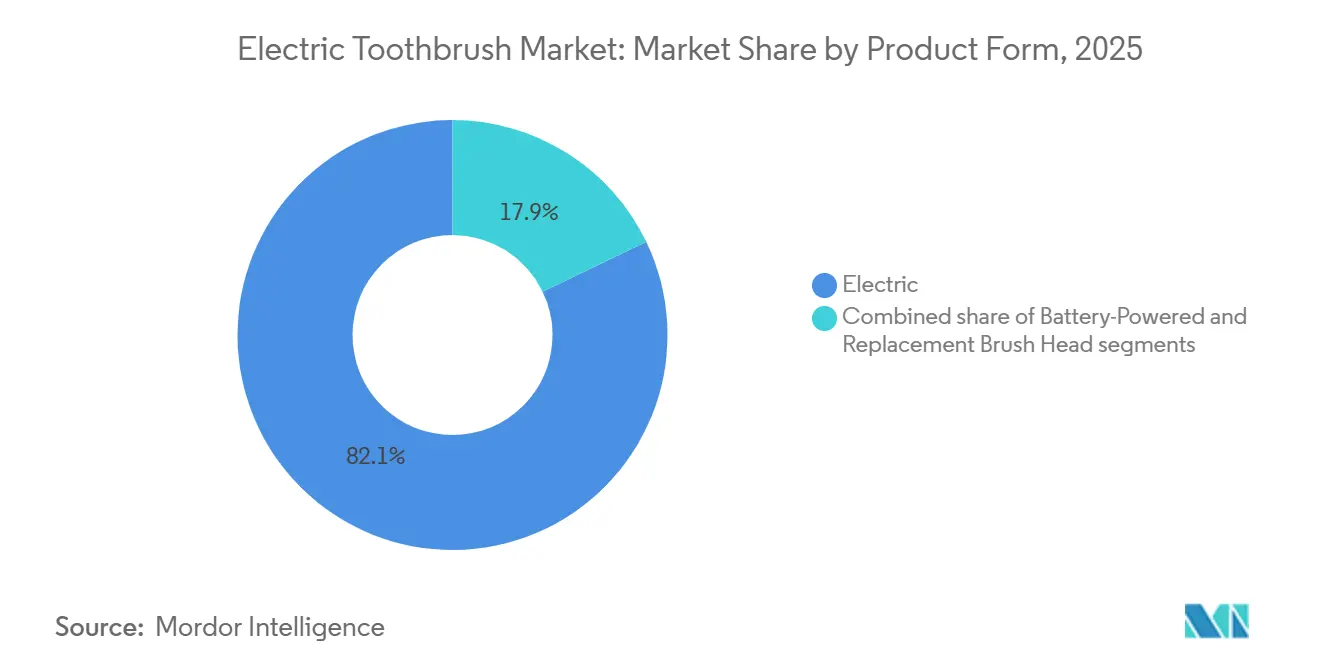
Rechargeable Models Anchor Revenue, Battery Variants Target AccessibilityElectric rechargeable models commanded 82.14% of market share in 2025, reflecting consumer preference for devices that eliminate battery replacement costs and deliver consistent power output throughout the charge cycle. Battery-powered variants, though capturing only 17.86% share, will expand at 8.75% CAGR through 2031 as manufacturers target price-sensitive consumers in emerging markets where electricity access remains inconsistent. Replacement brush heads constitute a critical recurring-revenue stream, with subscription models from Quip (USD 7 per quarter), Philips Sonicare (USD 7.99-13.99 per quarter), and Burst (USD 7 per quarter) locking consumers into ecosystems and generating lifetime values that exceed the initial device sale. The strategic tension lies in battery technology: rechargeable models use sealed lithium-ion cells that degrade after 2-3 years, creating e-waste and forcing repurchases, while battery-powered devices allow users to replace AA or AAA batteries, extending product life but reducing manufacturer lock-in.
Oclean's Flow model claims 180-day battery life per charge, eliminating the friction of frequent recharging and appealing to travelers who resist carrying proprietary charging cables. Oral-B's Pro 3 series, priced at GBP 35-45 (USD 44-57), demonstrates how incumbents are defending share through aggressive promotions—up to 71% off recommended retail prices—that compress margins but maintain volume. The replacement brush-head segment faces disruption from third-party manufacturers offering compatible heads at 30-40% discounts, eroding brand loyalty and forcing OEMs to differentiate through proprietary features like RFID chips that communicate brush-head age to the device. This segmentation will see further bifurcation as premium users demand smart features while value-conscious buyers prioritize basic functionality and low total cost of ownership.


By Brushing Technology:
Sonic Innovation Challenges Rotating-Head IncumbencyOscillating and rotating brush heads held 54.68% of the market share in 2025, leveraging decades of clinical validation and strong brand equity from Oral-B's market leadership, yet sonic and ultrasonic designs will grow at 9.95% CAGR through 2031, driven by superior interdental cleaning and reduced gum irritation. Philips Sonicare's patented sonic technology operates at 31,000 brush strokes per minute, generating fluid dynamics that dislodge plaque in hard-to-reach areas without mechanical abrasion, while ultrasonic devices exceed 1.6 MHz frequency to disrupt biofilm at the cellular level. Oclean's X Ultra S delivers 84,000 movements per minute through a maglev motor, positioning sonic technology as the performance frontier. The clinical distinction matters: sonic brushing relies on fluid flow to clean, whereas oscillating heads depend on direct bristle contact, making sonic designs gentler for users with sensitive gums or orthodontic appliances.
The technology race is intensifying as manufacturers file patents on motor designs, brush-head geometries, and control algorithms. Oclean claims 300+ toothbrush technology patents, positioning itself as a leader in intellectual property quantity, though patent count does not directly correlate with market share. Oral-B's iO series integrates magnetic drive systems that combine oscillation with micro-vibrations, blurring the line between categories and illustrating how incumbents are hybridizing technologies to defend their installed base. The strategic implication is that brushing technology is becoming a secondary consideration for consumers, who prioritize smart features over motor type. Brands that fail to communicate the clinical benefits of their chosen technology risk commoditization, where price becomes the primary purchase criterion. Compliance with IEC 60601-1 safety standards for medical electrical equipment remains a baseline requirement, though most electric toothbrushes qualify as low-risk Class I devices under FDA regulations, simplifying market entry[3]Source: U.S. Food and Drug Administration, “Powered Toothbrushes – Regulatory Information,” fda.gov.
By End User:
Adult Segment Dominates, Kids Category Unlocks Long-Term LoyaltyAdults accounted for 85.14% of the market share in 2025, driven by higher disposable incomes, greater awareness of periodontal disease risks, and willingness to invest in preventive health. The kids segment, though only 14.86% of volume, will expand at 8.95% CAGR through 2031 as manufacturers deploy gamification, app connectivity, and parental monitoring to address the behavioral challenge of teaching proper brushing technique. Philips Sonicare for Kids and Oral-B's Disney-branded models use reward systems and progress tracking to incentivize 2-minute brushing sessions, while Playbrush GmbH's app-connected toothbrushes turn brushing into interactive games that hold children's attention. The strategic value of the kids segment extends beyond immediate revenue: establishing brand loyalty during childhood creates lifetime customers who upgrade to adult models and purchase replacement heads for decades.
Japan illustrates the untapped potential—only 12.3% of youth use electric toothbrushes despite parents investing heavily in children's dental care, revealing a perception gap that brands must close through education and trial programs. Teenagers and young adults represent a particularly underserved demographic, as most products target either "adults" or "children" without addressing the unique preferences of 13-25 year-olds who seek style, portability, and social media shareability. The adult segment is bifurcating into premium users who demand AI-guided brushing and 3D motion tracking, and value-conscious buyers who prioritize basic functionality at USD 35-50 price points. Aging populations in Europe and Japan will sustain adult demand, as electric toothbrushes compensate for declining manual dexterity and address periodontal disease that affects 50%+ of adults over 60. The kids segment faces a regulatory wildcard: if governments mandate fluoride levels in children's toothpaste or restrict marketing of character-branded products, manufacturers will need to pivot messaging from entertainment to health outcomes.
By Distribution Channels:
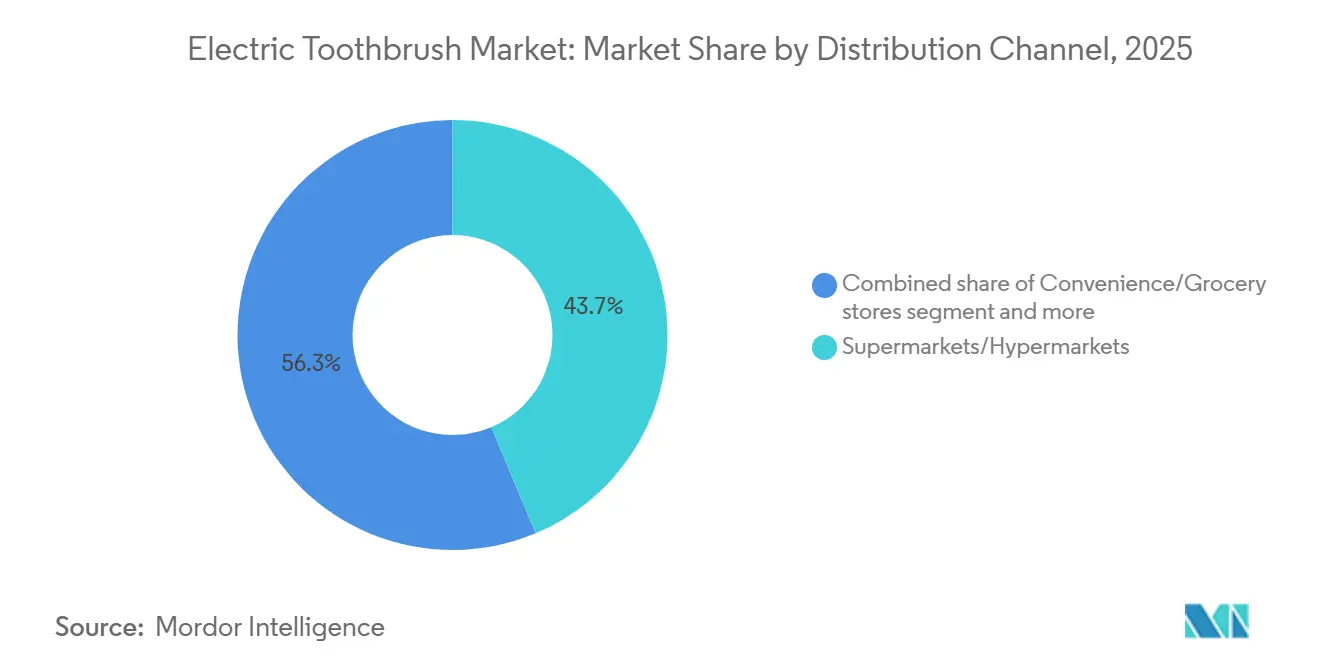
E-Commerce Disrupts Brick-and-Mortar DominanceSupermarkets and hypermarkets captured 43.68% of market share in 2025, leveraging high foot traffic and impulse-purchase opportunities, yet online retail channels will grow at 9.56% CAGR through 2031 as direct-to-consumer brands bypass traditional retail and consumers prioritize convenience and price transparency. Quip, Burst, and SURI built businesses entirely on e-commerce, offering subscription models that deliver replacement brush heads quarterly and eliminating the friction of remembering to purchase refills. Pharmacies and drugstores held an 18-20% share, benefiting from their positioning as health destinations where consumers seek expert advice, while convenience and grocery stores captured 12-15% through opportunistic purchases. The remaining 10-12% flows through "other" channels, including dental offices, where dentists recommend specific brands and sometimes sell devices directly, creating a high-conversion channel that bypasses consumer skepticism.
Online retail's advantage lies in data: brands track browsing behavior, cart abandonment, and repeat purchase rates to optimize pricing and promotions in real time, while brick-and-mortar retailers operate on 90-day merchandising cycles that cannot respond to demand shifts. Oral-B and Philips combine for approximately 70% of online electric oral care sales, illustrating how incumbents have successfully defended their digital presence despite DTC challengers [Reviewed.com]. The strategic challenge for traditional retailers is showrooming—consumers visit stores to examine products but purchase online for lower prices, eroding the value of physical shelf space. Pharmacies counter this by bundling electric toothbrushes with dental insurance enrollment or offering loyalty points that offset price differences. The European Union's Digital Services Act and consumer protection regulations require transparent pricing and easy returns, raising compliance costs for online sellers but also standardizing the customer experience. Distribution will fragment further as social commerce (TikTok Shop, Instagram Checkout) enables influencer-driven sales that bypass both traditional retail and brand-owned e-commerce, forcing manufacturers to manage 5-7 distinct channels simultaneously.
Geography Analysis
Europe Electric Toothbrush Market
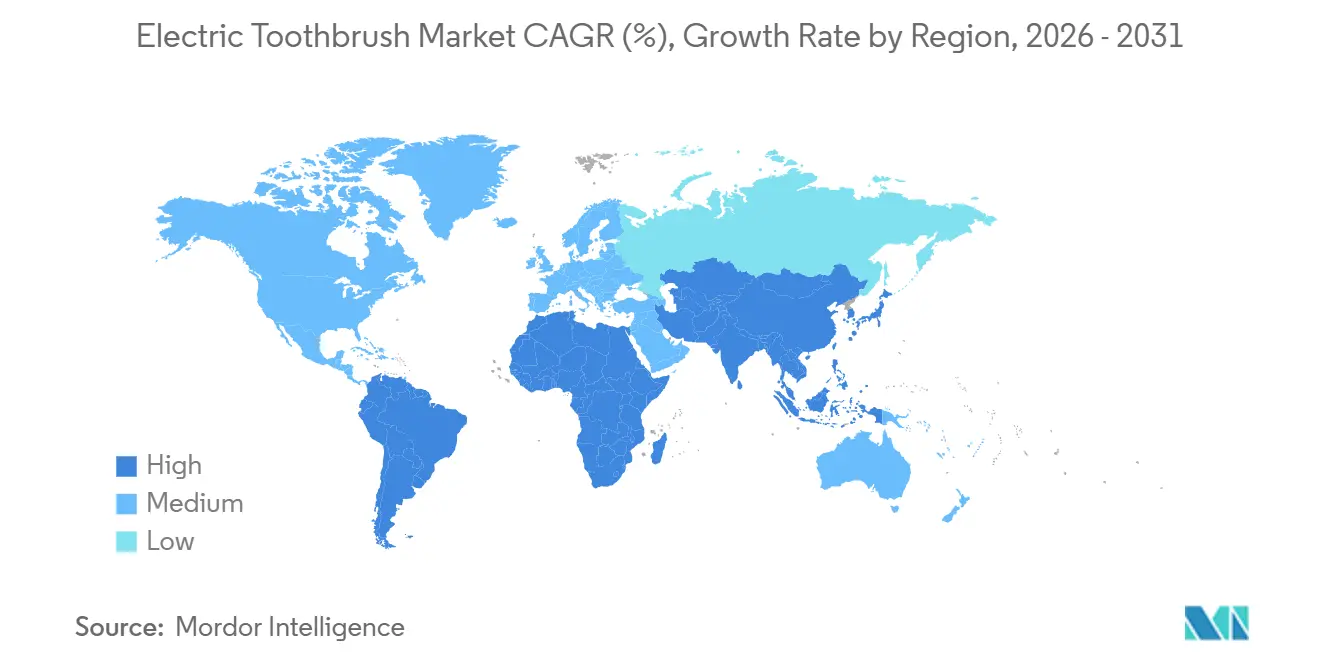
Europe generated 36.89% of 2025 revenue, anchored by Germany, the United Kingdom, and France, where dental insurance often reimburses powered brushes for periodontal patients. Regional growth is moderating to 5-6% CAGR as penetration plateaus in urban centers, yet Eastern Europe remains under-penetrated, offering room for mid-tier price points. Sustainability is now prerequisite; brands lacking take-back programs draw regulatory scrutiny and social-media backlash.
APAC Electric Toothbrush Market
Asia-Pacific represents the fastest lane, poised for 8.74% CAGR to 2031. China’s middle-class expansion and India’s upgrade cycle underpin momentum, while Oclean and Usmile drive local pricing wars that compress entry thresholds. Japan’s paradoxical low youth adoption reveals cultural stickiness that education campaigns aim to dismantle. Australia, supported by high income and robust insurance, acts as a premium stronghold within the region. Success depends on balancing localized aesthetics and price bands with platform efficiencies.
The Americas and MEA Electric Toothbrush Market
North America accounted for roughly 23% of 2025 sales, with the United States debating FSA and HSA inclusion that could lift premium uptake by cutting net cost. DTC pioneers Quip and Burst started here, forcing incumbents into digital pivots. Canada mirrors U.S. trends but at smaller scale, whereas Mexico’s lower income limits penetration to metropolitan zones. South America and the Middle East-Africa each deliver near-10% shares; their urban growth pockets sit against rural affordability and infrastructure challenges, limiting expansion until macro-economic gains arrive.

Regulatory Landscape
US regulation anchors for powered toothbrushes center on FDA dental device classifications. Most devices sit under 21 CFR Part 872 and are commonly treated as low-risk Class I, but in September 2024 the FDA codified radiofrequency toothbrushes as Class II under 21 CFR 872.6866, raising evidence requirements and controls for devices introducing therapeutic mechanisms. In Europe, CE-marking pathways and medical-device obligations under EU MDR 2017/745 apply when health or therapeutic claims are made, with guidance and post-market obligations shaping access and labeling. The FDA, MDCG guidance, and CEN workstreams converge with standards like ISO 20127:2025 (published May 2025) to harmonize test language and expectations; the MDCG 2023-5 document and related CEN guidance influence how dental devices are evaluated for MDR conformity. An active emphasis on electrical safety and performance under IEC 60335-2-52:2021 informs design validation and test scope for global product launches.
Competitive Landscape
In the electric toothbrush market, established consumer goods giants compete intensely with emerging direct-to-consumer startups. Traditional leaders such as Procter & Gamble, Colgate-Palmolive, and Philips sustain their dominance by capitalizing on robust research capabilities, expansive global distribution networks, and clinically validated product offerings. On the other hand, newer entrants like Quip, Burst, and Suri have successfully established their presence by addressing specific consumer demands through subscription-based models, innovative product designs, and a strong focus on environmental sustainability.
The competitive landscape is increasingly driven by advancements in technology, with companies heavily investing in features such as smart connectivity, artificial intelligence, and personalized user experiences. These technological innovations are transforming electric toothbrushes from basic oral care devices into sophisticated health monitoring tools, reflecting the market's progression beyond traditional functionalities and meeting the growing consumer demand for integrated health solutions.
Recent developments in the market highlight a continuous focus on innovation in both product design and material selection. For example, in January 2024, Laifen introduced its Wave Electric Toothbrush at CES 2024. This product features a handle crafted from high-quality materials, including aluminum, stainless steel, and ABS plastic, showcasing the industry's commitment to durability, premium aesthetics, and enhanced user experience in product development.
Electric Toothbrush Industry Leaders
Colgate-Palmolive Company
Koninklijke Philips N.V.
FOREO AB
Church and Dwight Co., Inc.
Procter and Gamble Company
- *Disclaimer: Major Players sorted in no particular order
Electric Toothbrush Market Companies Covered in this Report
- Procter and Gamble Company
- Colgate-Palmolive Company
- Koninklijke Philips N.V.
- Church and Dwight Co., Inc.
- FOREO AB
- Panasonic Holdings Corporation
- Lion Corporation
- Den-Mat Holdings LLC
- Snow Cosmetics LLC
- Ningbo Seago Electric Co. Ltd.
- Xiaomi (Oclean)
- Quip NYC Inc.
- Burst Oral Care Inc.
- Kolibree (BARACODA)
- Playbrush GmbH
- Usmile Co., Ltd.
- FOSOO Technologies
- Mornwell (Foshan Roson Medical Instruments Co., Ltd.)
- Brio Product Group
- SURI

Market Opportunities and Future Outlook
A clear opportunity exists to upgrade from motor-driven cleaning to on-device intelligence and specialized use cases. In 2026, Philips Sonicare introduced the 5700 to 7300 Series with a re-engineered motor and Next-Generation Sonicare technology, and then extended the premium end with the DiamondClean 9900 Prestige featuring on-device AI guidance and a user-replaceable battery design, signaling a product architecture shift that embeds coaching features directly into the handle and reduces reliance on app-centric feedback. This evolution creates whitespace for brands to differentiate through sensing, guidance, and accessibility features integrated into the device itself.
Recent Industry Developments in Electric Toothbrush Market
- July 2026: Philips Sonicare introduced its first electric toothbrush powered by on-device AI, adding real-time guidance and smart pressure sensing directly on the device. The move shifts differentiation from purely app-led coaching to embedded intelligence, strengthening premium positioning and raising the competitive bar for sensor stacks and algorithms.
- May 2026: Oral-B's Project Steady program with the International Association for Disability and Oral Health (iADH) ties product development and messaging to inclusion and real-world evidence generation across Europe.
- April 2026: SuperMouths Ultim8 SmartBrush System Ortho-Edition packaged orthodontic-focused bristles with a UV sanitizer and dryer hub, expanding portfolio to orthodontic-focused multifunctional tools and intensifying competition for consumers seeking integrated oral-care solutions.


Electric Toothbrush Market Report Scope and Research Methodology
Market Definition and Coverage
For this study, the electric toothbrush market covers powered toothbrush handles and their replacement brush heads, counted in value terms at retail sell-out prices across major geographies.
Scope exclusions: We exclude manual toothbrushes, oral irrigators, denture cleaners, and standalone oral-care apps that are sold without a physical brush.
Segments Covered in This Report
- By Product Form
- Electric
- Battery-Powered
- Replacement Brush Heads
- By Brushing Technology
- Oscillating/Rotating
- Sonic/Ultrasonic
- By End User
- Adults
- Kids
- By Distribution Channels
- Supermarkets/Hypermarkets
- Convenience/Grocery Stores
- Pharmacies/Drug Stores
- Online Retail Stores
- Other Distribution Channels
- By Geography
- North America
- United States
- Mexico
- Canada
- Rest of North America
- Europe
- United Kingdom
- Germany
- France
- Italy
- Spain
- Russia
- Netherlands
- Sweden
- Rest of Europe
- Asia-Pacific
- Japan
- China
- India
- Australia
- Rest of Asia-Pacific
- South America
- Brazil
- Argentina
- Chile
- Colombia
- Peru
- Rest of South America
- Middle East and Africa
- United Arab Emirates
- South Africa
- Nigeria
- Saudi Arabia
- Egypt
- Morocco
- Turkey
- Rest of Middle East and Africa
- North America
Data Sources, Market Sizing, and Validation
Desk Research
Desk research was used to set clear market boundaries, build country-level demand indicators, and map pricing ladders across sales channels before finalizing the model. We referred to public sources such as UN Comtrade for trade flows, World Bank and IMF macro indicators, and US CDC and WHO oral health publications to understand user pools and hygiene trends. We also reviewed guidance and data shared by dental associations (such as ADA-style bodies) and relevant peer-reviewed dental journals to track adoption patterns and product claims.
On the supply and commercialization side, we used company filings, annual reports, investor presentations, and trusted press coverage to map product portfolios and channel focus, then to sense-check realistic price bands. Where it helped close gaps, we used paid subscriptions for company financials and intelligence, patent databases, and shipment-level import and export views to validate supplier presence and directional volumes. These desk sources are illustrative rather than exhaustive, and many other references were also used to collect data, validate assumptions, and clarify open questions.
Primary Interviews and Surveys
Primary work was used to test what we built from desk findings, especially around replacement head attachment rates, channel margin patterns, and how battery powered units differ from rechargeable units in average selling price. We spoke with a mix of manufacturers, distributors, dental professionals, and retail and e-commerce-side respondents across APAC, EMEA, and the Americas, and we rechecked key assumptions when large differences showed up between regions.
Distribution of primary research fieldwork respondents
| Company type | Respondent position | Region |
|---|---|---|
| Top tier: 32% | CXOs: 20% | APAC: 47% |
| Mid tier: 46% | Functional/Unit leaders: 35% | EMEA: 30% |
| Smaller Players: 22% | Managers: 45% | Americas: 23% |
Market-Sizing & Forecasting
Sizing starts from a top-down demand pool build that links oral-care consumer counts to adoption of powered brushes, and then it is converted into annual unit demand using replacement cycles for handles and brush heads. Country outputs are then priced using observed retail price bands by channel, before being rolled up to regional and global totals. Once the top-down totals were stable, we corroborated them with selective bottom-up checks, including sampled brand and channel price points, distributor feedback on volume direction, and a light supplier roll-up where public financial disclosures allowed it.
A few inputs that materially shaped the model were rechargeable versus battery powered mix, brush head replacement frequency, online versus offline share shifts, premiumization (smart features and bundled heads), and currency timing for conversion into USD. Forecasting relied on scenario analysis, where adoption and pricing were projected under a base case aligned to expert views, and then stress-tested for slower upgrades or faster premium penetration. In markets with limited visibility, gaps were handled using proxy indicators such as import reliance, retail penetration of oral-care devices, and comparable price ladders from similar economies, followed by interview-led adjustment.
Data Validation & Update Cycle
Outputs were cross-checked against independent signals like import trends for powered oral-care devices, visible retail pricing, and whether implied per-household spending looked realistic by income tier. If a country showed an unusual jump in value without a matching shift in units or prices, it was flagged for rework and reviewed again with fresh checks. Before sign-off, assumptions and calculations were reviewed in multiple steps by another analyst to catch formula issues and scope leaks early.
Reports are refreshed each year, and interim updates are done when there are material events such as major price resets, large launches, or demand shocks in key regions. Before delivery, the model is re-run with the latest macro inputs and spot-checked against the newest public updates so clients receive a current view.
Mordor Intelligence's Electric Toothbrush Market Size Compared With Other Published Estimates
Published market values for electric toothbrushes often differ because teams make different calls on what products count, which price point is used in the value chain, and whether recurring brush head revenue is treated as part of the market. Differences also show up when one estimate uses a limited country set, or when the pricing curve is assumed to rise faster than what retailers and dentists are seeing.
The gap drivers in this category are usually practical. Some studies count only rechargeable handles and drop battery powered units, some do not add brush head replacements, and some blend adjacent oral-care devices into the total. Currency conversion timing and update cadence also matter, because promotions and price moves can change the value outcome quickly across regions.
Benchmark comparison
| Source | Market Size | Gaps in Research Methodology |
|---|---|---|
| Mordor Intelligence | USD 6.75 B (2026) | |
| Global Consultancy A | USD 4.36 B (2024) | Anchors sizing in an earlier year and does not clearly state whether replacement brush heads are included, which can reduce the recurring value component when compared to a scope that counts head replenishment. |
| Industry Publisher B | USD 3.40 B (2024) | Builds the market mainly around handle types and end-user splits, and the narrower value build can miss retail sell-out effects and recurring head purchases in countries where replacement is a large share. |
The table shows a wide spread that is mainly explained by year alignment and what is counted beyond the handle. In Mordor Intelligence's model, replacement brush heads are included, and value is traced to retail sell-out pricing rather than factory-level numbers. When scope and pricing point are explicit, the remaining differences are easier to reconcile through adoption, mix, and price assumptions that can be checked with interviews and public signals.


Key Questions Answered in the Report
How large is the electric toothbrush market in 2026?
It stands at USD 6.75 billion and is tracking toward USD 9.85 billion by 2031 at a 7.25% CAGR.
Which brushing technology is growing fastest?
Sonic and ultrasonic models are advancing at 9.95% CAGR on the strength of high-frequency fluid-dynamics cleaning.
What share do rechargeable devices hold?
Rechargeable handles accounted for 82.14% of 2025 sales and continue to anchor revenue as battery regulations favor the format.
Which region will outpace others to 2031?
Asia-Pacific is projected to expand at 8.74% CAGR, boosted by rising incomes in China and India.
Page last updated on:


 Your data is secure and never sold or shared.


