
Market Overview
| Study Period | 2021 - 2031 |
|---|---|
| Market Size (2026) | USD 158.64 Billion |
| Market Size (2031) | USD 241.30 Billion |
| Growth Rate (2026 - 2031) | 8.75 % |
| Fastest Growing Market | Asia Pacific |
| Largest Market | Asia Pacific |
| Market Concentration | Medium |
Major Players *Disclaimer: Major Players sorted in no particular order Image © Mordor Intelligence. Reuse requires attribution under CC BY 4.0. | |
Electric Motor Market Analysis by Mordor Intelligence
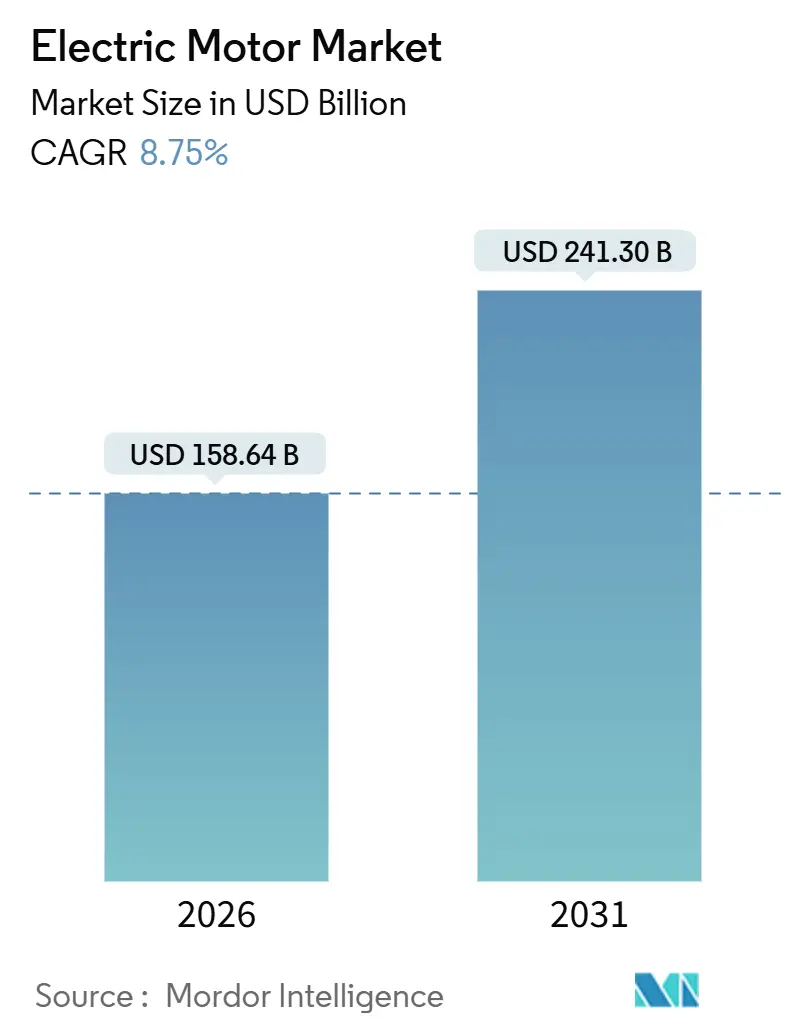
The Electric Motor Market size is estimated at USD 158.64 billion in 2026, and is expected to reach USD 241.30 billion by 2031, at a CAGR of 8.75% during the forecast period (2026-2031).
Demand pivots on three intertwined vectors: the scale-up of battery electric vehicles, rapid automation inside factories, and energy-efficiency mandates that push every rotating machine toward premium‐class performance. In China, new energy vehicles surpassed 14.78 million unit sales during January–November 2025, amplifying traction-motor procurement across the supply chain. Europe’s 16.4 gigawatts of offshore wind capacity additions in 2024 require thousands of multi-megawatt permanent-magnet synchronous machines that convert rotor speed into grid-ready power.[1]WindEurope, “Offshore Wind Statistics 2024,” windeurope.org Parallel dynamics in North America’s HVAC retrofit wave and Asia-Pacific’s robotics adoption reinforce structural demand, moving the Electric Motors market away from price-first induction machines toward variable-speed, high-torque architectures.
Key Report Takeaways
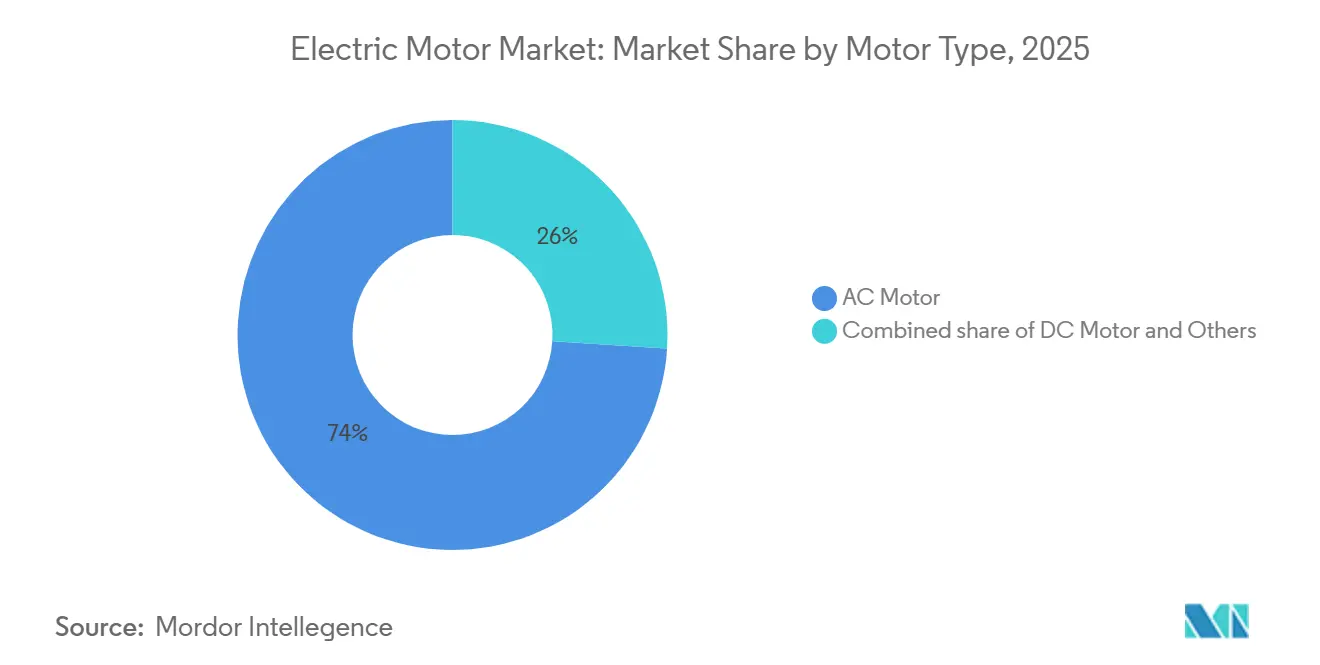
- By motor type, AC units held 74% of the Electric Motors market share in 2025, while synchronous sub-types are advancing at a 9.45% CAGR through 2031.
- By output power rating, fractional-horsepower designs captured 51.4% of 2025 revenue, whereas motors above 500 horsepower are expanding at a 7.8% CAGR to 2031.
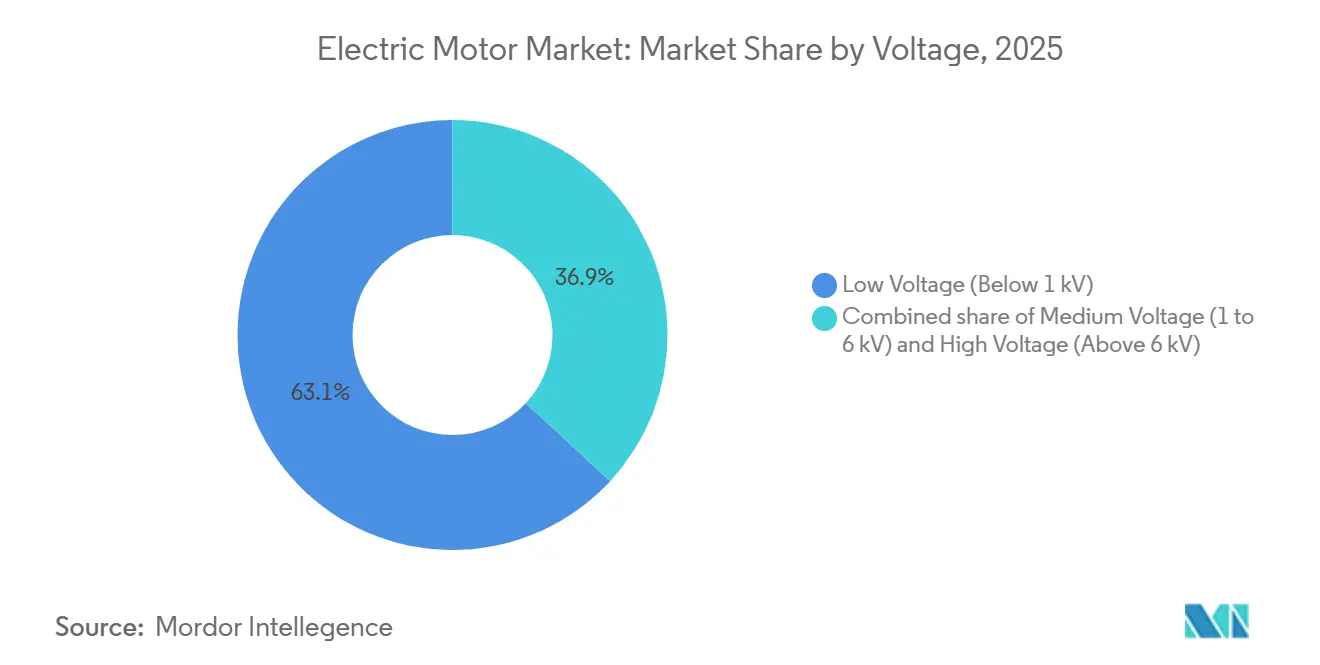
- By voltage, low-voltage machines accounted for 63.1% of 2025 sales, but medium-voltage variants are rising at an 8.3% CAGR on the back of utility and heavy-industry upgrades.
- By application, industrial machinery retained a 42.2% share in 2025, while automotive and transportation represent the fastest trajectory at an 11.9% CAGR.
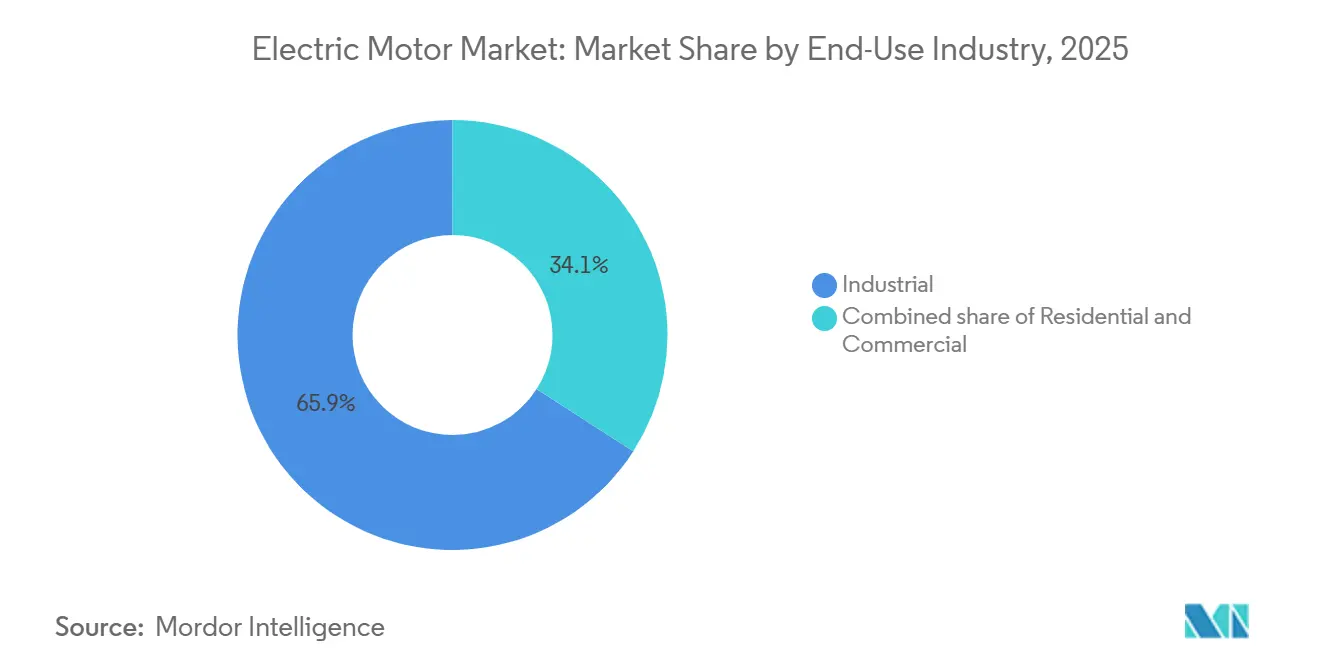
- By end-use industry, the industrial sector commanded 65.9% of the electric motor market size in 2025 and will grow at 9.1% through 2031.
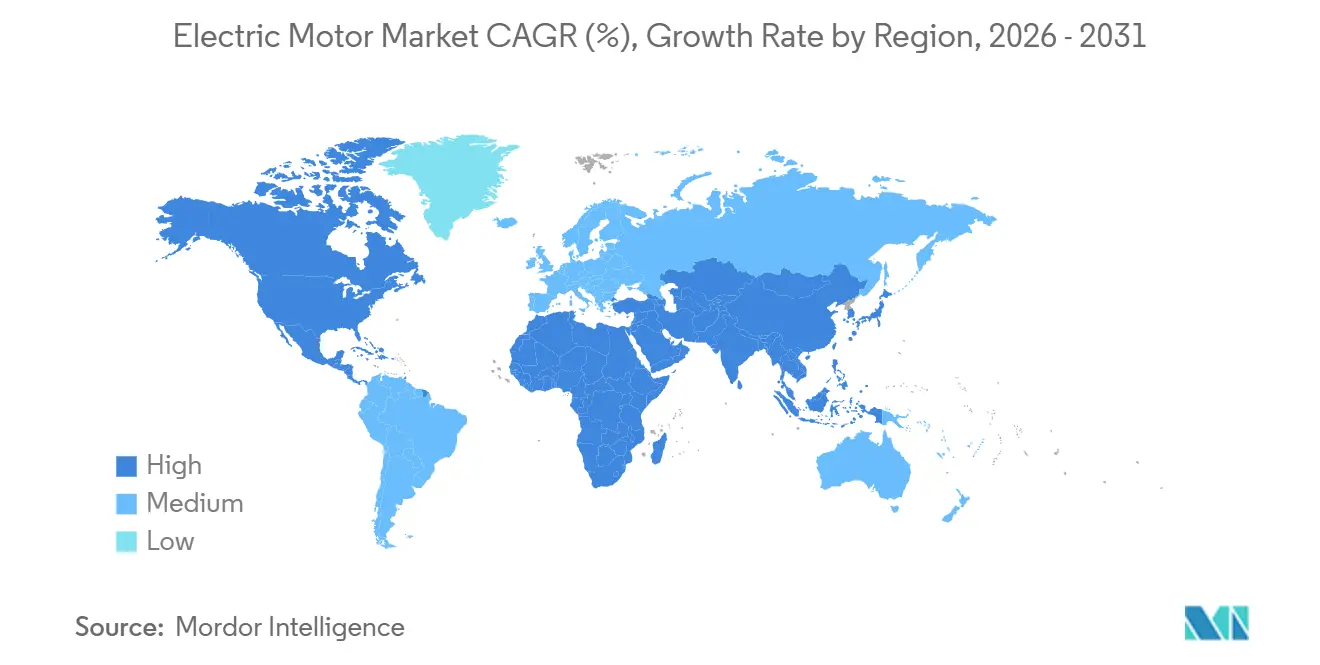
- By geography, Asia-Pacific commanded 43.8% of global revenue in 2025 and is forecast to compound at 10.7% a year through 2031.
Note: Market size and forecast figures in this report are generated using Mordor Intelligence’s proprietary estimation framework, updated with the latest available data and insights as of January 2026.
Market Trends and Insights
Drivers Impact Analysis of Electric Motor Market*
| Driver | (~) % Impact on CAGR Forecast | Geographic Relevance | Impact Timeline |
|---|---|---|---|
| Rapid Electrification of Manufacturing Automation in Asia's Discrete Industries | 1.8% | Asia-Pacific core, spillover to North America & Europe | Medium term (2-4 years) |
| Accelerating HVAC Adoption in US Residential Retrofits Driven by Federal Energy Standards | 1.2% | North America, secondary impact in Europe | Short term (≤ 2 years) |
| Surging Offshore Wind Turbine Installations Requiring High-Power Permanent-Magnet Motors in Europe | 1.5% | Europe, emerging in Asia-Pacific coastal regions | Long term (≥ 4 years) |
| Battery Electric Vehicle Powertrain Ramp-Up in China Catalyzing High-Efficiency Traction Motors Demand | 2.1% | China dominant, expanding to India, Southeast Asia | Medium term (2-4 years) |
| Industrial IoT-Enabled Predictive Maintenance Boosting Replacement of Aging Motors in North America | 0.9% | North America, gradual adoption in Europe | Medium term (2-4 years) |
| Government Mandates on MEPS Propelling IE4 & IE5 Motor Sales Globally | 1.3% | Global, led by EU, China, India | Long term (≥ 4 years) |
| Source: Mordor Intelligence | |||


Rapid Electrification of Manufacturing Automation in Asia’s Discrete Industries
Robot-dense assembly lines across China, Japan, South Korea, and the ASEAN region are embedding four to seven servo axes in each new unit. The International Federation of Robotics counted 542,000 installations worldwide in 2024, more than 70% of which landed in Asia-Pacific.[2]International Federation of Robotics, “World Robotics Report 2024,” ifr.org Every joint needs a compact, high-precision motor, raising average motor value per robot and pulling demand toward brushless DC and permanent-magnet synchronous designs with integrated feedback. India’s electronics Production-Linked Incentive scheme has allocated USD 1.5 billion in subsidies, spurring local sourcing of motors to qualify for tariff relief. Original-equipment manufacturers now specify duty-cycle-resilient windings and temperature-resistant insulation, shifting procurement criteria from unit price to lifetime throughput.
Accelerating HVAC Adoption in US Residential Retrofits Driven by Federal Energy Standards
The U.S. Department of Energy’s updated SEER2 rules, finalized in 2024, effectively require electronically commutated motors in blower assemblies, setting off a replacement surge across millions of homes.[3]U.S. Department of Energy, “Residential HVAC SEER2 Final Rule 2024,” energy.gov Variable-speed ECMs cut electricity use by up to 30% relative to permanent split-capacitor motors, a benefit that utilities in California and Texas monetize through demand-response incentives. Motor vendors are bundling diagnostics and cloud-based warranties, framing the motor as a gateway to service revenue rather than a one-time component sale. Installers initially wary of 40–60% price premiums have shifted stance as federal tax credits shorten payback periods to two heating seasons.
Surging Offshore Wind Turbine Installations Requiring High-Power Permanent-Magnet Motors in Europe
Direct-drive generators inside 12- to 15-megawatt offshore turbines eliminate gearboxes and lower maintenance costs but depend on neodymium-iron-boron magnets that remain 85% sourced from China.[4]U.S. Geological Survey, “Rare Earths 2025 Summary,” usgs.gov European OEMs have responded by piloting dysprosium-free chemistries and segmental stator assemblies that ship in smaller pieces, easing port-handling constraints. With each generator weighing roughly 450 tons, specialized jack-up vessels are booked out through 2028, making motor modularity as important as raw efficiency to hit project schedules.
Battery Electric Vehicle Powertrain Ramp-Up in China Catalyzing High-Efficiency Traction Motors Demand
China’s 14.78 million new-energy vehicle deliveries through November 2025 cement its role as the epicenter of traction-motor demand. Permanent-magnet synchronous machines rated 100–300 kilowatts pair with silicon-carbide inverters that cut switching losses by up to 40% compared with silicon IGBTs. Cost declines have enabled dual-motor all-wheel-drive configurations in sub-USD 30,000 sedans, tripling motor units per vehicle relative to early-generation BEVs. Vertically integrated automakers that design motors, inverters, and batteries are capturing share from pure-play motor specialists.
Restraints Impact Analysis of Electric Motor Market*
| Restraint | (~) % Impact on CAGR Forecast | Geographic Relevance | Impact Timeline |
|---|---|---|---|
| Volatile Neodymium Prices Pressuring Permanent-Magnet Motor Economics | -0.7% | Global, acute in Europe & North America | Short term (≤ 2 years) |
| Supply Constraints of IGBT Modules Limiting High-Voltage Motor Production | -0.5% | Global, concentrated in automotive & industrial segments | Medium term (2-4 years) |
| Lengthy Certification Cycles for Explosion-Proof Motors in Middle-East Oil & Gas | -0.3% | Middle East, secondary impact in North Africa | Long term (≥ 4 years) |
| Growing Adoption of Integrated Servo Drives Reducing Stand-Alone Motor Revenue Opportunities | -0.6% | Global, led by Asia-Pacific & Europe | Medium term (2-4 years) |
| Source: Mordor Intelligence | |||
Volatile Neodymium Prices Pressuring Permanent-Magnet Motor Economics
Neodymium oxide prices spiked 15% during 2024 as Chinese supply faced quota adjustments, squeezing manufacturers that commit to fixed-price automotive contracts. Magnets represent up to 30% of a traction motor’s bill of materials, so pricing swings erode already-thin margins. Stockpiling inventory locks working capital and risks devaluation, pushing some vendors to investigate induction or switched-reluctance alternatives that sidestep rare-earth dependence at modest efficiency penalties.
Supply Constraints of IGBT Modules Limiting High-Voltage Motor Production
Lead times for 1,200- to 3,300-volt IGBT modules stretched to 40 weeks in 2024, as automotive OEMs secured priority allocations from power-semiconductor foundries. Industrial orders consequently slipped into 2026, delaying installation of medium-voltage drives in steel, cement, and utility projects. Silicon-carbide MOSFETs ease thermal constraints but carry two-to-three-fold cost premiums and face wafer-capacity bottlenecks. Some motor designs now target lower switching frequencies, trading harmonic noise for faster component availability.
*Our forecasts treat driver/restraint impacts as directional, not additive. The impact forecasts reflect baseline growth, mix effects, and variable interactions.
Electric Motor Market Segment Analysis
By Motor Type:
AC Lead Sustains, DC Niches SurgeAC machines accounted for 74% of the Electric Motors market revenue in 2025 and are set to grow 9.45% yearly, underpinned by entrenched use in pumps, compressors, and HVAC blowers. Induction models dominate fixed-speed duties, but synchronous variants are picking up share wherever variable-frequency drives unlock precision and energy gains. Adoption of IE4 and IE5 classes in Europe has accelerated synchronous uptake, particularly in frame sizes above 0.75 kilowatts. DC architectures hold ground in automotive, power tools, and small appliances, where torque density and battery compatibility outweigh higher upfront cost. Brushless DC motors now ship inside nearly every premium vacuum cleaner, extending run time per charge by up to 40%.
A rising hybrid class blends induction robustness with permanent-magnet rotors, delivering IE4 efficiency while starting direct-on-line, a feature valued in developing markets that lack ubiquitous inverter infrastructure. Specialty formats, hermetic, stepper, and axial-flux, remain small yet profitable niches tied to refrigeration, 3-D printing, and mobility startups. As performance envelopes overlap, purchasing decisions hinge less on taxonomy and more on application-specific metrics such as acoustic signature, thermal headroom, or torque-per-kilogram.


By Output Power Rating:
Household Staples Versus Industrial HeavyweightsMotors below 1 horsepower held 51.4% of 2025 shipments, reflecting ubiquity across refrigerators, washing machines, and payment terminals. Price elasticity rules this tranche: a USD 3 cost delta can flip sourcing decisions, yet ENERGY STAR thresholds force incremental efficiency gains year after year. Integral-horsepower machines between 1 and 500 horsepower serve conveyors, compressors, and machine tools where downtime costs dwarf equipment prices. The Electric Motors market size for this middle band continues to expand as factories retrofit IE4 models to capture up to 5% energy savings.
High-power units above 500 horsepower, though smaller in volume, are forecast to grow 7.8% annually to 2031 on the replacement of aging assets in mining and petrochemicals. Operators weigh rewind services that recover only original IE1 or IE2 efficiency against new-build IE4 alternatives with 3- to 4-year paybacks at current energy tariffs. Some OEMs now offer modular stator-rotor cartridges that upgrade legacy frames in situ, bridging the gap between full replacement and refurbishment.
By Voltage:
Volume at Low End, Growth in Medium RangeLow-voltage machines (<1 kV) delivered 63.1% of 2025 revenue, thanks to household and light-industrial saturation and cost efficiencies born from automated coil-winding and globalized supply chains. Yet process-industry clients are shifting toward 1- to 6-kilovolt grades that allow multi-megawatt loads while holding current levels manageable. Medium-voltage units are advancing 8.3% per year as variable-frequency drives cut energy use by up to 40% in cooling-tower fans and boiler-feed pumps.
Ultra-high-voltage motors beyond 6 kilovolts power LNG compressors and pipeline booster stations, each project custom-engineered with lead times that stretch past one year. Grid-support synchronous condensers have opened a boutique medium-voltage sub-segment, selling reactive-power services as renewables displace thermal generators.
By Application:
Industrial Base Steady, Mobility AcceleratesIndustrial machinery controlled 42.2% of 2025 deployment, with robot cells and CNC machines absorbing hundreds of thousands of servo axes. Growth is tied to capital-spending cycles, yet predictive-maintenance playbooks temper replacement risk by scheduling swaps during planned outages. HVAC and refrigeration demand continues to migrate toward variable-speed compressors that modulate in real time, saving up to 35% energy in grocery chains and data centers.
Automotive and transportation represent the fastest trajectory at an 11.9% CAGR, as each battery electric vehicle integrates multiple traction and auxiliary motors. Mass-market sedans now routinely use three or more motors, tripling content relative to combustion platforms. Residential appliances remain mature in revenue yet enormous in volume; innovations center on noise reduction and smart-home connectivity rather than raw performance. Utilities and energy applications see fresh orders for IE4 pumps and fans coupled with drives that align motor speed to fluctuating renewable inputs.
By End-Use Industry:
Industrial Segment Dominant Amid Policy-Driven RetrofitsThe industrial end-use cluster generated 65.9% of 2025 sales and will grow 9.1% annually through 2031 as plants digitize maintenance and upgrade to higher-efficiency classes. Commercial buildings replace elevator hoists and HVAC drives to hit green-building certifications, while residential uptake hinges on federally incentivized heat-pump installations that mandate ECMs in blower modules. A notable behavioral shift involves homeowners shifting HVAC operation to daytime solar-production windows, favoring variable-speed motors that throttle power draw dynamically.
Geography Analysis
APAC Electric Motor Market
Asia-Pacific retained a 43.8% Electric Motors market share in 2025 and is tracking a 10.7% CAGR to 2031. Chinese automakers delivered 14.78 million new-energy vehicles through November 2025, a vector that multiplies traction-motor demand as sedans transition to dual-motor layouts. Robotics installations across the region surpassed 70% of the global 542,000 units in 2024, each cell requiring up to seven precision motors. India’s Production-Linked Incentive subsidies channel USD 1.5 billion into electronics and motor production, while Vietnam and Thailand attract appliance assembly lines that localize sourcing and compress lead times.
North America Electric Motor Market
North American momentum stems from HVAC retrofits mandated by DOE SEER2 standards and industrial predictive-maintenance rollouts. A 2024 survey recorded 38% of replacements triggered by sensor alerts rather than time-based schedules, indicating a data-driven paradigm in asset management. Canada’s mining sector is moving to IE4 high-horsepower upgrades to mitigate electricity costs above USD 0.12 per kilowatt-hour in remote zones. Mexico’s near-shoring influx for automotive and white goods manufacturing tightens regional supply chains and boosts medium-voltage motor uptake in new production halls.
Europe Electric Motor Market
Europe’s landscape is policy-led. Ecodesign regulations require IE4 compliance today and foreshadow IE5 thresholds by 2027. Offshore wind additions of 16.4 gigawatts in 2024 underpin multi-megawatt generator demand, while Germany’s process industries adopt variable-frequency drives that shave 20–40% energy use. The United Kingdom’s heat-pump push and Nordic reliance on hydropower converge on motors that operate efficiently under variable loads. Eastern European factories benefit from EU cohesion-fund grants to modernize equipment, nudging adoption of premium-efficiency ratings.
South America and Middle East Electric Motor Market
South America’s mix is commodity-driven: Brazil’s agribusiness relies on irrigation and grain-handling motors that survive high heat and dust, whereas Argentina’s lithium mines deploy high-horsepower crushers under IE4 specifications to meet investor sustainability covenants. In the Middle East, oil and gas operators demand explosion-proof units with ATEX and IECEx tags, a certification hurdle that stretches supply timelines but locks in premium pricing. Gulf states invest in district-cooling and desalination systems, fueling medium-voltage pump procurement.

Regulatory Landscape
Energy-efficiency regulation shapes motor design, labeling, and procurement globally. In the United States, the Department of Energy issued a final rule in January 2025 covering expanded-scope electric motors, with compliance required from January 1, 2029. This requires OEMs and channel suppliers to align product lines, documentation, and certification workflows ahead of the deadline.
International and European standardization also tightened the efficiency baseline. IEC 60034-30-1 was updated in December 2025 to introduce IE5 efficiency class limits for line-operated AC motors, and Europe adopted EN IEC 60034-30-1:2026 in January 2026, reinforcing a harmonized reference point for premium-efficiency claims in tendering and cross-border trade. In parallel, the European Commission opened a public consultation in August 2025 to revise Ecodesign Regulation (EU) 2019/1781 for electric motors and variable speed drives, indicating an active policy cycle that affects both standalone motor specifications and motor-plus-drive compliance strategies.
Competitive Landscape
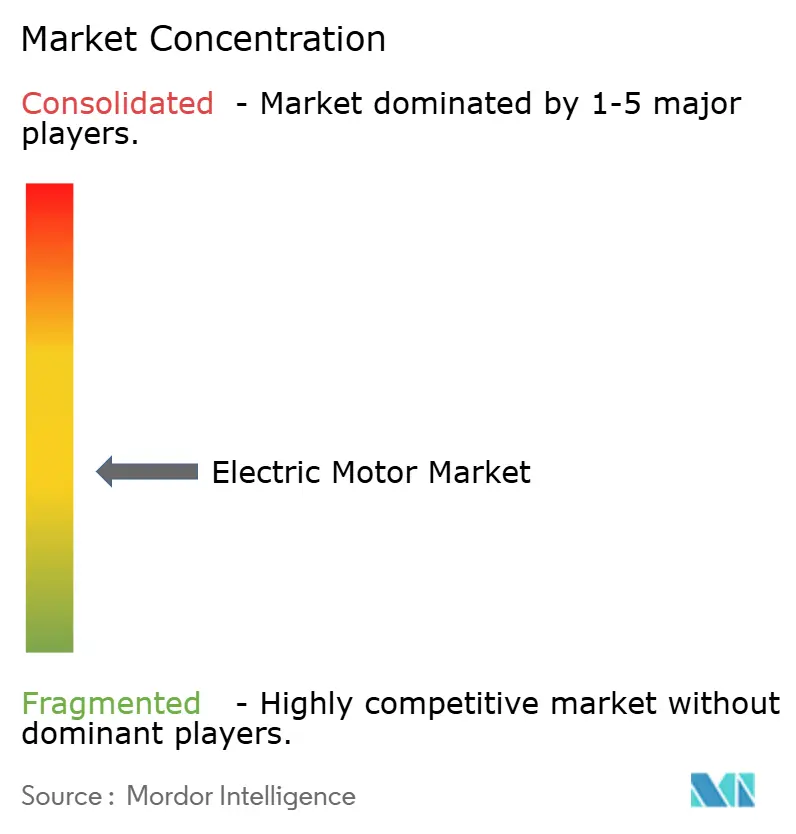
The Electric Motors market features moderate concentration. ABB, Siemens, Nidec, and Regal Rexnord anchor global supply with extensive installed bases and service arms. Chinese manufacturers dominate fractional-horsepower volumes, undercutting prices by up to 30% and pushing Western incumbents toward premium features and digital services. High-power and explosion-proof niches remain fragmented because certification cycles and custom engineering erect switching barriers.
Strategic moves illustrate convergence between motor hardware and power electronics. Siemens acquired axial-flux assets in 2024 to expand e-mobility reach, while ABB opened a Houston remanufacturing hub capable of restoring 500-horsepower machines to IE4 levels at 40% of new-build cost. Nidec’s USD 500 million Vietnamese expansion in 2025 adds magnet assembly lines that slash lead times to six weeks. Patent filings spotlight silicon-carbide inverter integration, claiming 30–40% system-loss reductions.
Localization trends empower regional challengers. Indian vendors leverage rupee-denominated pricing to win industrial contracts, and Turkish suppliers use Arabic language support to penetrate Gulf markets. Digital offerings such as cloud-based vibration analytics differentiate incumbents, turning the motor into a data node that feeds subscription revenue. Circular-economy mandates in Europe favor players with reverse-logistics scale, potentially accelerating consolidation as smaller importers struggle to finance take-back programs.
Electric Motor Industry Leaders
ABB Ltd.
Siemens AG
Nidec Corporation
Regal Rexnord Corporation
WEG S.A.
- *Disclaimer: Major Players sorted in no particular order
Electric Motor Market Companies Covered in this Report
- ABB Ltd.
- Siemens AG
- Nidec Corporation
- Regal Rexnord Corporation
- WEG S.A.
- Toshiba Corporation
- Hitachi Ltd.
- Rockwell Automation, Inc.
- AMETEK, Inc.
- Johnson Electric Holdings Ltd.
- TECO Electric & Machinery Co., Ltd.
- Mitsubishi Electric Corporation
- Baldor Electric Company
- Brook Crompton Holdings Ltd.
- Anhui Wannan Electric Machine Co., Ltd.
- Kirloskar Electric Company Ltd.
- Hyosung Heavy Industries
- Danaher Motion (Kollmorgen)
- Yaskawa Electric Corporation
- Fuji Electric Co., Ltd.
- Robert Bosch GmbH
- Schneider Electric SE
- SEW-Eurodrive GmbH & Co. KG
- Emerson Electric Co.

Market Opportunities and Future Outlook
Industrial electrification and energy-efficiency compliance create room for premium-efficiency motors and motor-system upgrades, especially in medium- and high-voltage applications where end users focus on large absolute energy savings. The January 2025 DOE expanded-scope rule (effective January 1, 2029) and Europe’s Ecodesign Regulation review are driving product refreshes and replacement planning, supporting demand for higher-efficiency AC motors, synchronous architectures, and packaged motor solutions that help OEMs and distributors assemble compliance evidence.
Capacity buildouts in Asia point to near-term supplier bets on high-power industrial demand and localized supply chains. In June 2026, Innomotics commenced production at its Tianjin factory in China following an RMB 600 million investment, with 2,500 MW annual capacity for high-voltage and high-power low-voltage motors. In April 2026, Inovance Technology broke ground on an RMB 2 billion facility in Dalian focused on high-voltage permanent magnet synchronous motors. In India, Schneider Electric increased capex by INR 184 crore at its Kolkata facility in July 2026 to expand medium-voltage component capacity to 250,000 units annually, reinforcing an opportunity set around regional manufacturing, faster lead times for industrial projects, and tighter integration between motors, drives, and medium-voltage electrical equipment.
Recent Industry Developments in Electric Motor Market
- May 2026: ABB announced what it described as the world’s first magnet-free IE6 synchronous reluctance motor certified for ATEX and IECEx hazardous areas. The launch targets high-spec oil and gas and process-industry environments where certification constraints and efficiency mandates shape buying decisions, and it positions magnet-free architectures as a differentiator amid rare-earth price volatility.
- September 2025: ABB India unveiled an IE5 ultra-premium motor line designed to avoid rare-earth materials and disclosed an investment of more than INR 140 crore to expand and modernize its low-voltage motor manufacturing footprint in India. The combination of product and capacity actions supports local sourcing strategies for OEMs and industrial users seeking premium-efficiency compliance and shorter supply lead times.
- October 2024: The International Federation of Robotics reported 542,000 robot installations worldwide in 2024, with more than 70% in Asia-Pacific. Higher robot density raises servo-axis counts per production line and increases pull-through demand for compact, high-precision motors, accelerating the shift toward BLDC and permanent-magnet synchronous designs with integrated feedback.


Electric Motor Market Report Scope and Research Methodology
Market Definition and Coverage
This market covers revenue generated from the sale of new electric motors that are shipped as standalone units through OEM, distributor, and replacement channels across major end-use settings worldwide.
Scope exclusions: Refurbished or remanufactured motors, linear actuators, and standalone motor drives are excluded from this market size.
Segments Covered in This Report
- By Motor Type
- AC Motor (Induction (Asynchronous), Synchronous)
- DC Motor (Brushed, Brushless (BLDC))
- Others (Hermetic Motor, Stepper Motor)
- By Output Power Rating
- Fractional Horsepower (Below 1 HP)
- Integral Horsepower (1 to 500 HP)
- High-Power (Above 500 HP)
- By Voltage
- Low Voltage (Below 1 kV)
- Medium Voltage (1 to 6 kV)
- High Voltage (Above 6 kV)
- By Application
- Industrial Machinery
- HVAC and Refrigeration
- Automotive and Transportation
- Residential Appliances
- Utilities and Energy
- Others (Agriculture, Oil and Gas, Mining)
- By End-Use Industry
- Residential
- Commercial
- Industrial
- By Geography
- North America
- United States
- Canada
- Mexico
- Europe
- United Kingdom
- Germany
- France
- Spain
- NORDIC Countries
- Russia
- Rest of Europe
- Asia-Pacific
- China
- India
- Japan
- South Korea
- Malaysia
- Thailand
- Indonesia
- Vietnam
- Australia
- Rest of Asia-Pacific
- South America
- Brazil
- Argentina
- Colombia
- Rest of South America
- Middle East and Africa
- United Arab Emirates
- Saudi Arabia
- South Africa
- Egypt
- Rest of Middle East and Africa
- North America
Data Sources, Market Sizing, and Validation
Desk Research
Desk work starts by building the fact base on how many motors are being made, traded, and installed, and how pricing is moving by application. Public releases, such as US Energy Information Administration (EIA) updates, Eurostat industrial production series, UN Comtrade trade statistics, and International Energy Agency (IEA) datasets, are used to anchor macro demand signals that electric motors tend to follow.
We also review technical and regulatory context from sources such as IEC efficiency standard references, US DOE efficiency-related material, and peer-reviewed journals that discuss motor efficiency, duty cycles, and failure rates in common applications. To connect these indicators back to revenue, we rely on company annual reports and investor presentations, along with reputable press coverage, and we may use paid subscriptions for company financials and intelligence, patent databases, and shipment-level import and export data where it helps verify directional trends. These desk research sources are illustrative and not exhaustive, since many other public references were used for data collection, cross-checks, and clarification.
Primary Interviews and Surveys
Primary conversations were completed with a mix of motor manufacturers, channel partners, and large end users, so we could confirm what is actually being bought, at what typical price bands, and how replacement cycles are trending. Since this is a global market, feedback was balanced across key regions, and we used these inputs to close gaps left by public data and to sanity-check the final model outputs.
Distribution of primary research fieldwork respondents
| Company type | Respondent position | Region |
|---|---|---|
| Top tier: 35% | CXOs: 12% | APAC: 41% |
| Mid tier: 51% | Functional/Unit leaders: 32% | EMEA: 33% |
| Smaller Players: 14% | Managers: 56% | Americas: 26% |
Market-Sizing & Forecasting
Market size is developed using a top-down build that reconstructs demand from a practical pool of motor-consuming activity, and then translates that into revenue using application-linked pricing. We start from indicators like industrial production and output in motor-heavy sectors, building construction and HVAC equipment shipments, electrification trends in transport, and trade flows of electric motors, then adjust using penetration and replacement assumptions gathered in interviews.
To keep the model grounded, we corroborate totals with selective bottom-up approximations, such as sampling average selling prices by motor class and pairing them with implied volumes, plus supplier and channel checks to test whether the resulting revenue looks reasonable by region. Key inputs used include efficiency upgrade cycles (for example, IE2 to IE3 type shifts), unit mix between AC and DC motors, the share of motors going into OEM builds versus replacement demand, regional price dispersion and currency timing, and lead-time driven inventory effects that can pull demand forward or push it out.
Forecasts are prepared using scenario analysis supported by expert views, since motor demand can move differently by end use when industrial capex, construction, and transportation cycles diverge. Where bottom-up signals are incomplete, gaps are handled by applying conservative ranges from primary feedback and then rechecking the implied volumes against trade and production signals before finalizing.
Data Validation & Update Cycle
Outputs are validated through multiple checks so obvious overcounts and missing pools are caught early. We compare the modeled revenue trajectory against independent signals like industrial output trends, trade values, and the expected direction of pricing and efficiency-driven upgrades, and then outliers are reviewed by another analyst before sign-off.
If a variance is too large, follow-ups are triggered with interviewees to confirm whether it is a real market move or a modeling assumption that needs to be reset. Reports are refreshed annually, and interim updates are completed when material events occur, such as policy changes tied to motor efficiency or sharp shifts in industrial activity. Before delivery, a final review pass is done so clients receive the most current view available at that time.
Mordor Intelligence's Electric Motor Sales Market Size Compared Against Other Published Estimates
Published market sizes for electric motors often do not match because the scope and the counting method can change even when the title looks similar. Differences usually come from whether embedded motors are treated as motor revenue or as part of finished equipment, how refurbished demand is handled, and which base year and currency timing are used.
Refurbished and remanufactured motors sit outside Mordor Intelligence's scope, which can pull the total down versus studies that blend new and aftermarket value without clearly separating them. Another frequent driver is how motors inside appliances or vehicles are priced, since some estimates use finished-product values or broad multipliers, while others map transfer-price style benchmarks to isolate motor-only revenue, and then refresh those assumptions more often when steel, copper, and energy costs move.
Benchmark comparison
| Source | Market Size | Gaps in Research Methodology |
|---|---|---|
| Mordor Intelligence | USD 158.64 B (2026) | |
| Trade Journal A | USD 152.20 B (2024) | Uses an earlier base year and a shorter horizon, and the published note does not clarify exclusions like remanufactured units or whether embedded motors are priced as motor-only revenue or as part of finished equipment values. |
| Global Consultancy B | USD 214.59 B (2024) | Appears to use a broader application umbrella and may fold in adjacent categories (such as motor systems in automotive and consumer equipment) without a consistent separation of standalone motor sales and non-motor components, which can raise the reported revenue total. |
The table shows that the spread is mainly explained by what gets counted and how pricing is isolated, not just by different growth assumptions. By keeping inclusions and exclusions clear and tying revenue to repeatable demand indicators plus interview-checked price logic, the resulting market size stays traceable and easier to reconcile across years.


Key Questions Answered in the Report
What is the projected value of the electric motors market in 2031?
Forecasts place the electric motors market at USD 241.30 billion by 2031.
Which region leads global demand?
Asia-Pacific holds 43.8% of 2025 revenue and is growing at the fastest 10.7% CAGR.
Why are integrated servo drives gaining popularity?
They combine motor, inverter, and encoder in one housing, cutting wiring by 60% and speeding commissioning by 40%, especially valuable in robotics and packaging.
How do rare-earth price swings affect motor producers?
A 15% neodymium spike in 2024 raised magnet costs that can represent 30% of a traction motor’s bill of materials, pressuring margins and spurring interest in alternative topologies.
What efficiency classes are mandatory in Europe today?
The EU’s Ecodesign rules require IE4 efficiency for most industrial motors and are assessing IE5 adoption by 2027.
Page last updated on:


 Your data is secure and never sold or shared.


