
Market Overview
| Study Period | 2020 - 2031 |
|---|---|
| Market Size (2026) | USD 1.99 Billion |
| Market Size (2031) | USD 2.59 Billion |
| Growth Rate (2026 - 2031) | 5.39 % |
| Fastest Growing Market | Asia Pacific |
| Largest Market | Europe |
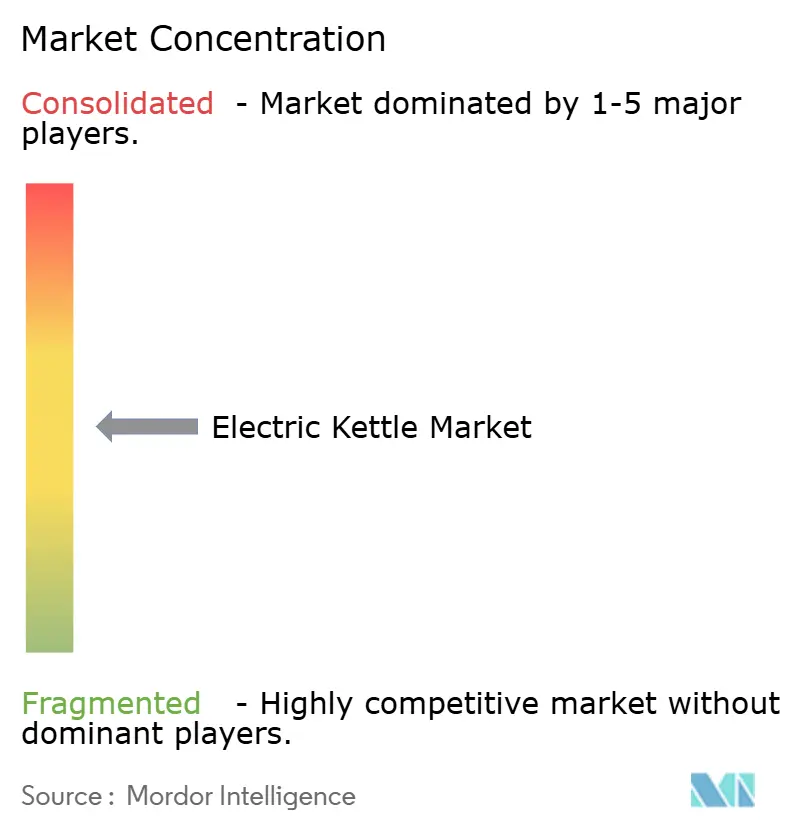
| Market Concentration | Medium |
Major Players *Disclaimer: Major Players sorted in no particular order Image © Mordor Intelligence. Reuse requires attribution under CC BY 4.0. | |
Electric Kettle Market Analysis by Mordor Intelligence
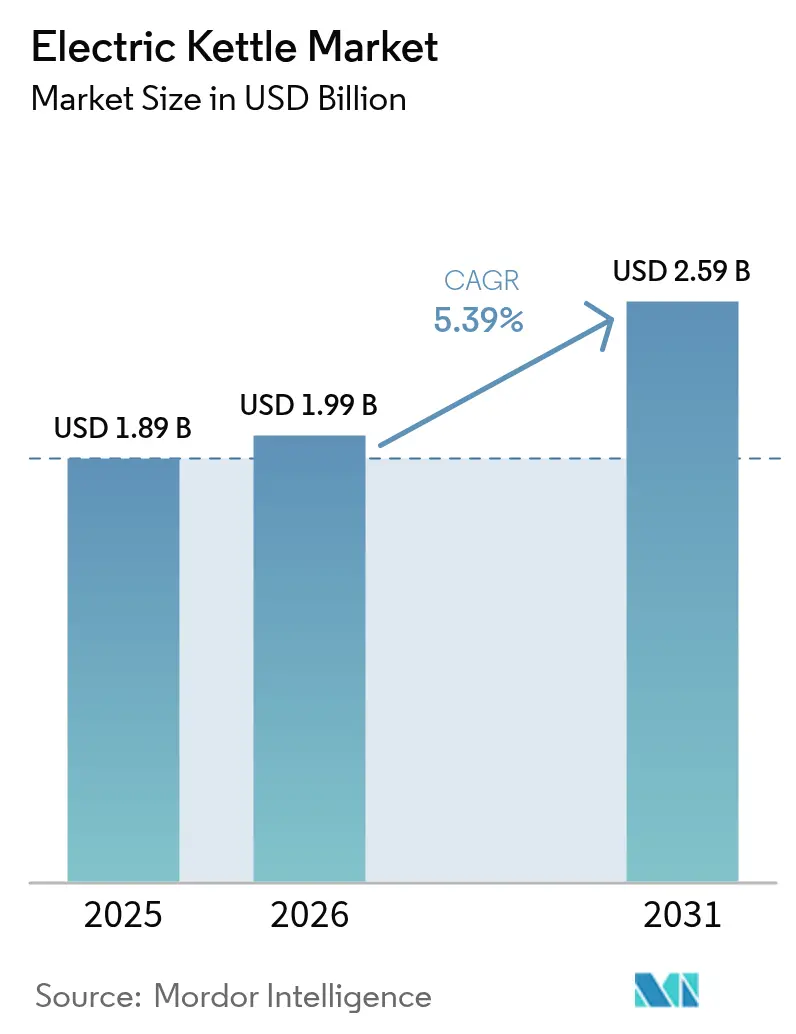
The electric kettle market size in 2026 is estimated at USD 1.99 billion, growing from 2025 value of USD 1.89 billion with 2031 projections showing USD 2.59 billion, growing at 5.39% CAGR over 2026-2031. Rising demand for smart, energy-efficient appliances, coupled with stricter standby-power rules, is re-shaping design priorities and propelling connected models into the mainstream. Europe’s 0.5-watt standby mandate that took effect in May 2025 accelerates innovation in heating elements, insulation materials, and firmware controls, while Asia-Pacific manufacturers exploit cost advantages and export momentum to serve both developing and mature consumer segments. Competitive rivalry remains moderate because the top five players control only most of the sales, yet differentiation through IoT integration, recyclable materials, and rapid-boil technologies provides defendable moats. Stainless steel remains the preferred construction material, but compact sub-1.0-liter kettles post the fastest growth as single-person urban households seek space-saving solutions and lower per-use energy consumption. Digital retail continues to erode the dominance of brick-and-mortar outlets, with online sales growing more than double the channel average.
Key Report Takeaways
- By product type, standard kettles led with 48.12% revenue share of the electric kettle market in 2025; smart/connected variants are advancing at a 9.86% CAGR through 2031.
- By material, stainless steel retained 57.92% of the electric kettle market share in 2025, whereas stainless steel is projected to post the highest growth at 5.53% CAGR to 2031.
- By capacity, the 1.0–1.5 L segment accounted for 64.02% of the electric kettle market size in 2025, while Less than 1.0 L models are expanding at a 7.68% CAGR between 2026-2031.
- By end-user, the residential segment accounted for 69.42% of the electric kettle market size in 2025, while the commercial segment is expanding at a 5.61% CAGR between 2026-2031.
- By distribution channel, supermarkets & hypermarkets held 43.52% share of the electric kettle market size in 2025, but online is growing at a 11.12% CAGR over the same period.
- By geography, Europe dominated with 33.84% revenue share of the electric kettle market in 2025, whereas Asia-Pacific is forecast to grow at 9.12% CAGR to 2031.
Note: Market size and forecast figures in this report are generated using Mordor Intelligence’s proprietary estimation framework, updated with the latest available data and insights as of 2026.
Global Electric Kettle Market Trends and Insights
Drivers Impact Analysis*
| Driver | (~) % Impact on CAGR Forecast | Geographic Relevance | Impact Timeline |
|---|---|---|---|
| Energy-efficient home appliance demand | +1.2% | Global, led by EU | Medium term (2-4 years) |
| Specialty tea & coffee chain expansion | +0.8% | North America & Europe, emerging APAC | Long term (≥ 4 years) |
| Smart/IoT-enabled kettle adoption | +1.5% | Global, developed markets lead | Short term (≤ 2 years) |
| Growth in single-person households | +0.9% | Urban centers worldwide | Long term (≥ 4 years) |
| Corporate pantry & co-working installations | +0.6% | North America, Europe, APAC metros | Medium term (2-4 years) |
| E-commerce flash sales | +0.7% | Global, strongest APAC | Short term (≤ 2 years) |
| Source: Mordor Intelligence | |||
Growing Demand for Energy-Efficient Home Appliances
Energy efficiency has moved from a purchase preference to a market admission ticket. Europe’s Regulation 2023/826 enforces a 0.5-watt standby-power ceiling, a benchmark many brands now treat as a floor to showcase superior engineering. The rule is reinforced by the Eco-design for Sustainable Products Regulation, which codifies recyclability and durability metrics that influence every phase of a kettle’s lifecycle [1]European Commission, “Ecodesign for Sustainable Products Regulation,” europa.eu. Chinese manufacturers have responded by launching greener lines that align with domestic energy-saving incentives while keeping export doors open. The convergence of policy pressure and operating-cost awareness ensures that energy labeling and actual consumption figures remain front-of-pack communication rather than footnotes. Early movers who meet or surpass the EU threshold already enjoy simplified market entry in regions preparing similar statutes.
Proliferation of Specialty Tea & Coffee Chains
Specialty cafés require water-heating equipment capable of tight temperature tolerances and repeated duty cycles, a demand profile materially different from household use. Their willingness to pay for reliability and flavour accuracy raises the performance bar and inadvertently educates consumers on the benefits of precision brewing. As more chains franchise into secondary cities, suppliers gain scale economies, which then spill over into premium consumer models. Manufacturers that validate designs in commercial settings transfer credibility to retail buyers, strengthening brand equity without heavy consumer advertising.
Adoption of Smart/IoT-Enabled Kettles
Smart variants command price premiums yet are posting double-digit volume growth, proving that connected features overcome higher initial outlays. Voice-assistant compatibility, boil-history analytics, and predictive descaling alerts convert once-passive appliances into data-rich touchpoints within broader home ecosystems. Brands collecting anonymized usage data refine firmware updates that optimize heating curves, creating feedback loops that legacy models cannot replicate. As mainstream ecosystems—from security to lighting—normalize device control via unified apps, a seamless kettle becomes an extension of the smart-home fabric rather than a novelty.
Expansion of Single-Person Households Driving Compact Models
Rising urban rents and delayed family formation keep average dwelling sizes in check, nudging consumers toward appliances that steward both space and power. Sub-1.0 L kettles appeal by reducing countertop footprint and avoiding energy waste from heating surplus water. Manufacturers answer with vertical or collapsible profiles that host double-layer walls for safe exterior touch, keeping thermal performance intact. Given demographic projections that favor one-person households in most OECD cities, this segment offers durable volume growth rather than a fad.
Restraints Impact Analysis*
| Restraint | (~) % Impact on CAGR Forecast | Geographic Relevance | Impact Timeline |
|---|---|---|---|
| Microwave ovens & instant boilers | -0.8% | Global, the strongest North America | Medium term (2-4 years) |
| Volatile stainless-steel prices | -0.5% | Global manufacturing hubs | Short term (≤ 2 years) |
| EU scrutiny on standby power | -0.3% | Europe, global echo | Long term (≥ 4 years) |
| Microplastic leaching in plastics | -0.4% | Health-aware developed markets | Medium term (2-4 years) |
| Source: Mordor Intelligence | |||
Microwave Ovens & Instant Boilers as Substitutes
High microwave penetration in the United States favors reheating water in multifunction devices, challenging dedicated kettles in convenience. Meanwhile, plumbed-in instant boilers in modern kitchens deliver water at drinkable temperatures without waiting. Kettle makers respond with rapid-boil elements that take 60–90 seconds for a mug and highlight flavor retention and lower standby power to reclaim the convenience narrative. Regional marketing stresses cultural rituals—such as tea brewing in the United Kingdom—to counter purely functional comparisons.
Volatile Stainless-Steel Prices
Stainless steel accounts for over half of the total bill-of-materials cost in many mid-range to premium units. Price volatility squeezes margins because promotional calendars are fixed months in advance, while alloy surcharges can swing week-to-week. Large brands hedge through long-term contracts and partial vertical integration, whereas smaller firms explore hybrid designs marrying steel interiors with heat-resistant glass exteriors to lower metal dependency. Material innovation becomes not just a sustainability imperative but also a buffer against commodity cycles.
*Our forecasts treat driver/restraint impacts as directional, not additive. The impact forecasts reflect baseline growth, mix effects, and variable interactions.
Segment Analysis
By Product Type: Smart Variants Drive Premium Evolution
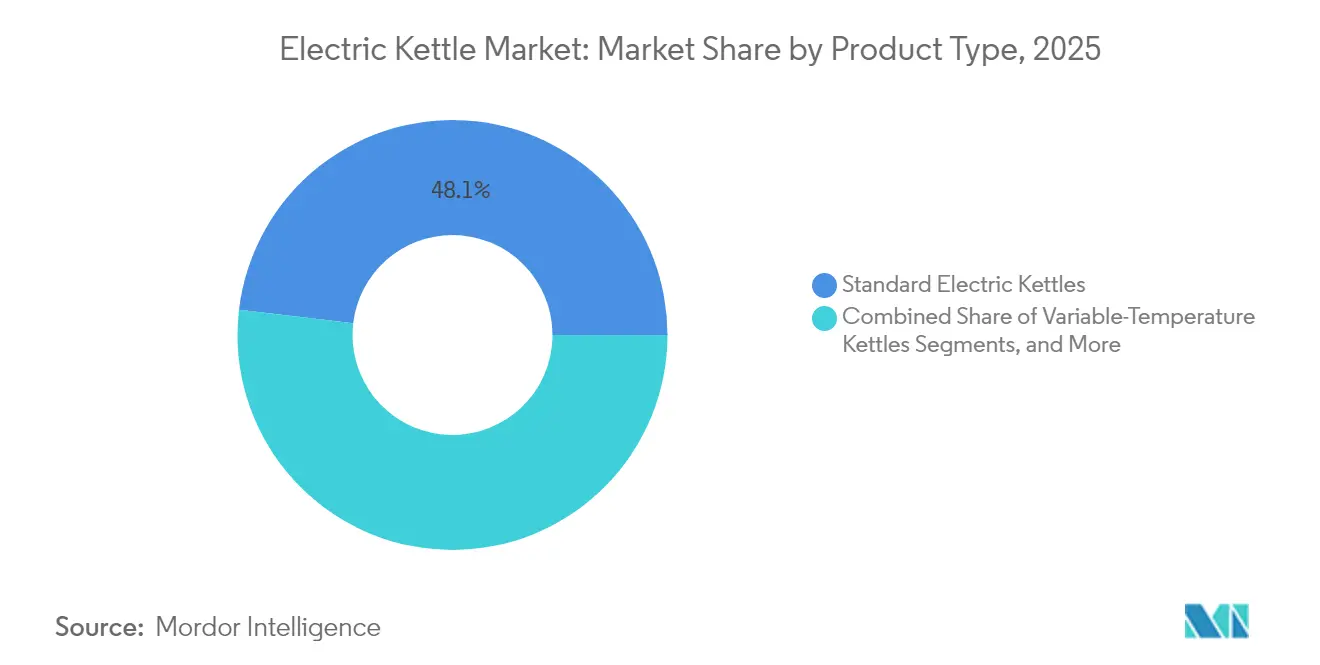
In 2025, Standard Electric Kettles contributed 48.12% of the total revenue, maintaining their dominance in the market. However, Smart kettles achieved a 9.86% CAGR outlook to 2031, even though standard units still own nearly half of the revenue. Their acceleration signals an inflection where embedded connectivity migrates from early adopters into the mass mid-tier. Variable-temperature models act as transitional products for customers focused on specialty beverages but not yet convinced by full IoT control. Rapid adoption of firmware-updatable bases and companion apps illustrates how software is displacing pure hardware as the seat of value. Premium positioning also shields brands from price wars that often characterize the legacy portion of the electric kettle market.
Consumer data underscore a bifurcation: one cohort seeks minimalistic boil-only units for price attractiveness, while another cohort embraces multi-sensor platforms that integrate scheduling, alt-mode energy savings, and child-lock features. As production costs fall, connected features will cascade downward, eventually becoming standard across nearly the entire electric kettle market.


By Material: Sustainability Reshapes Material Preferences
Stainless steel retained a 57.92% share in 2025 and is forecast to expand at 5.53% CAGR through 2031, underpinning the premium segment’s solidity. Recyclability and flavour neutrality reinforce its leadership despite higher material outlays. Glass occupies a visible but fragile niche, marketed for aesthetic transparency and chemical inertness, particularly among health-conscious buyers. Plastic is losing ground under micro-plastic scrutiny; however, it retains relevance in budget ranges where cost sensitivity exceeds environmental concern.
The Ecodesign for Sustainable Products Regulation spotlights end-of-life impacts, incentivizing manufacturers to switch to mono-material designs or easily separable assemblies. Groupe SEB’s commitment to 60% recycled content exemplifies how ESG metrics turn into procurement mandates . Brands experimenting with biopolymer handles and bamboo accents illustrate a search for lower-footprint alternatives without undermining thermal safety.
By Capacity: Compact Models Capture Urban Demographics
In 2025, the 1.0–1.5 L category dominated the market, contributing 64.02% of total revenue by effectively meeting family consumption needs while ensuring heating efficiency. The less than 1.0 L segment is anticipated to grow at a compound annual growth rate (CAGR) of 7.68%, driven by the increasing adoption of single-occupancy units and micro-apartments. Larger capacities, specifically those exceeding 2.0 L, are primarily utilized in institutional and office settings, where higher volume requirements take precedence over space constraints. This segmentation reflects diverse consumer preferences based on usage scenarios and capacity needs. The market dynamics highlight the importance of aligning product offerings with specific end-user demands.
Compact models are gaining traction due to their focus on energy efficiency, as they heat only the required amount of water, thereby reducing energy wastage. This feature resonates with cost-conscious households while supporting global sustainability goals. The category's compatibility with portable induction cookers and collapsible cookware further enhances its appeal, particularly among consumers prioritizing mobility. These models address the growing demand for versatile and space-saving solutions in modern households. The alignment with mobility trends underscores the strategic positioning of compact models in the market.
By End-User: Commercial Growth Outpaces Residential Volume
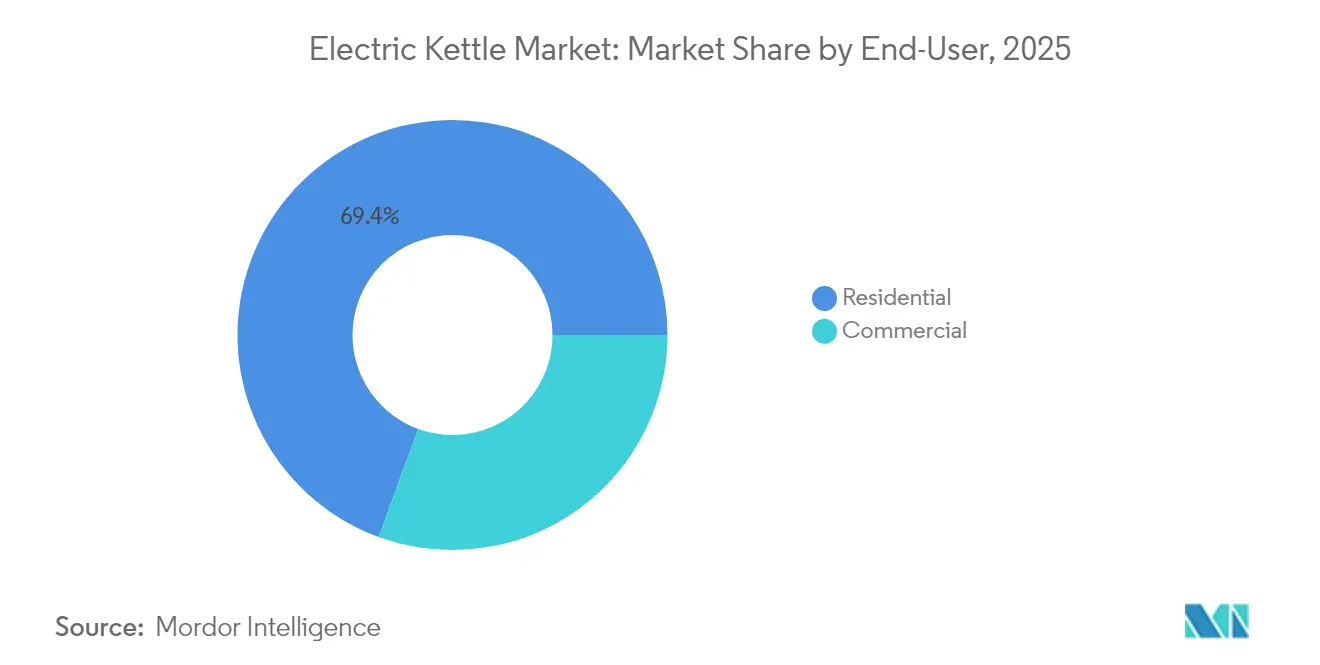
The residential segment commands 69.42% market share in 2025, reflecting the electric kettle's fundamental role as a household appliance where daily beverage preparation drives consistent replacement demand and feature upgrades. However, the commercial segment's 5.61% CAGR through 2031 significantly outpaces overall market growth, indicating a structural shift toward professional applications that demand higher performance specifications and premium pricing tolerance. Commercial users, encompassing Hotels, Restaurants, Cafes (HoReCa), corporate offices, and co-working spaces, prioritize durability, rapid heating cycles, and consistent performance over aesthetic considerations that influence residential purchases.
The commercial segment's growth acceleration stems from expanding foodservice industries, co-working space proliferation, and corporate wellness initiatives that emphasize quality beverage preparation as employee amenities. Corporate pantry installations and co-working space expansion create sustained demand as workplace culture evolves toward productivity enhancement through premium beverage access. The commercial segment's willingness to pay premium prices for reliability creates opportunities for manufacturers to develop specialized product lines with higher margins than residential models, while professional-grade features eventually cascade to consumer products through feature democratization.
By Distribution Channel: Digital Transformation Accelerates
In 2025, Supermarkets & Hypermarkets contributed 43.52% of the total revenue, maintaining their dominance in the market. However, online marketplaces demonstrated a robust growth trajectory with a CAGR of 11.12%, outperforming all other distribution channels. The popularity of flash-sale events has shortened product replacement cycles by encouraging spontaneous purchases. These events leverage consumer behavior by creating urgency through limited-edition offerings and exclusive colorways. This strategy has proven effective in driving sales and enhancing customer engagement.
Brands transitioning to a direct-to-consumer model are optimizing profit margins while gaining access to detailed consumer insights previously unavailable through traditional wholesale channels. This shift requires consistent pricing strategies across all platforms to mitigate potential channel conflicts. Virtual product demonstrations, facilitated through live streaming, are increasingly replicating the in-store experience. These digital interactions address the lack of tactile engagement inherent in online shopping. As a result, brands are enhancing customer experiences and fostering stronger connections with their target audience.
Geography Analysis
Europe contributes 33.84% of 2025 sales and combines high disposable incomes with regulatory pull. The region’s standby-power ceiling has raised the minimum engineering bar, creating exportable design templates for multinational brands. Premiumization accompanies growing attention to recyclability; many EU consumers now filter purchase choices through an environmental lens. Additionally, historically strong tea cultures across the United Kingdom, Ireland, and Germany buoy baseline kettle volumes even as alternative hot-water systems penetrate kitchens.
Asia-Pacific is projected to log a 9.12% CAGR by 2031, becoming the principal volume driver for the electric kettle market. China’s status as the world’s top appliance exporter, shipping 4.48 billion units in 2024, has created scale advantages across the supply chain . The region’s burgeoning middle class values both design and safety upgrades, catalyzing a shift from entry-level plastic units to stainless or glass mid-tier models. Manufacturing clusters in Guangdong and Zhejiang provinces shorten iteration cycles, enabling rapid accommodation of EU compliance tweaks.
North America records mature penetration but faces substitution pressure from microwave usage and integrated instant boilers. Nevertheless, the market remains attractive for premium brands that emphasize design language and IoT capabilities. Hamilton Beach’s USD 156.7 million Q3 2024 revenue showed category resilience when paired with margin-expanding product mixes . South America, the Middle East, and Africa trail in adoption but deliver pockets of high growth whenever GDP per-capita thresholds intersect with retail infrastructure expansion. Localization of color palettes and plug standards is central to winning early share in these emerging territories.
Regulatory Landscape
Safety and market-access compliance for electric kettles is anchored in updated international and national standards. IEC 60335-2-15:2024 sets particular requirements for appliances for heating liquids and supports certification and test planning across CB Scheme pathways. In the United States, UL 1082 was updated in July 2024, adding an Insertion/Withdrawal Test (Section 51A) that tightens mechanical-stress validation for electric kettles and adjacent liquid-heating appliances.
In Europe, Regulation (EU) 2024/1781, adopted June 2024, sets the Ecodesign for Sustainable Products framework that can introduce durability, repairability, and recyclability requirements for small appliances as implementing measures emerge. For energy-related performance, a 0.5-watt standby ceiling takes effect in May 2025, which pushes manufacturers toward improved controls, insulation, and low-power electronics for both standard and connected kettles.
Value Chain Analysis
The electric kettle value chain starts with raw-material and component sourcing (stainless steel, polypropylene and other plastics, copper and nickel for heating and wiring, and food-grade silicone seals), followed by sub-assembly of heating plates/elements, thermostats and sensors, and control boards. For smart or connected models, the chain adds certified WiFi/Bluetooth modules and ongoing firmware and app maintenance, shifting value from pure hardware to a mixed hardware-software bill of work. Strix Group's role in safety controls underscores the importance of specialized sub-components that gate compliance and reliability in regulated markets.
Manufacturing is concentrated in Asia-Pacific, particularly China, where clusters in Guangdong and Zhejiang enable tight integration across stamping and injection molding, heating-element assembly, and electronics integration. This supports both large-scale ODM and branded production, including Midea's large-scale unit capacity in the category. Finished goods flow mainly through ocean freight into Europe and North America, and importers manage lead-time and disruption risk with destination safety stock and vendor-managed inventory arrangements. Downstream, distribution continues shifting toward online marketplaces and brand direct-to-consumer programs alongside supermarkets and specialty retailers, with digital merchandising and flash-sale mechanics shaping product refresh cycles and SKU differentiation.
Competitive Landscape
The top five vendors collectively account for a substantial share of global revenue, resulting in a moderately fragmented market structure. Strix Group maintains dominance in the critical safety control sub-component segment, leveraging its strong presence in regulated markets to establish an oligopolistic position. This dominance creates a competitive layer beneath the finished goods market. Midea Group secures its position as the global leader in unit production, supported by an annual capacity of 100 million units. This capacity enables Midea to serve both its proprietary house brands and original design manufacturing (ODM) clients effectively.
Competitive strategies in the market are divided into two primary approaches. Large-scale players capitalize on their extensive manufacturing capabilities to target multiple price segments. In contrast, premium-focused companies prioritize high-quality materials, design aesthetics, and seamless ecosystem integration to differentiate themselves. Component innovation plays a pivotal role in driving competition, with features like low-noise induction coils and double-wall insulation increasingly incorporated into mid-range products. These advancements are partly driven by compliance with European acoustic comfort regulations. As IoT technology continues to evolve, data ownership is expected to become a critical competitive advantage, enabling companies to bundle consumables and subscription-based services around hot beverage consumption habits.
Electric Kettle Industry Leaders
Hamilton Beach Brands Holding Co.
Koninklijke Philips N.V.
Breville Pty Limited
Groupe SEB (Tefal & Krups)
Spectrum Brands Holdings (Russell Hobbs)
- *Disclaimer: Major Players sorted in no particular order

Market Opportunities and Future Outlook
The overlap of energy-performance, circularity, and connectivity requirements creates room for kettles designed as both low-standby appliances and grid-aware devices. In Europe, Regulation (EU) 2024/1781 translates into durability and repairability requirements for small appliances, which supports modular designs such as replaceable bases, separable assemblies, and longer-life heating systems. These design choices support compliance narratives and can also support premium positioning. The May 2025 0.5-watt standby ceiling referenced in the report context strengthens the business case for control-electronics redesign, improved insulation, and keep-warm optimization that reduces wasted consumption without undermining fast-boil performance.
Smart-home and energy-system interoperability is increasingly shaped by standards, creating space for connected kettles that integrate with broader platforms rather than proprietary ecosystems. IEC 63510-1:2025 and EN IEC 63510-3-1:2026 (SPINE/SPINE-IoT mapping) outline pathways for common data models for household appliance connectivity and energy-related communication. Matter 1.6 (June 2026) expands multi-ecosystem setup and device-capability communication across smart-home environments. In the United Kingdom, the Energy Smart Appliances Regulations 2026 and related public consultation activity point toward policy that rewards appliances capable of network communication for demand-side response, aligning with product roadmaps that combine variable-temperature precision, app-based scheduling, and energy-management integration for residential and workplace pantry use cases.
Recent Industry Developments
- May 2026: Hamilton Beach Brands Holding Company reported first-quarter 2026 results and reiterated its full-year 2026 guidance while outlining plans to reinvest performance into promotional programs across small electric household and specialty appliances. The approach emphasizes demand activation through retail and online promotion, which can influence category pricing and feature mix for countertop appliances such as electric kettles.
- February 2026: Breville Group provided an update on its manufacturing diversification, noting its 120-volt portfolio shift with non-China production targeted to represent about 80% of US gross profit dollars by the end of the first half of 2026. The move supports tariff and supply-chain risk mitigation, affecting sourcing footprints and lead-time planning for US-bound small kitchen appliances that include kettles.
- January 2025: Williams-Sonoma launched the Breville Brass Collection, extending Breville's premium small-appliance assortment through a major retail partner. Premium line extensions in curated retail environments reinforce design-led differentiation and can raise consumer willingness to pay for upgraded materials and features in adjacent countertop categories, including electric kettles.


Research Methodology Framework and Report Scope
Market Definition and Coverage
For this study, the market covers plug-in electric kettles that heat water for household and light commercial use, measured as sales value in USD across major regions and channels.
Scope exclusions: Stovetop kettles, built-in water boilers, and non-electric heating products are excluded from this market definition.
Segmentation Overview
- By Product Type
- Standard Electric Kettles
- Variable-Temperature Kettles
- Travel / Compact Kettles
- Smart / Connected Kettles
- By Material
- Stainless Steel
- Plastic
- Glass
- Mixed / Others
- By Capacity
- Less than 1.0 L
- 1.0 – 1.5 L
- 1.6 – 2.0 L
- Greater than 2.0 L
- By End-User
- Residential
- Commercial/HoReCa
- By Distribution Channel
- Supermarkets & Hypermarkets
- Specialty Electronic Retailers
- Online
- Other Distribution Channels
- By Geography
- North America
- United States
- Canada
- Mexico
- South America
- Brazil
- Peru
- Chile
- Argentina
- Rest of South America
- Europe
- United Kingdom
- Germany
- France
- Spain
- Italy
- BENELUX
- NORDICS
- Rest of Europe
- Asia-Pacific
- India
- China
- Japan
- Australia
- South Korea
- South-East Asia
- Rest of Asia-Pacific
- Middle East & Africa
- United Arab Emirates
- Saudi Arabia
- South Africa
- Nigeria
- Rest of Middle East & Africa
- North America
Data Sources, Market Sizing, and Validation
Desk Research
Desk work started with building a clean demand and supply map for electric kettles, then aligning it with how small kitchen appliances are tracked in public statistics. We used non-paywalled sources such as UN Comtrade trade flows, World Bank macro indicators, and national statistics offices for household spending and durable goods context, plus consumer product safety and energy-efficiency disclosures from agencies such as the US CPSC and the US DOE (and similar agencies in other regions).
To keep the model practical, we also reviewed importer and exporter documentation, association publications related to home appliances, and brand-owner public materials like annual reports and investor presentations to understand channel mix and product positioning. In parallel, a paid company financials and intelligence subscription and an import-export shipment-level database were used selectively to verify manufacturer footprints and cross-check trade directionality in key corridors. The desk sources mentioned here are not exhaustive, and many other public documents and articles were referred to for data collection, validation, and clarification.
Primary Interviews and Surveys
Primary work focused on filling gaps that desk sources do not explain well, such as how average selling prices shift by material and feature set, the online versus offline split, and how promotional intensity translates into unit demand. We spoke with manufacturers, distributors, and retail-side contacts across APAC, EMEA, and the Americas, so assumptions on volume, mix, and replacement cycles could be checked against what is actually seen in the market.
Distribution of primary research fieldwork respondents
| Company type | Respondent position | Region |
|---|---|---|
| Top tier: 36% | CXOs: 14% | APAC: 49% |
| Mid tier: 42% | Functional/Unit leaders: 38% | EMEA: 31% |
| Smaller Players: 22% | Managers: 48% | Americas: 20% |
Market-Sizing & Forecasting
Market sizing was built using a top-down approach where the demand pool is reconstructed from small appliance consumption signals, trade inflows for relevant product categories, and the expected share attributable to electric kettles in each major region. These totals are then stress-tested with selective bottom-up checks, such as sampled price points across online and offline channels and a manufacturer-level sense check on shipment capacity and regional reach.
Key inputs used in the model include household formation and urbanization, appliance replacement cycles, e-commerce penetration for small appliances, pricing and mix shifts between plastic, glass, and stainless models, and the adoption rate of feature-led products like temperature control and smart connectivity. When a bottom-up view is incomplete for smaller countries, gaps are handled through proxy markets with similar income bands and retail structures, and then adjusted using trade intensity and channel mix.
Forecasts lean on scenario analysis supported by short time-series smoothing, since demand is sensitive to macro pressure, promotional cycles, and mix-driven ASP changes. Assumptions are tuned using primary feedback on expected price progression, feature uptake, and channel expansion, and then applied consistently across the forecast period.
Data Validation & Update Cycle
Validation is done through triangulation across independent signals, including trade direction checks, macro affordability indicators, and price sanity checks against channel observations. If a country-level output looks unusual, the drivers are reviewed one by one, and contacts are re-engaged when the variance cannot be explained by mix, currency, or timing.
Before sign-off, the model and assumptions pass through multiple analyst reviews so calculation errors and scope drift are caught early. Reports are refreshed annually, and interim updates are triggered when there are material events such as major regulatory shifts, sharp currency moves, or large channel disruptions. Right before delivery, an analyst runs a fresh pass so clients receive the latest updated view.
Mordor Intelligence's Electric Kettle Market Size Versus Other Published Estimates
Published market sizes for electric kettles can look far apart even when the topic sounds the same, because the counting rules behind the numbers are often not the same. Differences usually come from what products get included, how pricing is averaged across channels, and which year is treated as the anchor for currency and inflation effects.
In this study, the key gap drivers are mainly scope boundaries (plug-in countertop electric kettles versus broader hot-water or kitchen appliance groupings), plus how ASP is handled when feature mix changes quickly in online channels. Timing also matters, since some estimates use a longer forecast window or embed more aggressive adoption of premium models without running enough checks against trade and channel signals.
Benchmark comparison
| Source | Market Size | Gaps in Research Methodology |
|---|---|---|
| Mordor Intelligence | USD 1.99 B (2026) | |
| Global Consultancy A | USD 2.00 B (2025) | Uses an earlier base year and a broader segmentation lens that can blend in adjacent small appliance demand, and it can also be more sensitive to how online premium pricing is averaged across regions. |
| Industry Publisher B | USD 5.20 B (2025) | Appears to apply a wider definition that can pull in hot-water products beyond plug-in countertop kettles, and the longer horizon can compound ASP growth assumptions without enough external checks against trade intensity. |
The table shows that the biggest spread comes from category boundaries and price building blocks rather than from one simple math difference. By tracking channel-level ASPs and mix shifts, and then checking scope gates for plug-in countertop units only, Mordor Intelligence keeps the total tied to a repeatable demand pool that can be re-tested as new product features and sales channels evolve.


Key Questions Answered in the Report
What is the current size of the electric kettle market in 2026?
The market is valued at USD 1.99 billion in 2026 and is projected to reach USD 2.59 billion by 2031.
Which region holds the largest share of electric kettle revenue?
Europe leads with 33.84% of global revenue in 2025, supported by strict energy-efficiency regulations and premium product adoption.
Which product segment is growing fastest?
Smart or IoT-enabled kettles are expanding at a 9.86% CAGR through 2031 thanks to connectivity features that integrate with wider smart-home ecosystems.
How do energy-efficiency rules affect kettle design?
The EU’s 0.5-watt standby limit requires advanced insulation, sensor shutdown circuits, and firmware optimizations, pushing brands to rethink core architectures.
Why are compact kettles gaining popularity?
Rising single-person households and shrinking urban living spaces drive demand for less than 1.0 L models that conserve both countertop area and energy.
What competitive factor most shapes future market share?
Integration of IoT functions that deliver usage analytics and remote control is expected to become a decisive differentiator as connectivity costs decline.
Page last updated on:


 Your data is secure and never sold or shared.


