| Study Period | 2017 - 2029 |
| Base Year For Estimation | 2024 |
| Forecast Data Period | 2025 - 2029 |
| Market Size (2025) | USD 5.99 Billion |
| Market Size (2029) | USD 8.19 Billion |
| CAGR (2025 - 2029) | 8.15 % |
| Market Concentration | High |
Major Players*Disclaimer: Major Players sorted in no particular order |

Electric Bus Battery Pack Market Analysis
The Electric Bus Battery Pack Market size is estimated at 5.99 billion USD in 2025, and is expected to reach 8.19 billion USD by 2029, growing at a CAGR of 8.15% during the forecast period (2025-2029).
The global electric bus battery pack industry is experiencing transformative growth driven by increasing environmental consciousness and stringent emission regulations worldwide. Battery manufacturers are rapidly scaling up their production capabilities to meet the surging demand for electric buses across public transportation networks. The industry is witnessing significant technological advancements in battery chemistry and energy density improvements, leading to enhanced performance and reliability. These developments are crucial as transit authorities worldwide increasingly transition their fleets to zero-emission vehicles, requiring robust and efficient electric bus components.
The market landscape is characterized by strategic investments in manufacturing infrastructure and research and development initiatives. A notable example is Lion Electric's inauguration of a new manufacturing facility in April 2023, dedicated to producing batteries for medium and heavy-duty vehicles, including buses, with a targeted production capacity of 1.7 GWh by the end of 2023. This trend of expanding production capabilities is being mirrored by other manufacturers globally, indicating strong industry confidence in sustained market growth. The focus on developing advanced battery technologies has resulted in improved energy density, faster charging capabilities, and extended battery life cycles.
The industry is witnessing a remarkable surge in adoption rates, particularly in developed markets where environmental regulations are most stringent. The United States, for instance, recorded a significant 66% increase in transit electric bus sales in 2022 compared to the previous year, highlighting the accelerating transition to electric public transportation. This growth is supported by ambitious zero-emission targets set by various states and municipalities, driving the implementation of electric bus fleets across urban areas. The global demand for EV bus battery solutions demonstrated strong momentum, with a 15% increase in 2022 compared to 2021.
The market is experiencing a shift in battery technology preferences, with manufacturers focusing on developing more efficient and sustainable battery solutions. Original Equipment Manufacturers (OEMs) are investing heavily in research and development to create new and advanced technologies that offer superior performance and efficiency. This includes innovations in battery chemistry, thermal management systems, and battery management systems. The industry is also seeing increased collaboration between battery manufacturers, bus manufacturers, and technology providers to develop integrated solutions that optimize battery performance and longevity while reducing total ownership costs. The trend towards bus electrification is further accelerated by these collaborative efforts.
Electric Bus Battery Pack Market Trends
BYD AND TESLA ARE LEADING THE CHARGE IN THE EV MARKET AND SHAPING THE FUTURE
- In 2022, BYD was the market leader in electric vehicle sales and held a share of 13.3%. BYD's leading position can be attributed to several factors. It has been an early and prominent player in the EV industry, with a strong focus on producing electric vehicles and related technologies. The company's early entry into the market allowed it to establish a solid foundation and gain recognition among consumers. BYD has also been actively expanding its operations globally, forging partnerships, and investing in research and development, all of which contribute to its leading position.
- Tesla has been at the forefront of electric vehicle innovation and has played a crucial role in popularizing EVs worldwide. Tesla was a significant player in the EV industry in 2022, with a market share of 12.2%. Tesla's strong brand image, cutting-edge technology, and extensive Supercharger network have contributed to its success.
- Among the other players in the EV market, there are several notable companies that hold significant market shares. BMW's established reputation in the automotive industry, coupled with its commitment to electric mobility through its "BMW i" sub-brand, has contributed to its market presence. Similarly, Volkswagen, which held a market share of 3.9% in 2022, has been actively investing in electric mobility under its "Volkswagen Group" umbrella. These companies, along with others like Mercedes-Benz, Kia, and Hyundai, are recolonizing the EV industry by leveraging their existing brand recognition, introducing compelling electric vehicle models, and investing in technology to enhance the range and performance of their electric offerings.

Understand The Key Trends Shaping This Market
Download PDF
TESLA AND BYD DOMINATED THE BEST-SELLING EV MODELS OF 2022
- The best-selling EV models in 2022 were dominated by two key OEMs: Tesla and BYD. Tesla held a strong market position with two of its models, the Model Y and Model 3, capturing the first and third spots, respectively. The Tesla Model Y was the most popular plug-in electric vehicle, with global unit sales of roughly 771,300 in 2022. That year, deliveries of Tesla's Model 3 and Model Y surpassed 1.2 million, a Y-o-Y increase of 36.77% for Tesla's best-selling models. While two of the five best-selling plug-in electric vehicle (PEV) models were Tesla-branded, the battery electric vehicle manufacturer faced competition from Asian brands in 2022. China-based BYD overtook Tesla as the best-selling PEV brand in 2022, relying on a large offering of plug-in hybrid electric models. Following closely behind the Tesla Model Y, the BYD Song Plus (BEV + PHEV) secured the second spot, with sales reaching 477,090 units. BYD's established presence in the Chinese market, along with its reputation for producing reliable and technologically advanced electric vehicles, likely contributed to the strong sales performance of the Song Plus models.
- The Volkswagen ID.4 stood out among the best-selling EV models as the only European PEV (Plug-in Electric Vehicle) in the top ten. With a sales volume of 174,090 units in 2022, the ID.4 demonstrated Volkswagen's commitment to electric mobility and its growing presence in the EV market.
- Overall, these top-performing EV models from Tesla and BYD, along with other notable contenders like the Wuling Hong Guang MINI EV and Volkswagen ID.4, demonstrate the increasing consumer demand for electric vehicles.

OTHER KEY INDUSTRY TRENDS COVERED IN THE REPORT
- INCREASING GLOBAL DEMAND AND GOVERNMENT SUPPORT PROPELLING ELECTRIC VEHICLE MARKET GROWTH
- EV BATTERY PACK PRICES DECLINED DUE TO ECONOMIES OF SCALE AND TECHNOLOGICAL ADVANCEMENTS, BUT FACED A TEMPORARY INCREASE IN 2022
- THE DECREASING COST OF BATTERIES IS A MAJOR FACTOR IN THE EXPANDING AND MORE ACCESSIBLE GLOBAL EV MARKET
- AUTOMAKERS LAUNCHED NEW ELECTRIC VEHICLE MODELS TO MEET THE INCREASING DEMAND, BOOSTING BATTERY PACK DEMAND WORLDWIDE
- LFP, NMC, NCA, AND NCM BATTERIES ARE LEADING THE WAY, WITH DIFFERENT GEOGRAPHIES SHOWING A PREFERENCE FOR SPECIFIC CHEMISTRIES
- INCREASING GLOBAL DEMAND FOR ELECTRIC VEHICLE BATTERIES AND MATERIALS DRIVEN BY INCREASING ELECTRIFICATION OF VEHICLES, WITH LFP BATTERIES LEADING THE TREND
- INCREASING GLOBAL DEMAND AND TECHNOLOGICAL ADVANCEMENTS DRIVE THE ELECTRIC VEHICLE MARKET AND BATTERY INDUSTRY
Segment Analysis: Propulsion Type
BEV Segment in Electric Bus Battery Pack Market
Battery Electric Vehicles (BEV) dominate the electric bus battery pack market, commanding approximately 99% market share in 2024. This overwhelming dominance can be attributed to several factors, including zero-emission capabilities, lower operational costs, and superior environmental performance compared to other propulsion types. The segment's growth is further bolstered by stringent government regulations promoting zero-emission vehicles, particularly in regions like China, Europe, and North America. Major cities worldwide are increasingly transitioning their public transportation fleets to pure electric buses, driving substantial demand for BEV battery packs. The segment's growth is also supported by continuous improvements in battery technology, leading to enhanced range capabilities and reduced charging times, making BEVs increasingly attractive for public transport operators.
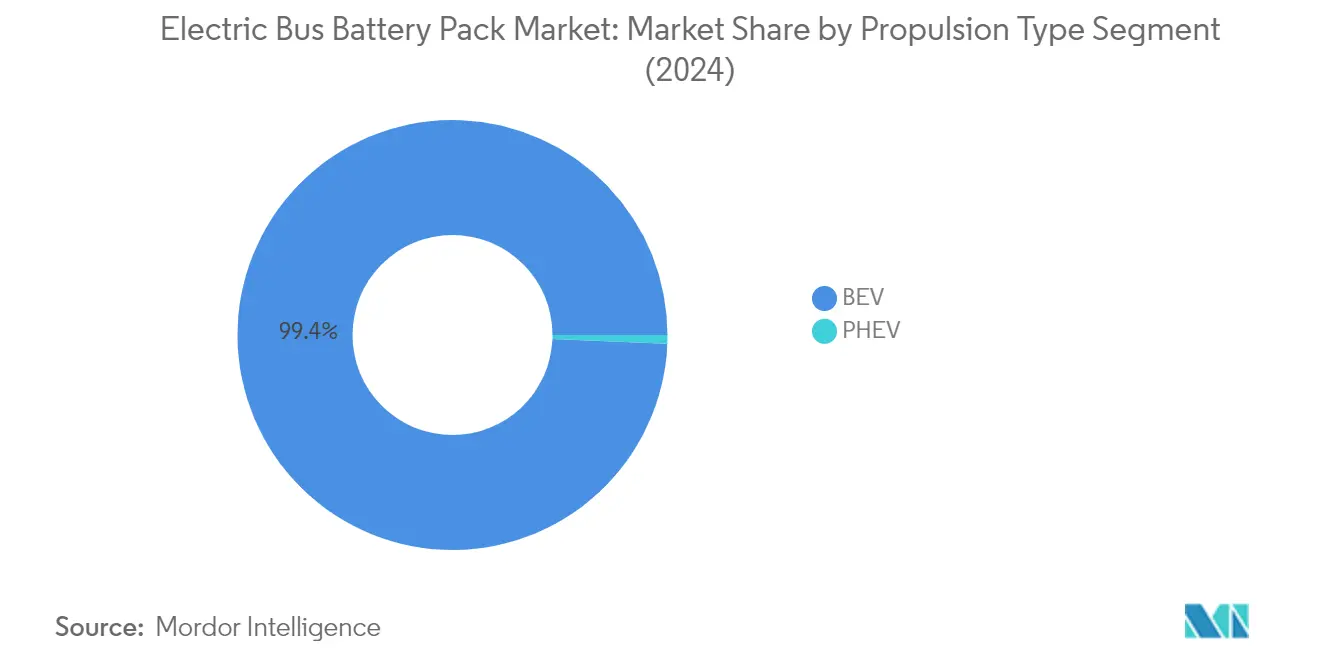
PHEV Segment in Electric Bus Battery Pack Market
The Plug-in Hybrid Electric Vehicle (PHEV) segment represents a smaller but strategic portion of the electric bus battery pack market. PHEVs offer a transitional solution for operators looking to gradually shift from conventional buses to fully electric vehicles, providing the flexibility of both electric and conventional propulsion systems. The segment benefits from increasing adoption in regions where charging infrastructure is still developing or where route characteristics demand extended range capabilities. Despite their dual powertrain advantage, PHEVs face growing competition from pure electric buses as battery technology advances and charging infrastructure expands. The segment continues to serve specific market niches, particularly in regions with challenging topography or climate conditions where the backup conventional powertrain provides additional operational security.
Segment Analysis: Battery Chemistry
LFP Segment in Electric Bus Battery Pack Market
Lithium Iron Phosphate (LFP) batteries have emerged as the dominant chemistry in the electric bus battery pack market, commanding approximately 79% market share in 2024. This overwhelming preference for LFP batteries can be attributed to several key advantages, including lower production costs, enhanced safety features, and superior thermal stability compared to other chemistries. The segment's dominance is particularly strong in the Asia-Pacific region, where major manufacturers have invested heavily in LFP battery production capabilities. The technology's proven track record in terms of cycle life and reliability has made it the preferred choice for electric bus manufacturers and operators worldwide, especially in applications requiring frequent charging cycles and long operational hours.
NMC Segment in Electric Bus Battery Pack Market
The Nickel Manganese Cobalt (NMC) battery segment is experiencing remarkable growth in the electric bus battery pack market, with projections indicating a robust expansion of approximately 50% between 2024 and 2029. This accelerated growth is driven by the chemistry's superior energy density characteristics and improving cost economics. Manufacturers are increasingly investing in research and development to enhance NMC battery performance, particularly in areas of fast charging capabilities and thermal management. The segment's growth is further supported by increasing adoption in regions with extreme weather conditions, where the chemistry's performance advantages become more pronounced.
Remaining Segments in Battery Chemistry
The other battery chemistries in the market, including NCA (Nickel Cobalt Aluminum) and other emerging technologies, continue to play important roles in specific applications and markets. NCA batteries are particularly valued in applications requiring high energy density and extended range capabilities, while newer chemistries are being developed to address specific performance requirements and cost considerations. These segments are seeing continued innovation and development, particularly in areas of safety enhancement and performance optimization. The diversity of battery chemistries available allows manufacturers to select the most appropriate technology based on specific operational requirements, climate conditions, and cost considerations.
Segment Analysis: Capacity
Less than 15 kWh Segment in Electric Bus Battery Pack Market
The Less than 15 kWh segment has emerged as the dominant force in the global electric bus battery pack market, commanding approximately 32% market share in 2024. This segment's leadership position is driven by several factors including its cost-effectiveness, suitability for short-range urban transit operations, and growing adoption in developing markets. The segment is also experiencing the fastest growth trajectory, supported by increasing demand from municipalities and transport operators looking to electrify their short-route bus fleets. The rising focus on urban mobility solutions, coupled with government initiatives promoting zero-emission public transportation, has created a strong foundation for this segment's growth. Additionally, advancements in battery technology have improved the efficiency and performance of these lower capacity battery packs, making them an attractive option for operators focused on optimizing costs while maintaining operational effectiveness. The segment's success is further bolstered by the expanding infrastructure for frequent charging stops in urban areas, which makes lower capacity batteries more practical for city operations.
Remaining Segments in Capacity
The other capacity segments including 15-40 kWh, 40-80 kWh, and Above 80 kWh each serve distinct operational requirements in the electric bus market. The 15-40 kWh segment caters to medium-range urban transit operations, offering a balance between range and cost considerations. The 40-80 kWh segment typically serves intercity routes and high-frequency urban corridors where longer operating ranges are required. The Above 80 kWh segment addresses the needs of long-distance routes and heavy-duty applications, providing extended range capabilities for interstate and tourism operations. These segments complement each other by addressing diverse operational requirements across different types of bus services, from urban transit to long-distance travel. The choice of battery capacity is influenced by factors such as route length, operating conditions, charging infrastructure availability, and specific regional requirements, making each segment vital for different use cases in the electric bus ecosystem.
Segment Analysis: Battery Form
Segment Analysis: Method
Laser Segment in Electric Bus Battery Pack Market
The laser method has emerged as the dominant technology in the electric bus battery pack market, commanding approximately 78% of the total market share in 2024. This method has gained significant traction due to its superior advantages including high-quality connections, improved joint strength, reduced resistance, and enhanced thermal management capabilities. The segment is also experiencing the fastest growth trajectory, driven by increasing adoption of laser welding in high-power battery pack applications where precise control over weld parameters and consistent connections are crucial. The technology enables robust and reliable connections between battery cells, ensuring optimal performance and safety in electric bus operations. Manufacturers are increasingly preferring laser welding for its ability to provide consistent quality in high-volume production environments. The growing emphasis on battery safety and performance reliability in electric buses has further accelerated the adoption of laser welding technology, making it the preferred choice for battery pack manufacturing.
Wire Method in Electric Bus Battery Pack Market
The wire method represents a traditional yet reliable approach in the electric bus battery pack market, offering distinct advantages such as low manufacturing costs, reliable connections, and adaptability for various wire types. This method continues to maintain its relevance in the industry due to its proven track record and established manufacturing processes. Wire bonding technology demonstrates particular strength in low to medium-power applications, where its cost-effectiveness and simplicity make it an attractive option for manufacturers. The method's ability to work with non-perfect surfaces and its long runtime capabilities for high-current batteries used in heavy vehicles like electric buses contribute to its continued utilization. Manufacturers appreciate the wire method's flexibility in accommodating different connection requirements and its established quality control procedures. The technology's mature status in the industry, combined with its well-understood maintenance requirements and operator familiarity, ensures its ongoing role in electric bus battery pack manufacturing.
Segment Analysis: Component
Cathode Segment in Electric Bus Battery Pack Market
The cathode segment has emerged as the dominant component in the electric bus battery pack market, commanding approximately 57% market share in 2024. This substantial market position can be attributed to cathodes being one of the key components regulating battery performance, range, and thermal safety. The segment's growth is being driven by increasing investments in cathode material production facilities worldwide, with several manufacturers enhancing their usage to meet the rising demand for electric bus batteries. The cathode accounts for around 52% of the total battery cost, making it the most valuable component in terms of material costs. Major battery manufacturers are focusing on developing advanced cathode materials to improve energy density and overall battery performance, while also working on cost optimization strategies to make electric bus batteries more commercially viable.
Anode Segment in Electric Bus Battery Pack Market
The anode segment is demonstrating remarkable growth potential in the electric bus battery pack market, with projections indicating a strong growth trajectory from 2024 to 2029. This growth is being fueled by technological advancements in anode materials, particularly in the development of silicon and graphite-based solutions that offer improved energy density and charging capabilities. The segment is benefiting from extensive research and development activities focused on enhancing anode performance characteristics such as faster charging times, increased energy storage capacity, and improved cycle life. Manufacturers are investing in new production facilities and expanding their existing capabilities to meet the growing demand for high-performance anode materials. The increasing focus on developing sustainable and cost-effective anode materials is expected to further drive innovation in this segment.
Remaining Segments in Component
The electrolyte and separator segments play crucial supporting roles in the electric bus battery pack market. The electrolyte segment is essential for ion transport between electrodes and significantly influences battery performance and safety characteristics. Manufacturers are focusing on developing advanced electrolyte formulations that can enhance battery life and safety while improving overall performance. The separator segment, while smaller in market size, is critical for battery safety and performance, serving as an insulator between the positive and negative electrodes while allowing ion transport. Both segments are witnessing continuous technological improvements and innovations, particularly in terms of material development and manufacturing processes, contributing to the overall advancement of electric bus battery technology.
Segment Analysis: Material Type
Natural Graphite Segment in Electric Bus Battery Pack Market
Natural graphite has emerged as the dominant material segment in the electric bus battery pack market, driven by its superior properties and cost-effectiveness for anode materials. The material's high energy density, excellent conductivity, and structural stability make it an ideal choice for battery manufacturers. In 2024, natural graphite is expected to account for approximately 30% of the total material consumption in electric bus battery packs, highlighting its crucial role in the industry. The growing emphasis on sustainable and efficient battery production has further cemented natural graphite's position as a key material. Major battery manufacturers are increasingly focusing on securing stable supplies of high-quality natural graphite to meet the rising demand from the electric bus sector. The material's abundance and relatively lower processing costs compared to synthetic alternatives have made it particularly attractive for large-scale battery production.
Manganese Segment in Electric Bus Battery Pack Market
The manganese segment is projected to exhibit the strongest growth trajectory in the electric bus battery pack market from 2024 to 2029. This remarkable growth is primarily attributed to manganese's essential role in improving battery performance and stability, particularly in NMC (Nickel Manganese Cobalt) batteries. The material's ability to enhance energy density while maintaining thermal stability has made it increasingly valuable for next-generation battery technologies. Battery manufacturers are actively incorporating higher proportions of manganese in their cathode formulations to optimize cost-performance ratios. The development of advanced manganese-rich cathode materials is expected to further drive the segment's growth. Additionally, ongoing research and development efforts focused on manganese-based battery chemistries are likely to unlock new applications and improvements in battery performance, contributing to the segment's expansion.
Remaining Segments in Material Type
The other material segments, including cobalt, lithium, nickel, and other materials, each play vital roles in the electric bus battery pack market. Cobalt remains crucial for providing stability and high energy density in battery cathodes, though manufacturers are working to reduce its content due to cost and supply chain considerations. Lithium continues to be fundamental as the primary charge carrier in all lithium-ion batteries, with ongoing efforts to secure sustainable sources. Nickel is gaining importance in high-energy density applications, particularly in newer battery chemistries aimed at extending range capabilities. The other materials category, encompassing various additives, binders, and processing materials, contributes to overall battery performance and manufacturing efficiency. Each of these materials brings unique properties and advantages to battery production, collectively supporting the advancement of electric bus battery technology.
Electric Bus Battery Pack Market Geography Segment Analysis
Electric Bus Battery Pack Market in Asia-Pacific
The Asia-Pacific region maintains a dominant position in the global electric bus battery pack market, driven by robust government initiatives and increasing environmental awareness. Countries like China, India, Japan, South Korea, and Thailand are making significant strides in electric bus adoption, supported by favorable policies and investments in charging infrastructure. The region benefits from the presence of major battery manufacturers and a well-established supply chain network, enabling efficient production and distribution of battery packs for electric buses. Local governments across these countries are implementing various incentives and subsidies to encourage the transition to electric public transportation, while also investing in research and development to enhance battery technology and performance.
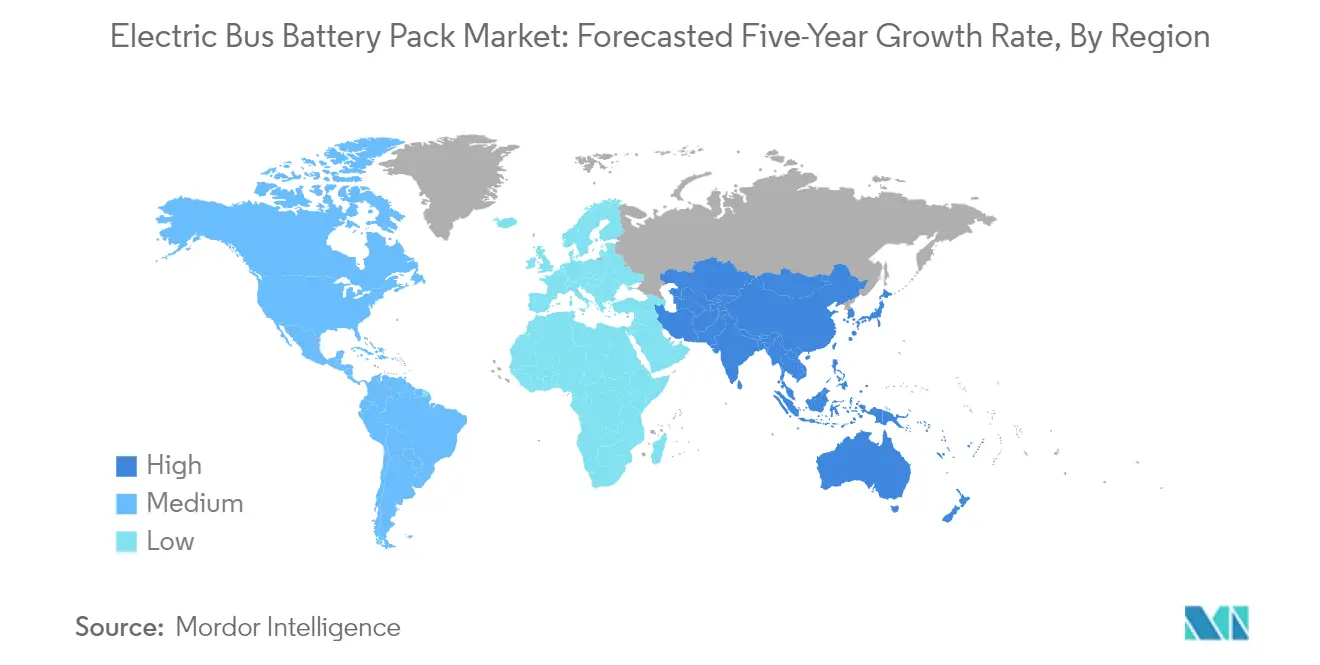
Electric Bus Battery Pack Market in China
China stands as the powerhouse of the Asia-Pacific electric bus battery pack market, leveraging its advanced manufacturing capabilities and strong government support. With approximately 70% market share in 2024, China dominates the regional landscape through its comprehensive ecosystem of battery manufacturers, electric bus producers, and extensive charging infrastructure. The country's success is built on a foundation of strategic policies promoting electric vehicle adoption, significant investments in research and development, and the presence of leading battery manufacturers. Chinese cities are increasingly transitioning their public transportation fleets to electric buses, supported by government subsidies and environmental regulations. The nation's commitment to reducing urban pollution and achieving carbon neutrality goals continues to drive the expansion of electric bus deployment across major metropolitan areas.
Electric Bus Battery Pack Market in South Korea
South Korea emerges as the fastest-growing market in the Asia-Pacific region, with a projected growth rate of approximately 53% from 2024 to 2029. The country's rapid advancement in the electric bus battery pack sector is driven by its strong technological expertise and innovative approach to battery development. South Korean manufacturers are investing heavily in research and development to enhance battery performance and efficiency, while also focusing on reducing production costs. The government's commitment to sustainable transportation is evident through its comprehensive support for electric bus adoption, including financial incentives and infrastructure development. Local authorities are actively promoting the electrification of public transportation fleets, while domestic battery manufacturers are expanding their production capabilities to meet the growing demand.
Electric Bus Battery Pack Market in Europe
Europe demonstrates a strong commitment to sustainable transportation through its progressive adoption of electric bus technology. The region's market is characterized by a diverse landscape of countries including Germany, France, the UK, Italy, Poland, Hungary, and Sweden, each contributing to the growth of the electric bus battery pack sector. European nations are implementing stringent emission regulations and providing substantial incentives to accelerate the transition to electric public transportation. The region benefits from a robust charging infrastructure network and significant investments in battery technology research and development. Collaboration between automotive manufacturers, battery producers, and public transportation authorities is fostering innovation and driving market expansion across the continent.
Electric Bus Battery Pack Market in Germany
Germany leads the European electric bus battery pack market, commanding approximately 25% of the regional market share in 2024. The country's leadership position is supported by its strong automotive manufacturing heritage and commitment to sustainable transportation solutions. German cities are at the forefront of electric bus adoption, implementing comprehensive electrification strategies for their public transportation networks. The nation's robust charging infrastructure, combined with significant government support through subsidies and incentives, creates a favorable environment for market growth. Local manufacturers and research institutions continue to drive innovation in battery technology, focusing on improving energy density, charging speeds, and overall performance.
Electric Bus Battery Pack Market in UK
The United Kingdom demonstrates remarkable growth potential in the electric bus battery pack market, with a projected growth rate of approximately 30% from 2024 to 2029. The country's ambitious climate goals and commitment to zero-emission public transportation are driving rapid market expansion. British cities are increasingly transitioning their bus fleets to electric alternatives, supported by government funding and local initiatives. The UK's focus on developing advanced battery technology and manufacturing capabilities is strengthening its position in the market. Collaboration between public transport authorities, manufacturers, and research institutions is fostering innovation and accelerating the adoption of electric buses across the nation.
Electric Bus Battery Pack Market in Middle East & Africa
The Middle East & Africa region is witnessing an emerging trend in electric bus battery pack adoption, driven by increasing awareness of sustainable transportation solutions and government initiatives to reduce carbon emissions. While the market is still in its early stages, several countries are showing interest in electrifying their public transportation systems. The region's focus on developing smart cities and sustainable infrastructure is creating opportunities for electric bus deployment. Growing urbanization and the need for efficient public transportation systems are driving the adoption of electric buses, particularly in major metropolitan areas. The market is expected to see significant growth as countries invest in charging infrastructure and implement supportive policies for electric vehicle adoption.
Electric Bus Battery Pack Market in North America
North America demonstrates a strong commitment to electric bus adoption, driven by environmental regulations and sustainable transportation initiatives. The United States and Canada are making significant investments in electrifying their public transportation systems, supported by federal and state-level incentives. The region benefits from advanced charging infrastructure and growing domestic battery manufacturing capabilities. Collaboration between transit authorities, manufacturers, and technology providers is accelerating market development and innovation in EV bus battery technology.
Electric Bus Battery Pack Market in United States
The United States dominates the North American market, with approximately 65% market share in 2024. The country's leadership is driven by comprehensive federal and state-level support for electric bus adoption, including substantial funding programs and incentives. American cities are increasingly transitioning their public transportation fleets to electric alternatives, supported by robust charging infrastructure development. The nation's focus on domestic battery manufacturing and technology development is strengthening its market position. Transit authorities across the country are implementing ambitious bus electrification plans, while manufacturers are expanding their production capabilities to meet growing demand.
Electric Bus Battery Pack Market in United States - Growth Analysis
The United States also emerges as the fastest-growing market in North America, with a projected growth rate of approximately 56% from 2024 to 2029. This exceptional growth is driven by increasing environmental awareness and substantial government support for clean transportation initiatives. The country's robust research and development ecosystem is fostering innovation in EV bus battery technology and manufacturing processes. State and local governments are implementing progressive policies to accelerate the adoption of electric buses, while transit agencies are setting ambitious goals for fleet electrification. The expansion of charging infrastructure and improvements in battery technology are further supporting market growth.
Electric Bus Battery Pack Market in South America
South America is experiencing growing momentum in the electric bus battery pack market, driven by increasing urbanization and the need for sustainable public transportation solutions. The region is witnessing a gradual transition towards electric buses, particularly in major metropolitan areas. Government initiatives to reduce urban pollution and improve public transportation efficiency are supporting market growth. The development of charging infrastructure and implementation of supportive policies are creating opportunities for market expansion. While the market is still developing, increasing awareness of environmental benefits and the potential for cost savings in the long term are driving interest in electric bus adoption across the region. Additionally, the electric bus battery price is becoming more competitive, further encouraging adoption.
Get Analysis on Important Geographic Markets
Download PDF
Electric Bus Battery Pack Industry Overview
Top Companies in Electric Bus Battery Pack Market
The electric bus battery pack market is characterized by intense competition among established players who are actively pursuing innovation and expansion strategies. Companies are investing heavily in research and development to enhance battery performance, focusing on improving energy density, charging speeds, and overall efficiency while reducing costs. Strategic partnerships with automotive manufacturers and public transit authorities have become increasingly common, allowing companies to secure long-term supply contracts and expand their market presence. Manufacturers are also emphasizing the development of sustainable and environmentally friendly battery solutions, including advanced recycling programs and the use of renewable materials. Operational agility is demonstrated through flexible manufacturing capabilities and localized production facilities, enabling companies to respond quickly to regional demand fluctuations and specific customer requirements. Geographic expansion, particularly into emerging markets, remains a key focus area with companies establishing new production facilities and technical centers across multiple regions.
Market Dominated by Asian Manufacturing Giants
The electric bus battery pack market exhibits a relatively concentrated structure dominated by large Asian manufacturers, particularly from China, Japan, and South Korea. These established players leverage their extensive manufacturing capabilities, technological expertise, and strong supply chain networks to maintain their market positions. The market is characterized by the presence of both specialized battery manufacturers and diversified conglomerates that have integrated battery production into their broader automotive and energy storage portfolios. While local players maintain strong positions in their respective regional markets, global leaders are increasingly expanding their presence through strategic partnerships and manufacturing facilities in key growth regions.
The industry has witnessed significant consolidation through strategic mergers and acquisitions, as companies seek to enhance their technological capabilities and expand their geographic footprint. Vertical integration has become increasingly common, with manufacturers acquiring or partnering with raw material suppliers to secure critical components and reduce supply chain vulnerabilities. Joint ventures between established battery manufacturers and automotive companies have emerged as a prominent trend, facilitating knowledge sharing and ensuring stable demand for battery products. This consolidation trend is expected to continue as companies seek economies of scale and attempt to strengthen their competitive positions in the rapidly evolving market.
Innovation and Sustainability Drive Future Success
Success in the electric bus battery pack market increasingly depends on companies' ability to balance technological innovation with cost competitiveness while meeting stringent safety and environmental standards. Incumbent manufacturers must focus on continuous improvement in battery performance metrics while simultaneously reducing production costs through automation and economies of scale. Establishing strong relationships with public transit authorities and fleet operators has become crucial, as these end-users often make large-scale, long-term procurement decisions. Companies must also invest in robust after-sales service networks and battery management systems to provide comprehensive support throughout the product lifecycle.
For new entrants and challenger companies, differentiation through specialized technology or unique service offerings presents a viable path to market share growth. This could include developing advanced battery chemistries, innovative thermal management systems, or superior battery management software. Building strategic partnerships with local transit authorities and leveraging government support programs can help establish initial market presence. Companies must also prepare for evolving regulatory requirements, particularly regarding battery safety standards and end-of-life recycling obligations. The ability to adapt to changing environmental regulations and demonstrate strong sustainability credentials will become increasingly important for long-term success in the market.
Electric Bus Battery Pack Market Leaders
-
BYD Company Ltd.
-
China Aviation Battery Co. Ltd. (CALB)
-
Contemporary Amperex Technology Co. Ltd. (CATL)
-
Gotion High-Tech Co. Ltd.
-
Guoxuan High-tech Co. Ltd.
- *Disclaimer: Major Players sorted in no particular order

Need More Details on Market Players and Competiters?
Download PDF
Electric Bus Battery Pack Market News
- February 2023: Samsung SDI is expanding investment in its Hungary plant, which has the largest production capacity to respond to the fast-increasing demand for mid- to large-size batteries.
- January 2023: Korean battery maker Samsung SDI posted record-high profit in 2022, driven by solid demand for electric vehicle batteries and energy storage systems.
- November 2022: Samsung SDI has signed an agreement with Sungkyunkwan University to establish a course for battery technologies to raise battery experts.
Free With This Report
Our comprehensive data set offers over 120 free charts, providing detailed regional and country-level insights into the EV battery pack industry. This includes analyses of distribution and production centers, variations in average selling prices (ASPs) across different regions, and a deep dive into industry trends like demand shifts and technological innovations. We also offer a thorough market segmentation, examining different battery chemistries, capacities, and form factors, alongside an in-depth understanding of market trends such as the adoption of advanced technologies and the impact of environmental regulations. Additionally, we provide an overview of major industry players, a look at the regulatory landscape, and market size analysis in terms of revenue and volume, all culminating in projections and forecasts that consider emerging trends and potential industry shifts.


Electric Bus Battery Pack Market Report - Table of Contents
1. EXECUTIVE SUMMARY & KEY FINDINGS
2. REPORT OFFERS
3. INTRODUCTION
- 3.1 Study Assumptions & Market Definition
- 3.2 Scope of the Study
- 3.3 Research Methodology
4. KEY INDUSTRY TRENDS
- 4.1 Electric Bus Sales
- 4.2 Electric Bus Sales By OEMs
- 4.3 Best-selling EV Models
- 4.4 OEMs With Preferable Battery Chemistry
- 4.5 Battery Pack Price
- 4.6 Battery Material Cost
- 4.7 Price Chart Of Different Battery Chemistry
- 4.8 Who Supply Whom
- 4.9 EV Battery Capacity And Efficiency
- 4.10 Number Of EV Models Launched
-
4.11 Regulatory Framework
- 4.11.1 Belgium
- 4.11.2 Brazil
- 4.11.3 Canada
- 4.11.4 China
- 4.11.5 Colombia
- 4.11.6 France
- 4.11.7 Germany
- 4.11.8 Hungary
- 4.11.9 India
- 4.11.10 Indonesia
- 4.11.11 Japan
- 4.11.12 Mexico
- 4.11.13 Poland
- 4.11.14 Thailand
- 4.11.15 UK
- 4.11.16 US
- 4.12 Value Chain & Distribution Channel Analysis
5. MARKET SEGMENTATION (includes market size in Value in USD and Volume, Forecasts up to 2029 and analysis of growth prospects)
-
5.1 Propulsion Type
- 5.1.1 BEV
- 5.1.2 PHEV
-
5.2 Battery Chemistry
- 5.2.1 LFP
- 5.2.2 NCA
- 5.2.3 NCM
- 5.2.4 NMC
- 5.2.5 Others
-
5.3 Capacity
- 5.3.1 15 kWh to 40 kWh
- 5.3.2 40 kWh to 80 kWh
- 5.3.3 Above 80 kWh
- 5.3.4 Less than 15 kWh
-
5.4 Battery Form
- 5.4.1 Cylindrical
- 5.4.2 Pouch
- 5.4.3 Prismatic
-
5.5 Method
- 5.5.1 Laser
- 5.5.2 Wire
-
5.6 Component
- 5.6.1 Anode
- 5.6.2 Cathode
- 5.6.3 Electrolyte
- 5.6.4 Separator
-
5.7 Material Type
- 5.7.1 Cobalt
- 5.7.2 Lithium
- 5.7.3 Manganese
- 5.7.4 Natural Graphite
- 5.7.5 Nickel
- 5.7.6 Other Materials
-
5.8 Region
- 5.8.1 Asia-Pacific
- 5.8.1.1 By Country
- 5.8.1.1.1 China
- 5.8.1.1.2 India
- 5.8.1.1.3 Japan
- 5.8.1.1.4 South Korea
- 5.8.1.1.5 Thailand
- 5.8.1.1.6 Rest-of-Asia-Pacific
- 5.8.2 Europe
- 5.8.2.1 By Country
- 5.8.2.1.1 France
- 5.8.2.1.2 Germany
- 5.8.2.1.3 Hungary
- 5.8.2.1.4 Italy
- 5.8.2.1.5 Poland
- 5.8.2.1.6 Sweden
- 5.8.2.1.7 UK
- 5.8.2.1.8 Rest-of-Europe
- 5.8.3 Middle East & Africa
- 5.8.4 North America
- 5.8.4.1 By Country
- 5.8.4.1.1 Canada
- 5.8.4.1.2 US
- 5.8.5 South America
6. COMPETITIVE LANDSCAPE
- 6.1 Key Strategic Moves
- 6.2 Market Share Analysis
- 6.3 Company Landscape
-
6.4 Company Profiles
- 6.4.1 BMZ Batterien-Montage-Zentrum GmbH
- 6.4.2 BYD Company Ltd.
- 6.4.3 China Aviation Battery Co. Ltd. (CALB)
- 6.4.4 Contemporary Amperex Technology Co. Ltd. (CATL)
- 6.4.5 Farasis Energy (Ganzhou) Co. Ltd.
- 6.4.6 Gotion High-Tech Co. Ltd.
- 6.4.7 Guoxuan High-tech Co. Ltd.
- 6.4.8 Leclanché SA
- 6.4.9 LG Energy Solution Ltd.
- 6.4.10 NFI Group Inc.
- 6.4.11 Panasonic Holdings Corporation
- 6.4.12 Proterra Operating Company Inc.
- 6.4.13 Samsung SDI Co. Ltd.
- 6.4.14 Sunwoda Electric Vehicle Battery Co. Ltd. (Sunwoda)
- 6.4.15 Tata Autocomp Systems Ltd.
- 6.4.16 TOSHIBA Corp.
- *List Not Exhaustive
7. KEY STRATEGIC QUESTIONS FOR EV BATTERY PACK CEOS
8. APPENDIX
-
8.1 Global Overview
- 8.1.1 Overview
- 8.1.2 Porter’s Five Forces Framework
- 8.1.3 Global Value Chain Analysis
- 8.1.4 Market Dynamics (DROs)
- 8.2 Sources & References
- 8.3 List of Tables & Figures
- 8.4 Primary Insights
- 8.5 Data Pack
- 8.6 Glossary of Terms
You Can Purchase Parts Of This Report. Check Out Prices For Specific Sections
Get Price Break-up Now
List of Tables & Figures
- Figure 1:
- ELECTRIC VEHICLE SALES, BY BODY TYPE, UNITS, GLOBAL, 2017 - 2029
- Figure 2:
- ELECTRIC VEHICLE SALES, BY MAJOR OEMS, UNITS, GLOBAL, 2023
- Figure 3:
- ELECTRIC VEHICLE SALES, BY MAJOR OEMS, UNITS, GLOBAL, 2023
- Figure 4:
- BEST-SELLING EV MODELS, UNITS, GLOBAL, 2023
- Figure 5:
- OEMS MARKET SHARE BY ELECTRIC VEHICLE BATTERY CHEMISTRY, VOLUME %, GLOBAL, 2023
- Figure 6:
- ELECTRIC VEHICLE BATTERY CELL AND PACK PRICE, USD, GLOBAL, 2017 - 2029
- Figure 7:
- ELECTRIC VEHICLE KEY BATTERY MATERIAL PRICE, BY MATERIAL, USD, GLOBAL, 2017 - 2029
- Figure 8:
- ELECTRIC VEHICLE BATTERY PRICE, BY BATTERY CHEMISTRY, USD, GLOBAL, 2017 - 2029
- Figure 9:
- EV BATTERY PACK CAPACITY AND EFFICIENCY, KM/KWH, GLOBAL, 2023
- Figure 10:
- UPCOMING EV MODELS, BY BODY TYPE, UNITS, GLOBAL, 2023
- Figure 11:
- BREAKDOWN OF ELECTRIC BUS BATTERY PACK MARKET, KWH, GLOBAL, 2017 - 2029
- Figure 12:
- BREAKDOWN OF ELECTRIC BUS BATTERY PACK MARKET, USD, GLOBAL, 2017 - 2029
- Figure 13:
- BREAKDOWN OF ELECTRIC BUS BATTERY PACK MARKET, BY PROPULSION TYPE, KWH, GLOBAL, 2017 - 2029
- Figure 14:
- BREAKDOWN OF ELECTRIC BUS BATTERY PACK MARKET, BY PROPULSION TYPE, USD, GLOBAL, 2017 - 2029
- Figure 15:
- BREAKDOWN OF ELECTRIC BUS BATTERY PACK MARKET, PROPULSION TYPE, VOLUME SHARE (%), GLOBAL, 2022 & 2029
- Figure 16:
- BREAKDOWN OF ELECTRIC BUS BATTERY PACK MARKET, PROPULSION TYPE, VALUE SHARE (%), GLOBAL, 2022 & 2029
- Figure 17:
- BREAKDOWN OF ELECTRIC BUS BATTERY PACK MARKET, BY BEV, KWH, GLOBAL, 2017 - 2029
- Figure 18:
- BREAKDOWN OF ELECTRIC BUS BATTERY PACK MARKET, BY BEV, USD, GLOBAL, 2017 - 2029
- Figure 19:
- BREAKDOWN OF ELECTRIC BUS BATTERY PACK MARKET, BY PHEV, KWH, GLOBAL, 2017 - 2029
- Figure 20:
- BREAKDOWN OF ELECTRIC BUS BATTERY PACK MARKET, BY PHEV, USD, GLOBAL, 2017 - 2029
- Figure 21:
- BREAKDOWN OF ELECTRIC BUS BATTERY PACK MARKET, BY BATTERY CHEMISTRY, KWH, GLOBAL, 2017 - 2029
- Figure 22:
- BREAKDOWN OF ELECTRIC BUS BATTERY PACK MARKET, BY BATTERY CHEMISTRY, USD, GLOBAL, 2017 - 2029
- Figure 23:
- BREAKDOWN OF ELECTRIC BUS BATTERY PACK MARKET, BATTERY CHEMISTRY, VOLUME SHARE (%), GLOBAL, 2022 & 2029
- Figure 24:
- BREAKDOWN OF ELECTRIC BUS BATTERY PACK MARKET, BATTERY CHEMISTRY, VALUE SHARE (%), GLOBAL, 2022 & 2029
- Figure 25:
- BREAKDOWN OF ELECTRIC BUS BATTERY PACK MARKET, BY LFP, KWH, GLOBAL, 2017 - 2029
- Figure 26:
- BREAKDOWN OF ELECTRIC BUS BATTERY PACK MARKET, BY LFP, USD, GLOBAL, 2017 - 2029
- Figure 27:
- BREAKDOWN OF ELECTRIC BUS BATTERY PACK MARKET, BY NCA, KWH, GLOBAL, 2017 - 2029
- Figure 28:
- BREAKDOWN OF ELECTRIC BUS BATTERY PACK MARKET, BY NCA, USD, GLOBAL, 2017 - 2029
- Figure 29:
- BREAKDOWN OF ELECTRIC BUS BATTERY PACK MARKET, BY NCM, KWH, GLOBAL, 2017 - 2029
- Figure 30:
- BREAKDOWN OF ELECTRIC BUS BATTERY PACK MARKET, BY NCM, USD, GLOBAL, 2017 - 2029
- Figure 31:
- BREAKDOWN OF ELECTRIC BUS BATTERY PACK MARKET, BY NMC, KWH, GLOBAL, 2017 - 2029
- Figure 32:
- BREAKDOWN OF ELECTRIC BUS BATTERY PACK MARKET, BY NMC, USD, GLOBAL, 2017 - 2029
- Figure 33:
- BREAKDOWN OF ELECTRIC BUS BATTERY PACK MARKET, BY OTHERS, KWH, GLOBAL, 2017 - 2029
- Figure 34:
- BREAKDOWN OF ELECTRIC BUS BATTERY PACK MARKET, BY OTHERS, USD, GLOBAL, 2017 - 2029
- Figure 35:
- BREAKDOWN OF ELECTRIC BUS BATTERY PACK MARKET, BY CAPACITY, KWH, GLOBAL, 2017 - 2029
- Figure 36:
- BREAKDOWN OF ELECTRIC BUS BATTERY PACK MARKET, BY CAPACITY, USD, GLOBAL, 2017 - 2029
- Figure 37:
- BREAKDOWN OF ELECTRIC BUS BATTERY PACK MARKET, CAPACITY, VOLUME SHARE (%), GLOBAL, 2022 & 2029
- Figure 38:
- BREAKDOWN OF ELECTRIC BUS BATTERY PACK MARKET, CAPACITY, VALUE SHARE (%), GLOBAL, 2022 & 2029
- Figure 39:
- BREAKDOWN OF ELECTRIC BUS BATTERY PACK MARKET, BY 15 KWH TO 40 KWH, KWH, GLOBAL, 2017 - 2029
- Figure 40:
- BREAKDOWN OF ELECTRIC BUS BATTERY PACK MARKET, BY 15 KWH TO 40 KWH, USD, GLOBAL, 2017 - 2029
- Figure 41:
- BREAKDOWN OF ELECTRIC BUS BATTERY PACK MARKET, BY 40 KWH TO 80 KWH, KWH, GLOBAL, 2017 - 2029
- Figure 42:
- BREAKDOWN OF ELECTRIC BUS BATTERY PACK MARKET, BY 40 KWH TO 80 KWH, USD, GLOBAL, 2017 - 2029
- Figure 43:
- BREAKDOWN OF ELECTRIC BUS BATTERY PACK MARKET, BY ABOVE 80 KWH, KWH, GLOBAL, 2017 - 2029
- Figure 44:
- BREAKDOWN OF ELECTRIC BUS BATTERY PACK MARKET, BY ABOVE 80 KWH, USD, GLOBAL, 2017 - 2029
- Figure 45:
- BREAKDOWN OF ELECTRIC BUS BATTERY PACK MARKET, BY LESS THAN 15 KWH, KWH, GLOBAL, 2017 - 2029
- Figure 46:
- BREAKDOWN OF ELECTRIC BUS BATTERY PACK MARKET, BY LESS THAN 15 KWH, USD, GLOBAL, 2017 - 2029
- Figure 47:
- BREAKDOWN OF ELECTRIC BUS BATTERY PACK MARKET, BY BATTERY FORM, KWH, GLOBAL, 2017 - 2029
- Figure 48:
- BREAKDOWN OF ELECTRIC BUS BATTERY PACK MARKET, BY BATTERY FORM, USD, GLOBAL, 2017 - 2029
- Figure 49:
- BREAKDOWN OF ELECTRIC BUS BATTERY PACK MARKET, BATTERY FORM, VOLUME SHARE (%), GLOBAL, 2022 & 2029
- Figure 50:
- BREAKDOWN OF ELECTRIC BUS BATTERY PACK MARKET, BATTERY FORM, VALUE SHARE (%), GLOBAL, 2022 & 2029
- Figure 51:
- BREAKDOWN OF ELECTRIC BUS BATTERY PACK MARKET, BY CYLINDRICAL, KWH, GLOBAL, 2017 - 2029
- Figure 52:
- BREAKDOWN OF ELECTRIC BUS BATTERY PACK MARKET, BY CYLINDRICAL, USD, GLOBAL, 2017 - 2029
- Figure 53:
- BREAKDOWN OF ELECTRIC BUS BATTERY PACK MARKET, BY POUCH, KWH, GLOBAL, 2017 - 2029
- Figure 54:
- BREAKDOWN OF ELECTRIC BUS BATTERY PACK MARKET, BY POUCH, USD, GLOBAL, 2017 - 2029
- Figure 55:
- BREAKDOWN OF ELECTRIC BUS BATTERY PACK MARKET, BY PRISMATIC, KWH, GLOBAL, 2017 - 2029
- Figure 56:
- BREAKDOWN OF ELECTRIC BUS BATTERY PACK MARKET, BY PRISMATIC, USD, GLOBAL, 2017 - 2029
- Figure 57:
- BREAKDOWN OF ELECTRIC BUS BATTERY PACK MARKET, BY METHOD, KWH, GLOBAL, 2017 - 2029
- Figure 58:
- BREAKDOWN OF ELECTRIC BUS BATTERY PACK MARKET, BY METHOD, USD, GLOBAL, 2017 - 2029
- Figure 59:
- BREAKDOWN OF ELECTRIC BUS BATTERY PACK MARKET, METHOD, VOLUME SHARE (%), GLOBAL, 2022 & 2029
- Figure 60:
- BREAKDOWN OF ELECTRIC BUS BATTERY PACK MARKET, METHOD, VALUE SHARE (%), GLOBAL, 2022 & 2029
- Figure 61:
- BREAKDOWN OF ELECTRIC BUS BATTERY PACK MARKET, BY LASER, KWH, GLOBAL, 2017 - 2029
- Figure 62:
- BREAKDOWN OF ELECTRIC BUS BATTERY PACK MARKET, BY LASER, USD, GLOBAL, 2017 - 2029
- Figure 63:
- BREAKDOWN OF ELECTRIC BUS BATTERY PACK MARKET, BY WIRE, KWH, GLOBAL, 2017 - 2029
- Figure 64:
- BREAKDOWN OF ELECTRIC BUS BATTERY PACK MARKET, BY WIRE, USD, GLOBAL, 2017 - 2029
- Figure 65:
- BREAKDOWN OF ELECTRIC BUS BATTERY PACK MARKET, BY COMPONENT, UNITS, GLOBAL, 2017 - 2029
- Figure 66:
- BREAKDOWN OF ELECTRIC BUS BATTERY PACK MARKET, BY COMPONENT, USD, GLOBAL, 2017 - 2029
- Figure 67:
- BREAKDOWN OF ELECTRIC BUS BATTERY PACK MARKET, COMPONENT, VOLUME SHARE (%), GLOBAL, 2022 & 2029
- Figure 68:
- BREAKDOWN OF ELECTRIC BUS BATTERY PACK MARKET, COMPONENT, VALUE SHARE (%), GLOBAL, 2022 & 2029
- Figure 69:
- BREAKDOWN OF ELECTRIC BUS BATTERY PACK MARKET, BY ANODE, UNITS, GLOBAL, 2017 - 2029
- Figure 70:
- BREAKDOWN OF ELECTRIC BUS BATTERY PACK MARKET, BY ANODE, USD, GLOBAL, 2017 - 2029
- Figure 71:
- BREAKDOWN OF ELECTRIC BUS BATTERY PACK MARKET, BY CATHODE, UNITS, GLOBAL, 2017 - 2029
- Figure 72:
- BREAKDOWN OF ELECTRIC BUS BATTERY PACK MARKET, BY CATHODE, USD, GLOBAL, 2017 - 2029
- Figure 73:
- BREAKDOWN OF ELECTRIC BUS BATTERY PACK MARKET, BY ELECTROLYTE, UNITS, GLOBAL, 2017 - 2029
- Figure 74:
- BREAKDOWN OF ELECTRIC BUS BATTERY PACK MARKET, BY ELECTROLYTE, USD, GLOBAL, 2017 - 2029
- Figure 75:
- BREAKDOWN OF ELECTRIC BUS BATTERY PACK MARKET, BY SEPARATOR, UNITS, GLOBAL, 2017 - 2029
- Figure 76:
- BREAKDOWN OF ELECTRIC BUS BATTERY PACK MARKET, BY SEPARATOR, USD, GLOBAL, 2017 - 2029
- Figure 77:
- BREAKDOWN OF ELECTRIC BUS BATTERY PACK MARKET, BY MATERIAL TYPE, KG, GLOBAL, 2017 - 2029
- Figure 78:
- BREAKDOWN OF ELECTRIC BUS BATTERY PACK MARKET, BY MATERIAL TYPE, USD, GLOBAL, 2017 - 2029
- Figure 79:
- BREAKDOWN OF ELECTRIC BUS BATTERY PACK MARKET, MATERIAL TYPE, VOLUME SHARE (%), GLOBAL, 2022 & 2029
- Figure 80:
- BREAKDOWN OF ELECTRIC BUS BATTERY PACK MARKET, MATERIAL TYPE, VALUE SHARE (%), GLOBAL, 2022 & 2029
- Figure 81:
- BREAKDOWN OF ELECTRIC BUS BATTERY PACK MARKET, BY COBALT, KG, GLOBAL, 2017 - 2029
- Figure 82:
- BREAKDOWN OF ELECTRIC BUS BATTERY PACK MARKET, BY COBALT, USD, GLOBAL, 2017 - 2029
- Figure 83:
- BREAKDOWN OF ELECTRIC BUS BATTERY PACK MARKET, BY LITHIUM, KG, GLOBAL, 2017 - 2029
- Figure 84:
- BREAKDOWN OF ELECTRIC BUS BATTERY PACK MARKET, BY LITHIUM, USD, GLOBAL, 2017 - 2029
- Figure 85:
- BREAKDOWN OF ELECTRIC BUS BATTERY PACK MARKET, BY MANGANESE, KG, GLOBAL, 2017 - 2029
- Figure 86:
- BREAKDOWN OF ELECTRIC BUS BATTERY PACK MARKET, BY MANGANESE, USD, GLOBAL, 2017 - 2029
- Figure 87:
- BREAKDOWN OF ELECTRIC BUS BATTERY PACK MARKET, BY NATURAL GRAPHITE, KG, GLOBAL, 2017 - 2029
- Figure 88:
- BREAKDOWN OF ELECTRIC BUS BATTERY PACK MARKET, BY NATURAL GRAPHITE, USD, GLOBAL, 2017 - 2029
- Figure 89:
- BREAKDOWN OF ELECTRIC BUS BATTERY PACK MARKET, BY NICKEL, KG, GLOBAL, 2017 - 2029
- Figure 90:
- BREAKDOWN OF ELECTRIC BUS BATTERY PACK MARKET, BY NICKEL, USD, GLOBAL, 2017 - 2029
- Figure 91:
- BREAKDOWN OF ELECTRIC BUS BATTERY PACK MARKET, BY OTHER MATERIALS, KG, GLOBAL, 2017 - 2029
- Figure 92:
- BREAKDOWN OF ELECTRIC BUS BATTERY PACK MARKET, BY OTHER MATERIALS, USD, GLOBAL, 2017 - 2029
- Figure 93:
- BREAKDOWN OF ELECTRIC BUS BATTERY PACK MARKET, BY REGION, KWH, GLOBAL, 2017 - 2029
- Figure 94:
- BREAKDOWN OF ELECTRIC BUS BATTERY PACK MARKET, BY REGION, USD, GLOBAL, 2017 - 2029
- Figure 95:
- BREAKDOWN OF ELECTRIC BUS BATTERY PACK MARKET, REGION, VOLUME SHARE (%), GLOBAL, 2022 & 2029
- Figure 96:
- BREAKDOWN OF ELECTRIC BUS BATTERY PACK MARKET, REGION, VALUE SHARE (%), GLOBAL, 2022 & 2029
- Figure 97:
- BREAKDOWN OF ELECTRIC BUS BATTERY PACK MARKET, BY COUNTRY, KWH, GLOBAL, 2017 - 2029
- Figure 98:
- BREAKDOWN OF ELECTRIC BUS BATTERY PACK MARKET, BY COUNTRY, USD, GLOBAL, 2017 - 2029
- Figure 99:
- BREAKDOWN OF ELECTRIC BUS BATTERY PACK MARKET, COUNTRY, VOLUME SHARE (%), GLOBAL, 2022 & 2029
- Figure 100:
- BREAKDOWN OF ELECTRIC BUS BATTERY PACK MARKET, COUNTRY, VALUE SHARE (%), GLOBAL, 2022 & 2029
- Figure 101:
- BREAKDOWN OF ELECTRIC BUS BATTERY PACK MARKET, BY CHINA, KWH, GLOBAL, 2017 - 2029
- Figure 102:
- BREAKDOWN OF ELECTRIC BUS BATTERY PACK MARKET, BY CHINA, USD, GLOBAL, 2017 - 2029
- Figure 103:
- BREAKDOWN OF ELECTRIC BUS BATTERY PACK MARKET, BY INDIA, KWH, GLOBAL, 2017 - 2029
- Figure 104:
- BREAKDOWN OF ELECTRIC BUS BATTERY PACK MARKET, BY INDIA, USD, GLOBAL, 2017 - 2029
- Figure 105:
- BREAKDOWN OF ELECTRIC BUS BATTERY PACK MARKET, BY JAPAN, KWH, GLOBAL, 2017 - 2029
- Figure 106:
- BREAKDOWN OF ELECTRIC BUS BATTERY PACK MARKET, BY JAPAN, USD, GLOBAL, 2017 - 2029
- Figure 107:
- BREAKDOWN OF ELECTRIC BUS BATTERY PACK MARKET, BY SOUTH KOREA, KWH, GLOBAL, 2017 - 2029
- Figure 108:
- BREAKDOWN OF ELECTRIC BUS BATTERY PACK MARKET, BY SOUTH KOREA, USD, GLOBAL, 2017 - 2029
- Figure 109:
- BREAKDOWN OF ELECTRIC BUS BATTERY PACK MARKET, BY THAILAND, KWH, GLOBAL, 2017 - 2029
- Figure 110:
- BREAKDOWN OF ELECTRIC BUS BATTERY PACK MARKET, BY THAILAND, USD, GLOBAL, 2017 - 2029
- Figure 111:
- BREAKDOWN OF ELECTRIC BUS BATTERY PACK MARKET, BY REST-OF-ASIA-PACIFIC, KWH, GLOBAL, 2017 - 2029
- Figure 112:
- BREAKDOWN OF ELECTRIC BUS BATTERY PACK MARKET, BY REST-OF-ASIA-PACIFIC, USD, GLOBAL, 2017 - 2029
- Figure 113:
- BREAKDOWN OF ELECTRIC BUS BATTERY PACK MARKET, BY COUNTRY, KWH, GLOBAL, 2017 - 2029
- Figure 114:
- BREAKDOWN OF ELECTRIC BUS BATTERY PACK MARKET, BY COUNTRY, USD, GLOBAL, 2017 - 2029
- Figure 115:
- BREAKDOWN OF ELECTRIC BUS BATTERY PACK MARKET, COUNTRY, VOLUME SHARE (%), GLOBAL, 2022 & 2029
- Figure 116:
- BREAKDOWN OF ELECTRIC BUS BATTERY PACK MARKET, COUNTRY, VALUE SHARE (%), GLOBAL, 2022 & 2029
- Figure 117:
- BREAKDOWN OF ELECTRIC BUS BATTERY PACK MARKET, BY FRANCE, KWH, GLOBAL, 2017 - 2029
- Figure 118:
- BREAKDOWN OF ELECTRIC BUS BATTERY PACK MARKET, BY FRANCE, USD, GLOBAL, 2017 - 2029
- Figure 119:
- BREAKDOWN OF ELECTRIC BUS BATTERY PACK MARKET, BY GERMANY, KWH, GLOBAL, 2017 - 2029
- Figure 120:
- BREAKDOWN OF ELECTRIC BUS BATTERY PACK MARKET, BY GERMANY, USD, GLOBAL, 2017 - 2029
- Figure 121:
- BREAKDOWN OF ELECTRIC BUS BATTERY PACK MARKET, BY HUNGARY, KWH, GLOBAL, 2017 - 2029
- Figure 122:
- BREAKDOWN OF ELECTRIC BUS BATTERY PACK MARKET, BY HUNGARY, USD, GLOBAL, 2017 - 2029
- Figure 123:
- BREAKDOWN OF ELECTRIC BUS BATTERY PACK MARKET, BY ITALY, KWH, GLOBAL, 2017 - 2029
- Figure 124:
- BREAKDOWN OF ELECTRIC BUS BATTERY PACK MARKET, BY ITALY, USD, GLOBAL, 2017 - 2029
- Figure 125:
- BREAKDOWN OF ELECTRIC BUS BATTERY PACK MARKET, BY POLAND, KWH, GLOBAL, 2017 - 2029
- Figure 126:
- BREAKDOWN OF ELECTRIC BUS BATTERY PACK MARKET, BY POLAND, USD, GLOBAL, 2017 - 2029
- Figure 127:
- BREAKDOWN OF ELECTRIC BUS BATTERY PACK MARKET, BY SWEDEN, KWH, GLOBAL, 2017 - 2029
- Figure 128:
- BREAKDOWN OF ELECTRIC BUS BATTERY PACK MARKET, BY SWEDEN, USD, GLOBAL, 2017 - 2029
- Figure 129:
- BREAKDOWN OF ELECTRIC BUS BATTERY PACK MARKET, BY UK, KWH, GLOBAL, 2018 - 2029
- Figure 130:
- BREAKDOWN OF ELECTRIC BUS BATTERY PACK MARKET, BY UK, USD, GLOBAL, 2018 - 2029
- Figure 131:
- BREAKDOWN OF ELECTRIC BUS BATTERY PACK MARKET, BY REST-OF-EUROPE, KWH, GLOBAL, 2017 - 2029
- Figure 132:
- BREAKDOWN OF ELECTRIC BUS BATTERY PACK MARKET, BY REST-OF-EUROPE, USD, GLOBAL, 2017 - 2029
- Figure 133:
- BREAKDOWN OF ELECTRIC BUS BATTERY PACK MARKET, BY MIDDLE EAST & AFRICA, KWH, GLOBAL, 2017 - 2029
- Figure 134:
- BREAKDOWN OF ELECTRIC BUS BATTERY PACK MARKET, BY MIDDLE EAST & AFRICA, USD, GLOBAL, 2017 - 2029
- Figure 135:
- BREAKDOWN OF ELECTRIC BUS BATTERY PACK MARKET, BY COUNTRY, KWH, GLOBAL, 2017 - 2029
- Figure 136:
- BREAKDOWN OF ELECTRIC BUS BATTERY PACK MARKET, BY COUNTRY, USD, GLOBAL, 2017 - 2029
- Figure 137:
- BREAKDOWN OF ELECTRIC BUS BATTERY PACK MARKET, COUNTRY, VOLUME SHARE (%), GLOBAL, 2022 & 2029
- Figure 138:
- BREAKDOWN OF ELECTRIC BUS BATTERY PACK MARKET, COUNTRY, VALUE SHARE (%), GLOBAL, 2022 & 2029
- Figure 139:
- BREAKDOWN OF ELECTRIC BUS BATTERY PACK MARKET, BY CANADA, KWH, GLOBAL, 2017 - 2029
- Figure 140:
- BREAKDOWN OF ELECTRIC BUS BATTERY PACK MARKET, BY CANADA, USD, GLOBAL, 2017 - 2029
- Figure 141:
- BREAKDOWN OF ELECTRIC BUS BATTERY PACK MARKET, BY US, KWH, GLOBAL, 2017 - 2029
- Figure 142:
- BREAKDOWN OF ELECTRIC BUS BATTERY PACK MARKET, BY US, USD, GLOBAL, 2017 - 2029
- Figure 143:
- BREAKDOWN OF ELECTRIC BUS BATTERY PACK MARKET, BY SOUTH AMERICA, KWH, GLOBAL, 2017 - 2029
- Figure 144:
- BREAKDOWN OF ELECTRIC BUS BATTERY PACK MARKET, BY SOUTH AMERICA, USD, GLOBAL, 2017 - 2029
- Figure 145:
- ELECTRIC BUS BATTERY PACK MARKET, MOST ACTIVE COMPANIES, BY NUMBER OF STRATEGIC MOVES, 2020 - 2022
- Figure 146:
- ELECTRIC BUS BATTERY PACK MARKET, MOST ADOPTED STRATEGIES, 2020 - 2022
- Figure 147:
- ELECTRIC BUS BATTERY PACK MARKET SHARE(%), BY MAJOR PLAYER REVENUE, 2022
Electric Bus Battery Pack Industry Segmentation
BEV, PHEV are covered as segments by Propulsion Type. LFP, NCA, NCM, NMC, Others are covered as segments by Battery Chemistry. 15 kWh to 40 kWh, 40 kWh to 80 kWh, Above 80 kWh, Less than 15 kWh are covered as segments by Capacity. Cylindrical, Pouch, Prismatic are covered as segments by Battery Form. Laser, Wire are covered as segments by Method. Anode, Cathode, Electrolyte, Separator are covered as segments by Component. Cobalt, Lithium, Manganese, Natural Graphite, Nickel are covered as segments by Material Type. Asia-Pacific, Europe, Middle East & Africa, North America, South America are covered as segments by Region.| Propulsion Type | BEV | |||
| PHEV | ||||
| Battery Chemistry | LFP | |||
| NCA | ||||
| NCM | ||||
| NMC | ||||
| Others | ||||
| Capacity | 15 kWh to 40 kWh | |||
| 40 kWh to 80 kWh | ||||
| Above 80 kWh | ||||
| Less than 15 kWh | ||||
| Battery Form | Cylindrical | |||
| Pouch | ||||
| Prismatic | ||||
| Method | Laser | |||
| Wire | ||||
| Component | Anode | |||
| Cathode | ||||
| Electrolyte | ||||
| Separator | ||||
| Material Type | Cobalt | |||
| Lithium | ||||
| Manganese | ||||
| Natural Graphite | ||||
| Nickel | ||||
| Other Materials | ||||
| Region | Asia-Pacific | By Country | China | |
| India | ||||
| Japan | ||||
| South Korea | ||||
| Thailand | ||||
| Rest-of-Asia-Pacific | ||||
| Europe | By Country | France | ||
| Germany | ||||
| Hungary | ||||
| Italy | ||||
| Poland | ||||
| Sweden | ||||
| UK | ||||
| Rest-of-Europe | ||||
| Middle East & Africa | ||||
| North America | By Country | Canada | ||
| US | ||||
| South America | ||||
Need A Different Region or Segment?
Customize Now
Market Definition
- Battery Chemistry - Various types of battery chemistry considred under this segment include LFP, NCA, NCM, NMC, Others.
- Battery Form - The types of battery forms offered under this segment include Cylindrical, Pouch and Prismatic.
- Body Type - Body types considered under this segment include is variety of buses.
- Capacity - Various types of battery capacities inldude under theis segment are 15 kWH to 40 kWH, 40 kWh to 80 kWh, Above 80 kWh and Less than 15 kWh.
- Component - Various components covered under this segment include anode, cathode, electrolyte, separator.
- Material Type - Various material covered under this segment include cobalt, lithium, manganese, natural graphite, nickel, other material.
- Method - The types of method covered under this segment include laser and wire.
- Propulsion Type - Propulsion types considered under this segment include BEV (Battery electric vehicles), PHEV (plug-in hybrid electric vehicle).
- ToC Type - ToC 3
- Vehicle Type - Vehicle type considered under this segment include commercial vehicles with various EV powertrains.
| Keyword | Definition |
|---|---|
| Electric vehicle (EV) | A vehicle which uses one or more electric motors for propulsion. Includes cars, buses, and trucks. This term includes all-electric vehicles or battery electric vehicles and plug-in hybrid electric vehicles. |
| PEV | A plug-in electric vehicle is an electric vehicle that can be externally charged and generally includes all electric vehicles as well as plug-electric vehicles as well as plug-in hybrids. |
| Battery-as-a-Service | A business model in which the battery of an EV can be rented from a service provider or swapped with another battery when it runs out of charge |
| Battery Cell | The basic unit of an electric vehicle's battery pack, typically a lithium-ion cell, that stores electrical energy. |
| Module | A subsection of an EV battery pack, consisting of several cells grouped together, often used to facilitate manufacturing and maintenance. |
| Battery Management System (BMS) | An electronic system that manages a rechargeable battery by protecting the battery from operating outside its safe operating area, monitoring its state, calculating secondary data, reporting data, controlling its environment, and balancing it. |
| Energy Density | A measure of how much energy a battery cell can store in a given volume, usually expressed in watt-hours per liter (Wh/L). |
| Power Density | The rate at which energy can be delivered by the battery, often measured in watts per kilogram (W/kg). |
| Cycle Life | The number of complete charge-discharge cycles a battery can perform before its capacity falls under a specified percentage of its original capacity. |
| State of Charge (SOC) | A measurement, expressed as a percentage, that represents the current level of charge in a battery compared to its capacity. |
| State of Health (SOH) | An indicator of the overall condition of a battery, reflecting its current performance compared to when it was new. |
| Thermal Management System | A system designed to maintain optimal operating temperatures for an EV's battery pack, often using cooling or heating methods. |
| Fast Charging | A method of charging an EV battery at a much faster rate than standard charging, typically requiring specialized charging equipment. |
| Regenerative Braking | A system in electric and hybrid vehicles that recovers energy normally lost during braking and stores it in the battery. |
Need More Details on Market Definition?
Ask a Question
Research Methodology
Mordor Intelligence follows a four-step methodology in all its reports.
- Step-1: Identify Key Variables: To build a robust forecasting methodology, the variables and factors identified in Step-1 are tested against available historical market numbers. Through an iterative process, the variables required for market forecast are set and the model is built based on these variables.
- Step-2: Build a Market Model: Market-size estimations for the historical and forecast years have been provided in revenue and volume terms. Market revenue is calculated by multiplying the volume demand with volume-weighted average battery pack price (per kWh). Battery pack price estimation and forecast takes into account various factors affecting ASP, such as inflation rates, market demand shifts, production costs, technological developments, and consumer preferences, providing estimations for both historical data and future trends.
- Step-3: Validate and Finalize: In this important step, all market numbers, variables, and analyst calls are validated through an extensive network of primary research experts from the market studied. The respondents are selected across levels and functions to generate a holistic picture of the market studied.
- Step-4: Research Outputs: Syndicated Reports, Custom Consulting Assignments, Databases & Subscription Platforms

Get More Details On Research Methodology
Download PDF


