
Market Overview
| Study Period | 2020 - 2031 |
|---|---|
| Forecast Data Period | 2026 - 2031 |
| Base Year Market Size (2025) | USD 84.93 Billion |
| Market Size (2026) | USD 92.37 Billion |
| Market Size (2031) | USD 137.18 Billion |
| Growth Rate (2026 - 2031) | 8.23 % |
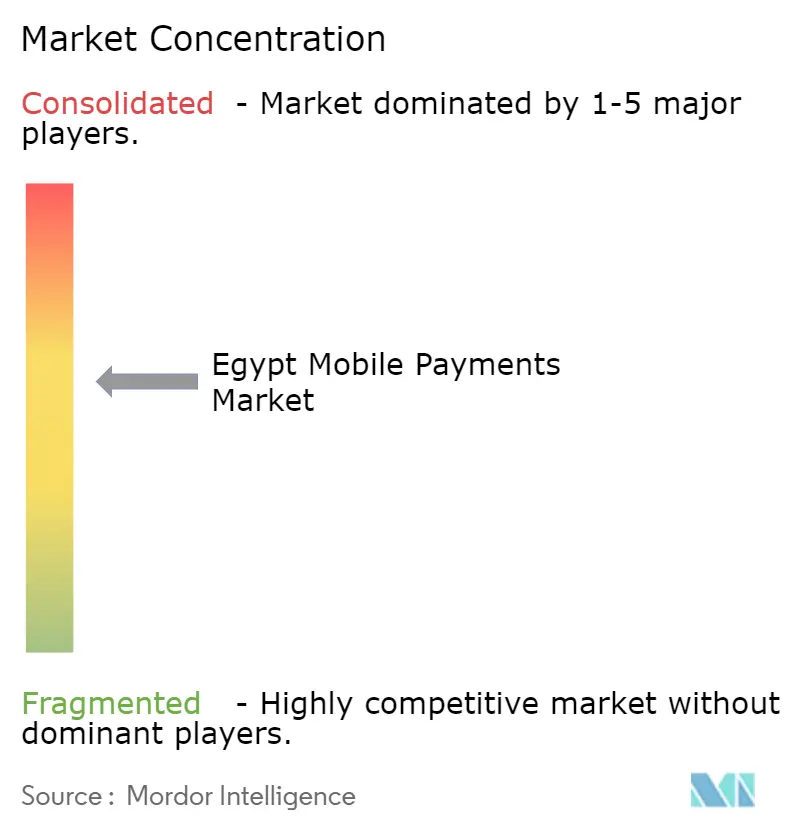
| Market Concentration | Medium |
Major Players *Disclaimer: Major Players sorted in no particular order Image © Mordor Intelligence. Reuse requires attribution under CC BY 4.0. | |
Egypt Mobile Payments Market Analysis by Mordor Intelligence
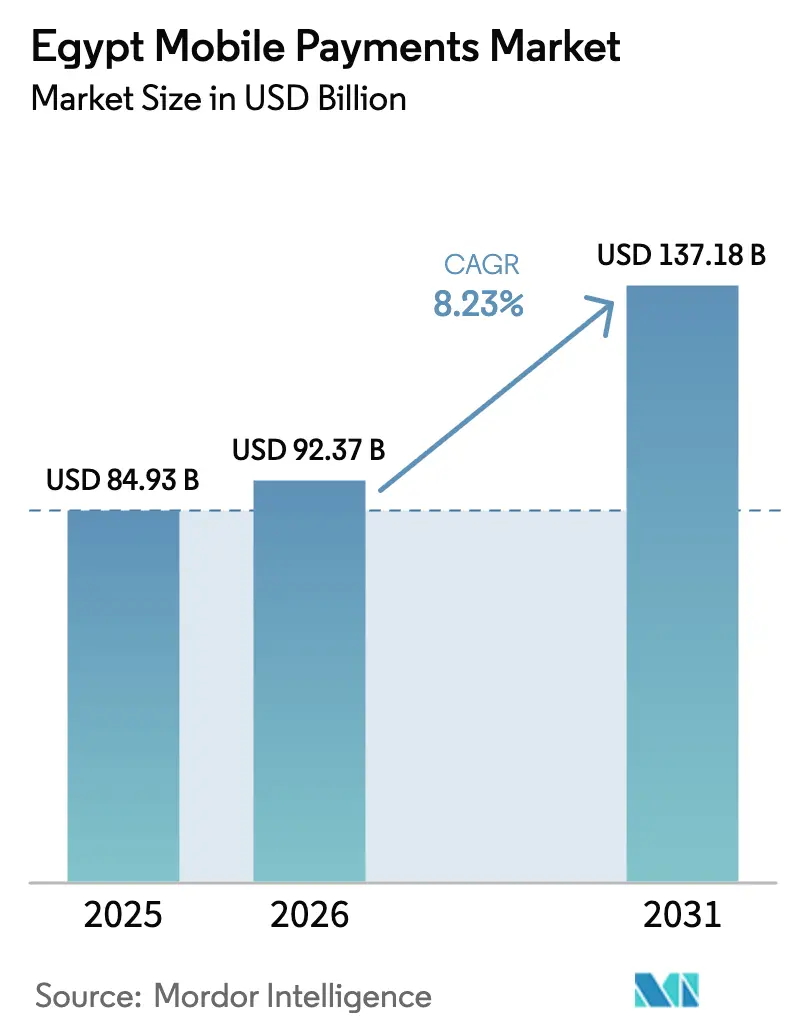
The Egypt mobile payments market size is projected to be USD 84.93 billion in 2025, USD 92.37 billion in 2026, and reach USD 137.18 billion by 2031, growing at a CAGR of 8.23% from 2026 to 2031. A mandatory QR-code acceptance program, the tokenization of state-backed Meeza cards inside wallet apps, and the rapid scale-up of the InstaPay instant-payment rail are jointly accelerating cash-to-digital migration among consumers and micro-merchants. Wallet interoperability over InstaPay reduces switching frictions, while soft POS applications turn low-cost Android handsets into payment terminals that meet Central Bank of Egypt (CBE) compliance thresholds. Cross-border wallet-to-wallet remittances from the Gulf Cooperation Council (GCC) compress transfer fees below 3% and inject immediate liquidity into household budgets. Challenger fintechs layer buy-now-pay-later (BNPL) and value-added services on top of wallets, elevating average revenue per user and drawing venture investment despite margin compression from CBE fee caps.
Key Report Takeaways
- By mode of payment, Online Sales led with 51.89% revenue share in 2025, while Point of Sales is forecast to expand at a 9.12% CAGR through 2031.
- By payment type, QR-based methods captured 48.67% of the Egypt mobile payments market share in 2025, yet NFC is poised to grow at a 10.24% CAGR as tokenization partnerships widen.
- By transaction type, Peer-to-Peer flows accounted for 53.92% of the Egypt mobile payments market size in 2025, whereas Person to Business transactions are set to advance at a 9.37% CAGR through 2031.
- By application, Retail and E-Commerce held 38.59% share of the Egypt mobile payments market size in 2025, while Transportation and Logistics is projected to accelerate at an 11.56% CAGR to 2031.
Note: Market size and forecast figures in this report are generated using Mordor Intelligence’s proprietary estimation framework, updated with the latest available data and insights as of 2026.
Market Trends and Insights
Drivers Impact Analysis of Egypt Mobile Payments Market*
| Driver | (~) % Impact on CAGR Forecast | Geographic Relevance | Impact Timeline |
|---|---|---|---|
| Surge in Real-Time Payments via InstaPay Rails | +2.3% | National, strongest in Greater Cairo, Alexandria, Giza | Medium term (2-4 years) |
| State-Backed Meeza Cards Integration into Wallets | +1.8% | Urban centers and government-employee segments | Medium term (2-4 years) |
| Merchant Shift to QR-Based Acceptance Under CBE Mandate | +1.5% | Formal retail and hospitality sectors nationwide | Short term (≤ 2 years) |
| Cross-Border Remittance Corridor Digitization (GCC-Egypt) | +1.2% | Inflows from UAE, Saudi Arabia, Kuwait, Qatar | Medium term (2-4 years) |
| Buy-Now-Pay-Later Apps Embedding Wallet Checkout | +0.9% | Cairo, Alexandria, Giza | Short term (≤ 2 years) |
| Generative-AI Fraud Analytics Lowering Charge-Back Rates | +0.5% | Early adopters among tier-1 banks | Long term (≥ 4 years) |
| Source: Mordor Intelligence | |||
Surge in Real-Time Payments Via InstaPay Rails
InstaPay’s instant-settlement design removes the multi-day clearing cycle that previously deterred micro-merchants from digital acceptance. By end-2024, 12.5 million users executed 1.5 billion transfers worth EGP 2.9 trillion (USD 62.2 billion), firmly positioning the rail as Egypt’s de facto interbank clearing layer.[1] The CBE’s decision to layer QR-code functionality onto InstaPay lowers merchant onboarding costs to near zero because a smartphone and static sticker replace dedicated point-of-sale hardware. Network effects intensify as every licensed wallet plugs into the same rail, encouraging single-app usage for consumers and widening addressable merchant coverage. The December 2024 cross-border pilot extended InstaPay into GCC corridors, accelerating instant liquidity for remittance recipients and adding a high-margin revenue stream for wallet operators.
State-Backed Meeza Cards Integration Into Wallets
Meeza counted 43.5 million cards in circulation by June 2025, making it Egypt’s largest domestic scheme . Mandatory tokenization of these cards into every wallet channels public-sector payroll, pension, and subsidy disbursements directly into the digital ecosystem, boosting daily active usage. Integration sidesteps earlier siloed wallet programs because Meeza credentials interoperate across issuing banks and InstaPay. Security improves through device-level tokenization, a key lesson from Apple Pay’s 40 million-plus NFC transactions in six months. Wallet providers gain a captive user base for bill payments and micro-credit upsell, while government agencies cut cash-handling overheads.
Merchant Shift to QR-Based Acceptance Under CBE Mandate
A June 2024 CBE directive compels every merchant with annual turnover above EGP 500,000 (USD 10,726) to accept digital payments, igniting a national QR rollout. Compared with a conventional POS terminal costing EGP 2,000 (USD 43) or more, a printed QR code slashes capital outlay and eliminates maintenance. Paymob onboarded 390,000 merchants in 2025, with QR transactions dominating sign-ups.[2] Fawry and telecom wallets piggy-backed on their agent footprints, distributing QR stickers to kiosks, cafés, and ride-hailing fleets. Transaction fees average 1.5-2.0%, and InstaPay guarantees next-day settlement, enhancing cash-flow visibility for micro-retailers.
Cross-Border Remittance Corridor Digitization (GCC-Egypt)
The GCC supplied USD 19.5 billion of remittances to Egypt in 2023. InstaPay’s December 2024 pilot and Vodafone Cash’s April 2025 wallet-to-wallet service trimmed average fees below 3% and delivered funds in minutes, replacing cash-based money-transfer operators that once charged up to 8%. TerraPay’s February 2026 alliance with botim money broadens coverage across Africa.[3] Faster, cheaper flows increase disposable income in Upper Egypt and Nile Delta households, expanding merchant purchases and bill-payment volumes within wallets.
Restraints Impact Analysis of Egypt Mobile Payments Market*
| Restraint | (~) % Impact on CAGR Forecast | Geographic Relevance | Impact Timeline |
|---|---|---|---|
| Cash-Centred Consumer Culture Outside Urban Centers | -1.1% | Rural governorates and peri-urban areas | Long term (≥ 4 years) |
| SIM-Swap and Social-Engineering Fraud Uptick | -0.7% | Nationwide, higher in dense cities | Short term (≤ 2 years) |
| Inconsistent KYC Enforcement Across Agents | -0.4% | Informal agent networks nationwide | Medium term (2-4 years) |
| Limited Merchant POS NFC Penetration | -0.3% | Small and micro-merchants nationwide | Medium term (2-4 years) |
| Source: Mordor Intelligence | |||
Cash-Centred Consumer Culture Outside Urban Centers
The Global Findex 2024 survey shows only 43.4% of adults hold a transaction account, and mobile-money usage is 13.8%, far below Egypt’s headline 76.3% inclusion rate. Informal merchants fear taxation, connectivity is unreliable, and older cohorts regard cash as safer, sustaining physical currency dominance in rural governorates. Because the CBE mandate targets merchants above a revenue floor, millions of micro-enterprises remain exempt, limiting network effects. Agent networks must continue expensive cash-in and cash-out operations, squeezing unit margins and slowing adoption curves beyond Greater Cairo and Alexandria.
SIM-Swap and Social-Engineering Fraud Uptick
SIM-swap attacks exploit loopholes in telecom verification processes, hijacking SMS one-time passwords and draining wallet balances. The GSMA’s 2024 report lists SIM-swap as a top threat in mobile-money markets.[4] Egypt’s fragmented agent landscape and variable identity checks heighten vulnerability, prompting the CBE to tighten KYC rules and cap unverified-wallet limits. Fraud episodes erode consumer trust and push risk-averse users back to cash, forcing wallet operators to invest in biometric authentication and AI-driven anomaly detection. Elevated compliance costs weigh on profitability until fraud analytics mature and user education campaigns gain traction.
*Our forecasts treat driver/restraint impacts as directional, not additive. The impact forecasts reflect baseline growth, mix effects, and variable interactions.
Egypt Mobile Payments Market Segment Analysis
By Mode of Payment:
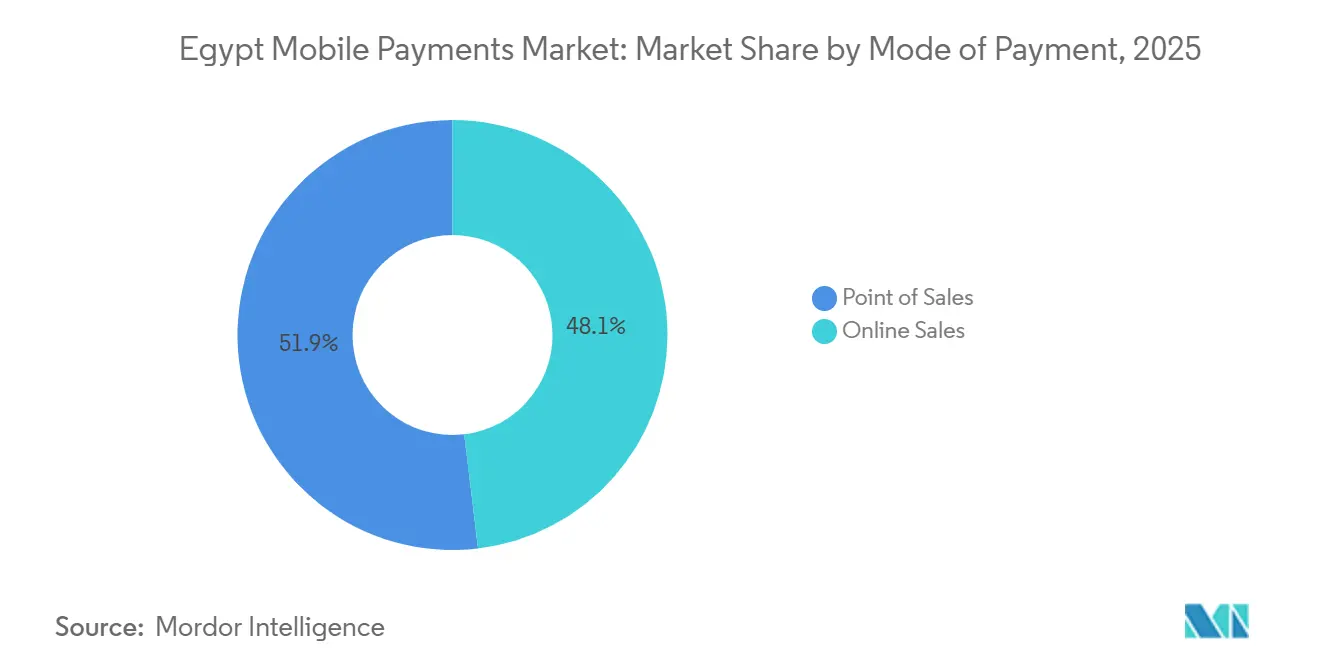
Point of Sales Momentum Accelerates With QR AdoptionPoint of Sales channels accounted for 48.11% of the Egypt mobile payments market size in 2025 and are forecast to expand at a 9.12% CAGR through 2031. Merchant compliance with the CBE mandate, combined with near-zero onboarding costs for QR stickers, is converting cash-only counters into digital acceptance points at unprecedented speed. Soft POS applications that transform Android phones into terminals eliminate hardware expense and integrate seamlessly with InstaPay, delivering same-day settlement that rivals cash liquidity. Fawry distributed QR to 382,000 agents, while Paymob enabled 390,000 merchants across retail, transport, and hospitality, shrinking the dominance gap with Online Sales.
Online Sales, though still larger at 51.89% share in 2025, face logistics headwinds such as last-mile costs and cash-on-delivery preferences outside Cairo. Yet the line between channels is blurring: Careem Pay’s wallet-transfer launch lets consumers fund ride-hailing and food delivery in-app, exemplifying omnichannel commerce. The Egypt mobile payments market benefits when merchants offer unified checkout both online and in-store, deepening user stickiness and transaction frequency. As QR acceptance becomes ubiquitous, the competitive axis shifts from acceptance availability to value-added features such as BNPL and loyalty integration.
By Payment Type:
NFC Set To Outpace QR From a Low BaseQR-based methods retained 48.67% share in 2025 due to effortless deployment across smartphones; nevertheless, NFC transactions are projected to grow at 10.24% CAGR, the fastest among payment types. Apple Pay’s December 2024 entry processed more than 40 million transactions inside six months, proving latent appetite for tap-to-pay convenience among affluent users. Google Wallet and Samsung Pay broaden device coverage, while First Abu Dhabi Bank Misr and Geidea are rolling out contactless-capable POS readers.
The choke point is merchant hardware: many existing terminals lack NFC and small retailers balk at upgrade costs. Mastercard’s Tap on Phone software may tilt economics by letting merchants accept NFC on unmodified Android devices, but pilots remain limited. QR enjoys full interoperability via InstaPay’s standardized spec, keeping switching costs low. Over time, dual-mode acceptance will prevail, giving consumers freedom to pick the fastest option and forcing acquirers to streamline settlement across both rails.
By Transaction Type:
Person to Business Formalization Propels GrowthPeer-to-Peer flows seized 53.92% share in 2025 owing to zero-fee InstaPay transfers, yet Person to Business payments are forecast to rise at a 9.37% CAGR, eclipsing overall market growth. Mandatory merchant acceptance and accelerating QR deployments encourage consumers to channel everyday purchases through wallets. Fawry and Paymob collectively enrolled more than 770,000 merchants, while Orange Cash processed EGP 943.4 billion (USD 20.3 billion) in Q2 2025, up 72% year on year, indicating robust Person to Business velocity.
P2P remains the onboarding gateway for first-time users, but revenue upside lies in merchant payments that carry interchange and discount fees. Embedded BNPL further boosts ticket sizes: Valu logged EGP 10.56 billion (0.23 billion) gross merchandise value in H1 2025, with many transactions initiated via wallet checkout. As micro-enterprises formalize to access digital credit, the Egypt mobile payments industry derives compounding gains from transactional data leveraged for underwriting.
By Application:
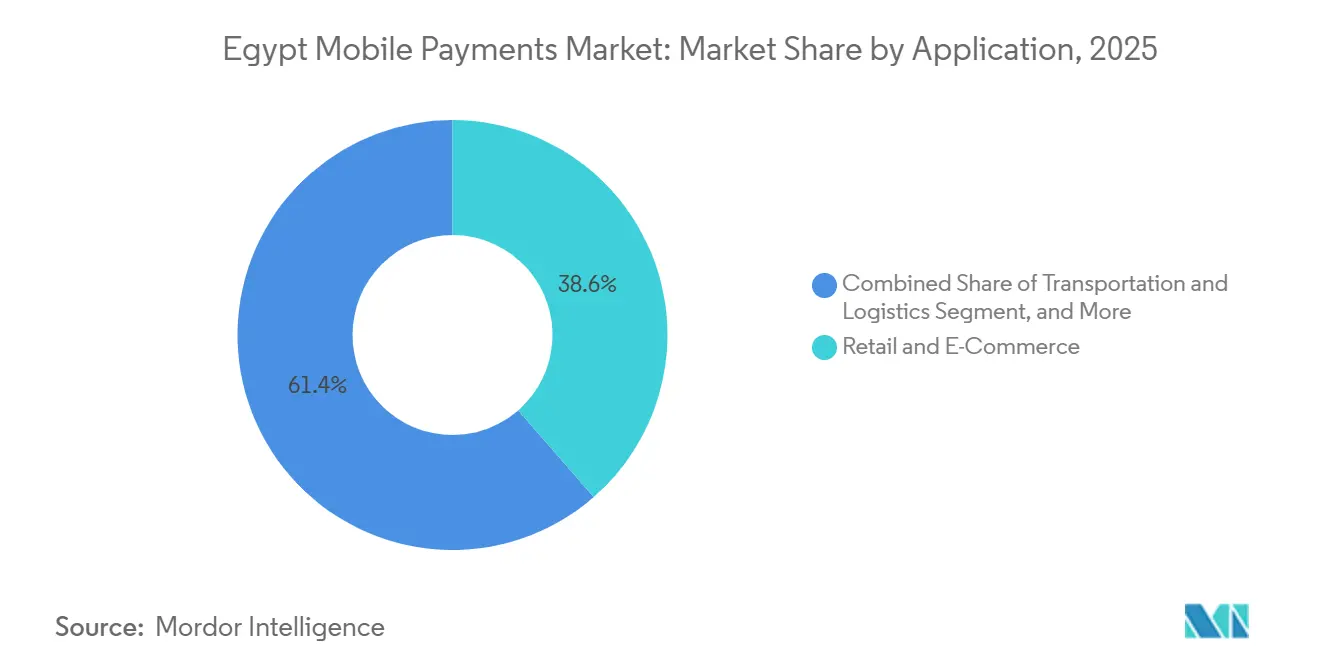
Transportation and Logistics Lead Sector-Specific CAGRRetail and E-Commerce cornered 38.59% of the Egypt mobile payments market size in 2025, yet Transportation and Logistics are forecast to expand at an 11.56% CAGR to 2031. Cairo Metro activated contactless gates on Lines 1 and 2 in December 2025, and National Bank of Egypt allied with Mastercard and Mwasalat Misr to roll out tap-to-pay on intercity buses, catalyzing rapid ridership adoption. Ride-hailing super-apps such as Careem integrate wallet transfers, embedding payments deep into daily commutes.
Hospitality and food service gain from surging online ordering and a growing tourism pipeline that aims for 30 million visitors by 2028. Contactless and QR payment options reduce foreign-exchange hassles for travelers, stimulating merchant upgrades at Red Sea resorts. In healthcare, Valu’s partnership with Vezeeta and Geidea opens installment plans for medical consultations, expanding wallet relevance into essential services. Education, agriculture, and government disbursements round out a long tail of emerging verticals that will collectively push transaction diversity higher over the forecast horizon.

Geography Analysis
Wallet uptake concentrates in Greater Cairo, Alexandria, and Giza, where smartphone penetration tops 85%, merchant density is high, and soft POS coverage widens daily. Orange Cash reported 46.3 million active wallets by mid-2025 and EGP 943.4 billion (USD 20.3 billion) in quarterly throughput, attesting to urban scale. Fawry’s 382,000-strong agent network bridges physical-digital gaps, operating kiosks, post-office counters, and mobile vans in secondary cities and rural townships.
Remittance-heavy governorates in Upper Egypt receive immediate liquidity via GCC wallet-to-wallet transfers that now settle in minutes and cost under 3%, versus multi-hour cash pickups before digitization. World Bank pilots added 250,000 new accounts and lifted women’s remittance transactions by 13%, a material boost to inclusive finance. Tourism clusters along the Red Sea, Luxor, and Aswan adopt contactless acceptance to meet visitor expectations, and hotel lobby shops increasingly print bilingual QR codes linked to InstaPay.
Rural adoption trails due to patchy internet, limited digital literacy, and entrenched cash habits. Telecoms are extending 4G and 5G coverage, but electricity reliability and device affordability continue to hamper consistent wallet usage. Government plans for digital IDs and e-health cards promise new payment touchpoints that could catalyze uptake outside urban cores. Until then, agent networks will remain indispensable for cash-in and cash-out, albeit at higher operating cost.
Regulatory Landscape
The Central Bank of Egypt (CBE) regulates payment gateways, e-money and mobile wallets, and the wider payments infrastructure under Banking Law No. 194 of 2020. In March 2024, the CBE issued its Payment Systems and Services Oversight Policy, which forms the basis for subsequent supervisory requirements for operators across rails such as InstaPay and wallet-linked acceptance.
In June 2025, the CBE issued licensing and registration rules for Payment System Operators (PSOs) and Payment Service Providers (PSPs), moving the market toward a more formal, supervised model with defined entry and operating requirements, including a transition window that runs through June 2026 for existing players to regularize. The compliance environment is reinforced by Egypt's digital trust framework, including the Anti-Cybercrime Law No. 175 of 2018 and the Personal Data Protection Law No. 151 of 2020. A February 2026 CBE rollout for contactless acceptance through smart devices (Soft POS) also expands the compliant acceptance perimeter beyond traditional POS hardware.
Value Chain Analysis
Egypt's mobile payments value chain covers account and identity provisioning (banks, telecom operators, and agent networks), payment rails and schemes (InstaPay for A2A instant transfers and the domestic Meeza scheme), acceptance enablement (PSPs/acquirers, aggregators, QR distribution, and Soft POS), and front-end experiences (telecom wallets, bank apps, and merchant apps). On the demand side, large billers, e-commerce platforms, ride-hailing and transit operators, and SMB merchants generate transaction volume, while cash-in/cash-out agents remain important for onboarding and liquidity management outside major cities.
In practice, enablers and bottlenecks are shifting toward compliance, acceptance economics, and device capability rather than pure connectivity. The CBE's tokenization launch in December 2024, conducted with Visa, Mastercard, and Meeza, strengthened NFC and in-app credentialing. The June 2025 PSO/PSP licensing framework also professionalized risk, governance, and operational controls across processors and operators. Merchant-side distribution still depends on large acquirers and aggregators that can deploy QR at scale and integrate settlement over InstaPay, while parallel moves toward embedded finance for trade flows, such as supply-chain collection tools offered by Fawry, connect payment acceptance to inventory, reconciliation, and working-capital cycles alongside B2B commerce ecosystems like Cartona and MaxAB.
Competitive Landscape
No single provider dominates the Egypt mobile payments market, reflecting CBE-mandated interoperability and diverse use-case coverage. Vodafone Cash, Orange Cash, and Etisalat Cash exploit subscriber scale and airtime distribution, yet none climb past a 15% transaction share. Bank-affiliated apps from Commercial International Bank, National Bank of Egypt, and Banque Misr protect deposit bases while partnering with tokenization platforms for NFC capability.
Fawry pivots from bill-payment aggregator to full-stack fintech, fielding BNPL, merchant acquiring, and remittance corridors, backed by 6 million daily transactions and 52.9 million monthly users. Fintech challengers attack niche pain points: Paymob furnishes 50-plus payment methods to 390,000 merchants, Telda issues customizable prepaid cards for Gen Z, and MoneyFellows scales a digital ROSCA model that accumulated USD 1.5 billion in circulation value.
Strategic moves focus on ecosystem depth rather than rail exclusivity. Vodafone Cash’s GCC remittance service, Orange Cash’s gold-trading in-app feature, and Fawry’s Apple Pay tie-up illustrate vertical expansion to entrench users. Generative-AI fraud analytics, such as Network International’s deployment with Abu Dhabi Commercial Bank Egypt, seek efficiency gains and trust enhancement. With margins compressed by capped fees, providers differentiate through credit, savings, and investment add-ons that monetize stored value and data exhaust.
Egypt Mobile Payments Industry Leaders
-
Paypal Holdings Inc.
-
Samsung Corporation
-
Apple Inc
-
Google LLC (Alphabet Inc.)
-
Amazon.com Inc
- *Disclaimer: Major Players sorted in no particular order
Egypt Mobile Payments Market Companies Covered in this Report
- Fawry for Banking and Payment Technology Services S.A.E.
- Vodafone Egypt Telecommunications S.A.E. (Vodafone Cash)
- Orange Egypt for Telecommunications S.A.E. (Orange Cash)
- Etisalat Egypt by eand (Etisalat Cash)
- Commercial International Bank of Egypt S.A.E. (CIB Smart Wallet)
- National Bank of Egypt Phone Cash
- Banque Misr BM Wallet
- Paymob Solutions LLC
- Amazon Payments, Inc. (Payfort Egypt)
- PayTabs Egypt for Payment Services LLC
- Invygo Technologies (Halan Super-App)
- Apple Inc. (Apple Pay)
- Alphabet Inc. (Google Wallet)
- Samsung Electronics Co., Ltd. (Samsung Pay)
- Mastercard Inc. (Masterpass Egypt)
- Visa Inc. (Click to Pay Egypt)
- Thunes B.V. (Thunes Cross-Border Wallet Transfers)
- MoneyFellows Ltd.
- Telda Financial Services Ltd.
- e-finance for Digital and Financial Investments S.A.E.
Market Opportunities and Future Outlook
Low-cost merchant acceptance remains a key whitespace, particularly among micro-merchants and delivery-led businesses that have historically avoided dedicated POS hardware. The CBE's contactless acceptance rollout through smart devices in February 2026, alongside the existing QR acceptance push, creates an addressable upgrade cycle for PSPs and software vendors that can package compliant Soft POS, onboarding, and reconciliation into a single Android-first flow.
Tokenization and scheme interoperability also create room for premium use cases that monetize security and convenience beyond transaction pricing alone. The CBE-enabled card tokenization phase launched in December 2024 (integrating Visa, Mastercard, and Meeza), along with subsequent bank enablement activity around Apple Pay tokenization, broadens the footprint for NFC and in-app payments. This supports transit, hospitality, and higher-ticket retail scenarios where speed and fraud controls matter. In parallel, the June 2025 PSO/PSP licensing regime, with a transition running through June 2026, increases demand for compliant processing, monitoring, and fraud/KYC tooling, which benefits scaled incumbents and specialized vendors serving smaller PSPs, agent networks, and merchants that need to upgrade controls without slowing onboarding.
Recent Industry Developments in Egypt Mobile Payments Market
- July 2026: Vodafone Egypt announced a partnership with Banque Misr to expand Vodafone Cash e-wallet services and widen access to digital financial services. The move strengthens bank-telco distribution in wallets and supports deeper integration of wallet use cases into mainstream banking rails.
- March 2026: Network International expanded card tokenization enablement for Apple Pay in Egypt by supporting additional major banks under the CBE-authorized tokenization framework. Broader tokenization coverage increases the addressable base for NFC mobile payments and supports higher-frequency tap-to-pay usage where contactless acceptance is available.
- December 2024: The Central Bank of Egypt enabled the first phase of payment card tokenization on mobile applications and activated Apple Pay with integration across Visa, Mastercard, and the Meeza scheme. This established a regulatory and technical foundation for secure NFC payments and accelerated bank and wallet roadmap alignment around tokenized credentials.
Egypt Mobile Payments Market Report Scope and Research Methodology
Market Definition and Coverage
For this study, the Egypt mobile payment market is defined as the value of payments and money transfers initiated through a mobile device and completed through digital rails, including wallet and app based transactions used at merchants or online, and person-to-person transfers.
Scope exclusions: We exclude cash-on-delivery, card-only payments that are not initiated through a mobile interface, and non-payment mobile banking activities that do not result in a transaction value.
Segments Covered in This Report
- By Mode of Payment
- Point of Sales
- Online Sales
- By Payment Type
- NFC
- QR-Based
- Other Payment Types
- By Transaction Type
- Peer-to-Peer (P2P)
- Person to Business
- By Application
- Retail and e-Commerce
- Transportation and Logistics
- Hospitality and Food-Service
- Government and Public Sector
- Other Applications (Education, Healthcare)
Data Sources, Market Sizing, and Validation
Desk Research
Desk research started with building a clean view of Egypt payments rails and adoption, since public sources typically report in local currency and often focus on wallets or instant payments separately. We referred to official publications such as Central Bank of Egypt releases, National Telecommunications Regulatory Authority updates, CAPMAS statistical releases, and Ministry of Communications and Information Technology programs to understand regulated payment flows and policy triggers.
To validate demand signals, we also used sources such as telecom and bank annual reports, investor presentations, and audited financial statements, followed by reputable press coverage and payments association or scheme announcements (for example around QR acceptance and interoperability). Where company level disclosures were limited, we used paid subscriptions focused on company financials and intelligence, news and financials, and patent databases to cross-check timelines and product launches. The desk sources mentioned above are illustrative, and we also used additional public documents and datasets for data collection, validation, and clarification.
Primary Interviews and Surveys
Primary work was used to sanity-check what desk sources cannot fully standardize, such as how much transaction value sits in POS versus online, and how quickly QR and NFC are being adopted by merchant categories. We spoke with a mix of payment enablers, banks and wallet ecosystem participants, merchants, and sector specialists across Egypt, and the inputs were then used to calibrate assumptions on transaction mix, fee caps, and year-by-year adoption pace.
Distribution of primary research fieldwork respondents
| Company type | Respondent position |
|---|---|
| Top tier: 29% | CXOs: 16% |
| Mid tier: 49% | Functional/Unit leaders: 33% |
| Smaller Players: 22% | Managers: 51% |
Market-Sizing & Forecasting
Market sizing used a top-down and bottom-up blend, where the starting point was to reconstruct a national mobile payment value pool using reported transaction value series, payment rail adoption, and channel split indicators, and then align it to the market boundary. Once the total was shaped, selective bottom-up checks were applied, such as sampled merchant category volumes multiplied by typical ticket sizes, and a light roll-up of disclosed transaction value from visible ecosystem participants where reporting is available.
A few practical inputs helped keep the model grounded, including active wallet and account trends, share of transactions routed through POS versus online, QR acceptance expansion, the pace of instant payment rail usage, and inflation driven ticket-size movement that changes transaction value even when volumes are stable. When a bottom-up proxy was missing for a segment (for example, informal micro-merchants), we filled gaps using penetration assumptions anchored in field feedback and then tested the output against independent adoption markers.
For forecasting, we used scenario analysis supported by short-run time series smoothing to avoid overstating inflection points. The forward view was mainly driven by expected changes in QR and NFC usage, merchant onboarding speed, interoperability improvements, and regulatory actions that shift pricing and consumer behavior, which were reviewed and adjusted based on expert consensus.
Data Validation & Update Cycle
Validation was done through triangulation across independent signals, so the modeled totals were checked against transaction value disclosures, adoption metrics, and channel indicators, before being finalized. Outliers were flagged when growth rates or channel shares moved beyond what policy changes, merchant onboarding, or macro conditions could reasonably explain, and those cases were sent back for an extra analyst review.
If a mismatch stayed after internal checks, follow-up outreach was triggered with relevant experts to re-check the assumption that caused the variance. The report is refreshed on an annual cycle, with interim updates when material events occur, and a final pre-delivery sweep is completed so clients receive the latest market view available at the time.
Mordor Intelligence's Egypt Mobile Payment Market Size Compared With Other Published Estimates
Published market sizes for Egypt mobile payments can vary quite a bit, even when they look like they cover the same topic. The differences usually come from where each study draws the boundary between mobile initiated payments, broader digital payments, and adjacent services that are bundled into a single number.
By tracking transaction value series by channel and payment type and refreshing currency conversion timing, Mordor Intelligence keeps the estimate aligned to mobile initiated payment value in Egypt, rather than mixing in non-mobile digital flows or unrelated fintech revenue lines. Variance also comes from whether a study counts only wallet payments or also includes bank app transfers, how it treats QR versus NFC adoption in merchant payments, and whether fee caps and inflation are handled as separate effects on value growth.
Benchmark comparison
| Source | Market Size | Gaps in Research Methodology |
|---|---|---|
| Mordor Intelligence | USD 84.93 B (2025) | |
| Trade Journal A | USD 80.00 B (2025) | Often stated as a rounded milestone and may lean on headline wallet activity without a clear split between POS, online, and bank-app initiated transfers, which can undercount parts of the addressable mobile payment value. |
| Regional Consultancy B | USD 87.40 B (2025) | Tends to use a broader digital payments framing and can blend mobile payments with nearby categories and aggressive adoption steps, which may lift the value above a tighter mobile initiated definition. |
The spread in the table is mainly explained by scope choices and how transaction value is reconstructed when public reporting is partial. Our approach stays repeatable because each assumption is tied back to observable payment rails, channel mix, and adoption signals, and then re-checked through field inputs before finalizing the total.
Key Questions Answered in the Report
How large will the Egypt mobile payments market be by 2031?
It is forecast to reach USD 137.18 billion, expanding at an 8.23% CAGR from 2026 to 2031.
Which payment channel is growing fastest?
Point of Sales transactions are projected to rise at a 9.12% CAGR thanks to the nationwide QR-code mandate.
Why is NFC adoption still limited in Egypt?
Legacy terminals lack contactless readers, and many small merchants favor low-cost QR stickers over hardware upgrades.
What segments benefit most from BNPL integration?
Retail, e-commerce, and increasingly healthcare see larger basket sizes and higher conversion when BNPL appears inside wallet checkout.
How are remittances affecting mobile payment volumes?
GCC wallet-to-wallet transfers now settle instantly at fees below 3%, boosting liquidity for households and driving wallet activity in Upper Egypt.
Which firms stand out in fraud mitigation?
Abu Dhabi Commercial Bank Egypt and Network International are early adopters of generative-AI analytics that cut charge-back rates.