
Market Overview
| Study Period | 2020 - 2031 |
|---|---|
| Forecast Data Period | 2026 - 2031 |
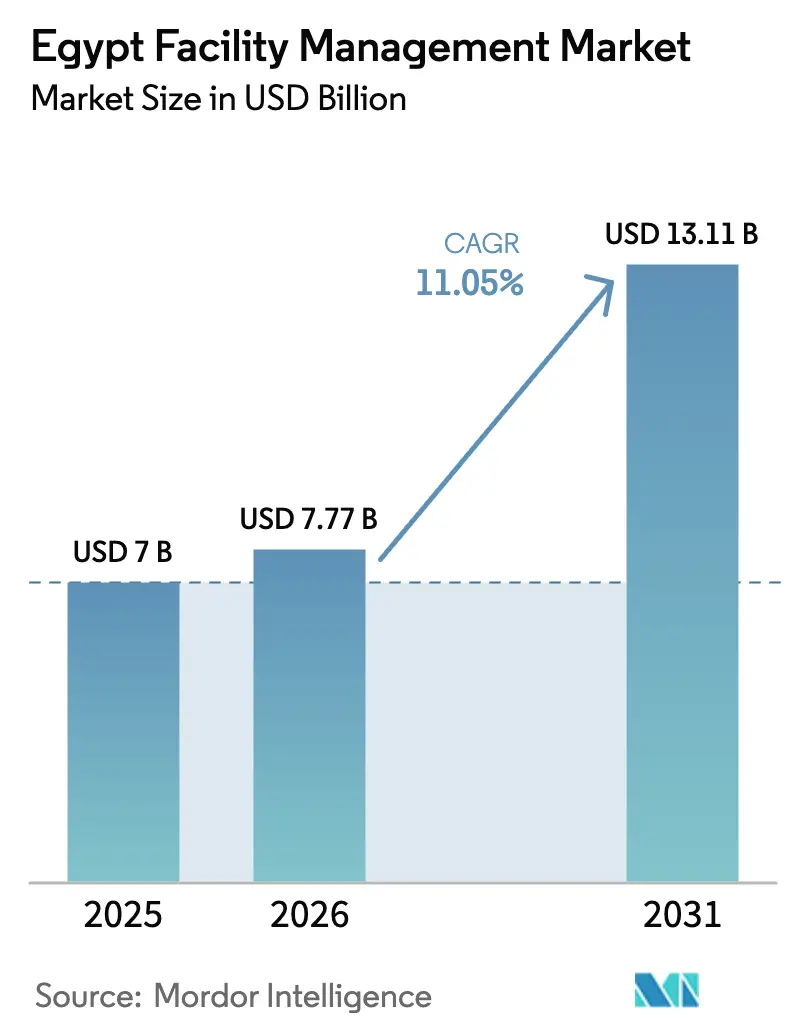
| Base Year Market Size (2025) | USD 7 Billion |
| Market Size (2026) | USD 7.77 Billion |
| Market Size (2031) | USD 13.11 Billion |
| Growth Rate (2026 - 2031) | 11.05% CAGR |
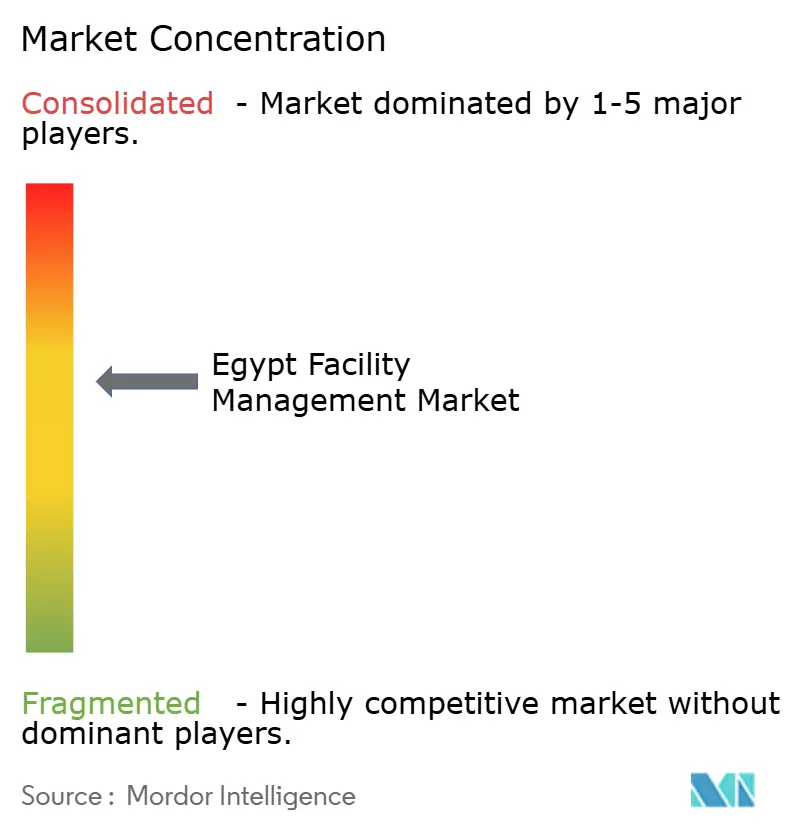
| Market Concentration | Medium |
Major Players *Disclaimer: Major Players sorted in no particular order Image © Mordor Intelligence. Reuse requires attribution under CC BY 4.0. | |
Egypt Facility Management Market Analysis by Mordor Intelligence
Egypt Facility Management Market size market size in 2026 is estimated at USD 7.77 billion, growing from 2025 value of USD 7 billion with 2031 projections showing USD 13.11 billion, growing at 11.05% CAGR over 2026-2031. Robust urbanization, led by 30 designated fourth-generation cities such as New Mansoura, is expanding the addressable base of commercial, residential, and public assets that require professional upkeep. Government-backed infrastructure outlays, private-sector capital inflows equal to 63.5% of total investment, and declining unemployment to 6.5% are reinforcing spending on outsourced building services. Widespread technology adoption—ranging from AI-enabled security analytics to IoT-based energy management—allows operators to lift service quality while protecting margins. [1]Giza Systems, “About,” gizasystems.com Meanwhile, material‐cost inflation and regulatory upgrades, notably Labour Law No. 14 of 2025, add compliance complexity and cost pass-through pressure. Net effect: the Egypt facility management market is pivoting from basic maintenance to integrated, tech-rich solutions that can scale with the country’s rapidly modernizing infrastructure.
Key Report Takeaways
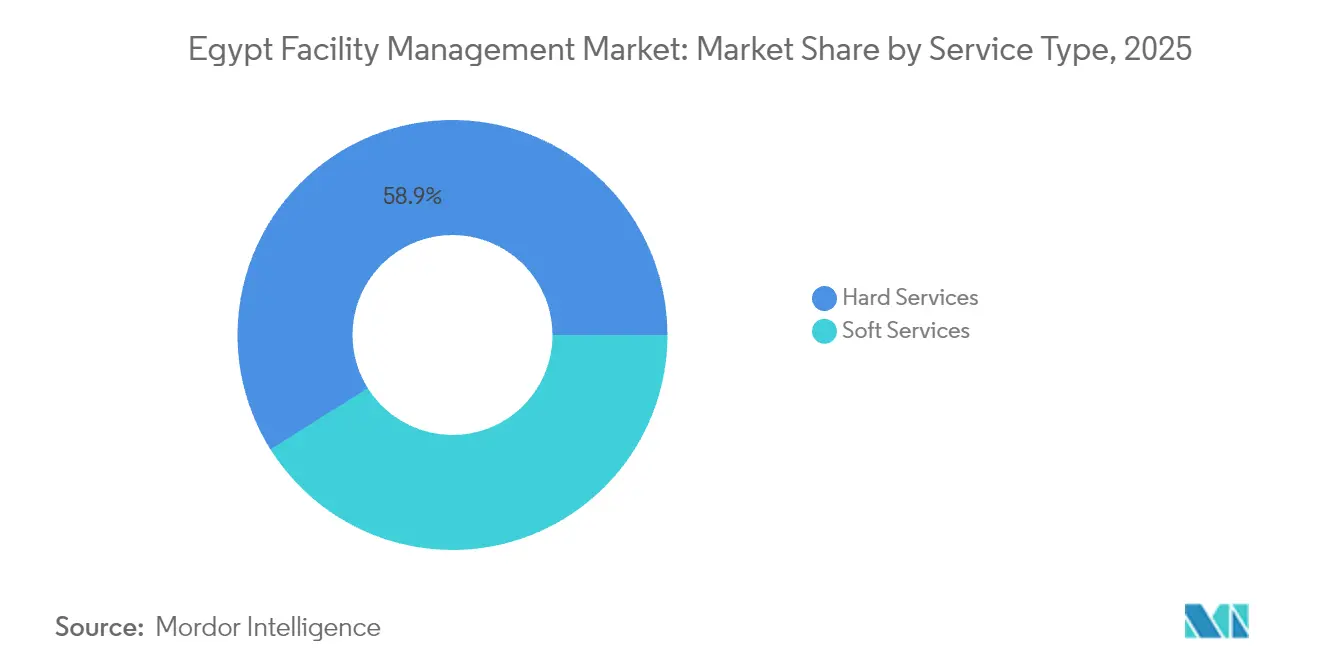
- By service type, hard services held 58.92% of the Egypt facility management market share in 2025, while soft services are projected to expand at a 13.27% CAGR to 2031.
- By offering type, the outsourced model commanded a 67.85% share of the Egypt facility management market size in 2025 and is advancing at a 12.74% CAGR through 2031.
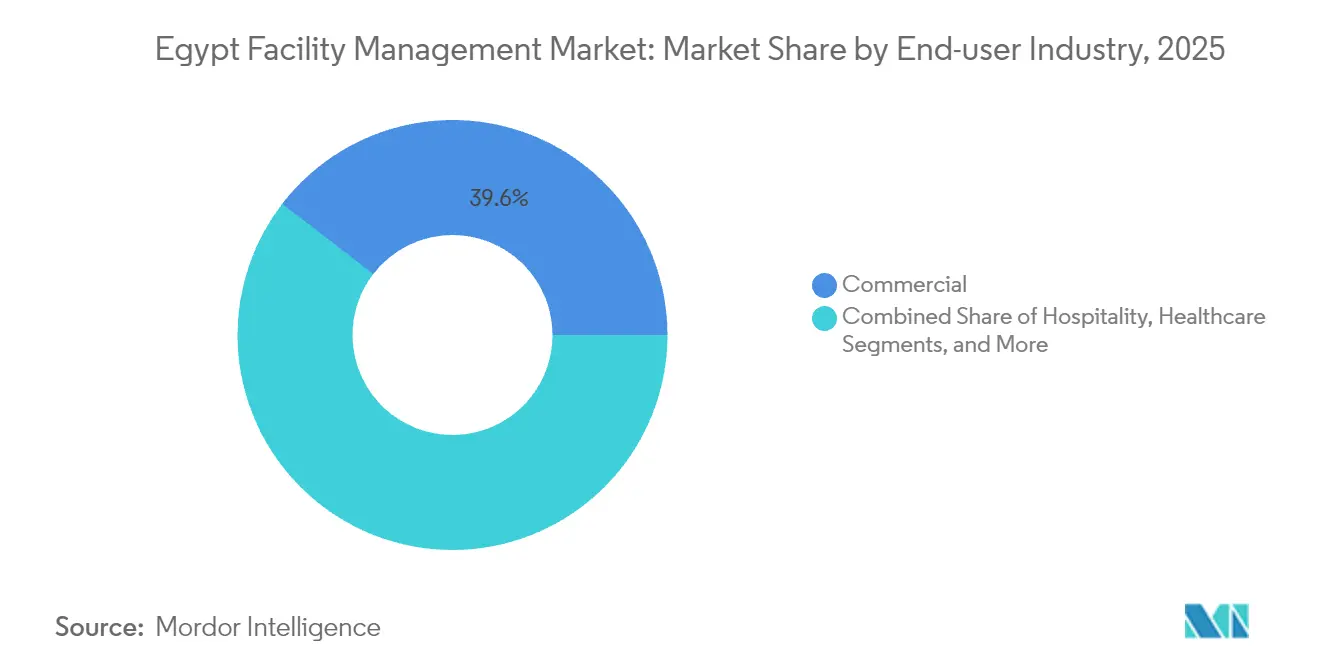
- By end-user industry, commercial facilities led with 39.55% revenue share in 2025; industrial and process sites are forecast to grow at a 13.48% CAGR to 2031.
Note: Market size and forecast figures in this report are generated using Mordor Intelligence’s proprietary estimation framework, updated with the latest available data and insights as of 2026.
Egypt Facility Management Market Trends and Insights
Drivers Impact Analysis*
| Driver | (~) % Impact on CAGR Forecast | Geographic Relevance | Impact Timeline |
|---|---|---|---|
| Current occupancy rates | +2.1% | Greater Cairo, Alexandria, New Administrative Capital | Medium term (2-4 years) |
| Profitability rates of major FM players | +1.8% | National, with concentration in urban centers | Short term (≤ 2 years) |
| Workforce indicators – labor participation | +1.5% | National, with emphasis on skilled labor hubs | Long term (≥ 4 years) |
| Urbanization and population growth | +2.3% | Greater Cairo, New Cities, Coastal regions | Long term (≥ 4 years) |
| Sector investment priorities in infrastructure | +2.0% | National, focused on smart cities and industrial zones | Medium term (2-4 years) |
| Regulatory drivers on labor and safety standards | +1.2% | National compliance requirements | Short term (≤ 2 years) |
| Source: Mordor Intelligence | |||


Current Occupancy Rates Drive Market Expansion
Higher occupancy in landmark projects such as Madinaty—home to 600,000 residents across 8,000 acres—immediately translates into recurring hard and soft-service needs. The New Administrative Capital alone involves 19,500 housing units, four universities, and multiple ministries, all requiring 24/7 facilities support. Healthcare expansions, exemplified by Alameda’s USD 125 million multi-hospital program, further widen the demand base. Mixed-use mega-developments financed by Gulf investors add layers of retail and hospitality space that need integrated cleaning, security, and energy services. The relationship between occupancy and contract volume is therefore poised to remain tightly coupled over the medium term.
Profitability Optimization Through Technology Integration
FM operators are embedding IoT sensors in HVAC, lighting, and water systems to shift from schedule-based to condition-based maintenance, trimming downtime and labor hours. Studies show that AI-assisted fault detection can cut energy waste by up to 883.2 kWh over 24 hours when a sensor fails, underscoring the payback potential of digital retrofits. [2]IoT 5 Journal, “IoT Integration of Failsafe Smart Building Management System,” mdpi.com Giza Systems’ 3,000-strong integration team now offers end-to-end smart-building solutions spanning analytics dashboards and mobile work-order apps. Elsewedy Electric has earmarked EGP 250 million for sustainability programmes, positioning itself to capture contracts that prioritize carbon efficiency. As clients seek cost savings without sacrificing service levels, providers that master data-driven workflows are improving bid-win rates and margins.
Urbanization Accelerates Infrastructure Demand
Egypt plans to build 38 smart cities at a cumulative infrastructure cost of USD 675 billion over 20 years. The national climate strategy targets 42% renewable-energy generation by 2035, spawning solar parks and wind farms that require specialized asset care. Pilot projects such as New Qena showcase digital twins and intelligent traffic systems, elevating expectations for FM providers to manage both physical and cyber assets. Research on smart-energy adoption finds a 62.9% success rate in sustainability targets when advanced controls are deployed, reinforcing the business case for green FM services. Growing urban density also brings economies of scale that favour integrated outsourcing models.
Infrastructure Investment Priorities Shape Market Direction
Flagship schemes like the USD 35 billion Ras El-Hekma coastal development, Elsewedy-built industrial zones, and Saudi PIF’s USD 5 billion equity pledge are funneling capital into logistics, petrochemicals, and mixed-use precincts. Honeywell’s automation tie-up for the Anchor Benitoite complex in the Suez Canal Economic Zone signals demand for advanced building-control expertise. Government policy that channels 50% of public spending into green projects by FY 2025 is sharpening the focus on LEED-compliant operations and lifecycle energy cost savings. Collectively, the pipeline gives FM providers multi-year visibility on contract flow, enabling strategic investment in talent and technology.
Restraints Impact Analysis*
| Restraint | (~) % Impact on CAGR Forecast | Geographic Relevance | Impact Timeline |
|---|---|---|---|
| Regulatory and legislative framework hurdles | -1.4% | National, with varying regional implementation | Medium term (2-4 years) |
| Macroeconomic volatility | -1.8% | National, with greater impact on import-dependent sectors | Short term (≤ 2 years) |
| Shortage of skilled FM workforce and high turnover | -1.6% | National, acute in specialized technical roles | Long term (≥ 4 years) |
| Delays in public-sector payment cycles | -1.1% | Government-dependent projects nationwide | Short term (≤ 2 years) |
| Source: Mordor Intelligence | |||
Regulatory Framework Complexity Constrains Market Growth
Labour Law No. 14 of 2025 introduces remote-work provisions and labour courts, but compliance costs rise as firms adapt HR systems and reporting lines. Environmental law No. 4/1994 imposes stricter waste-handling standards, prompting FM operators to invest in certified disposal partners and liability insurance. The Egyptian Insurance Federation has created a sector-wide pool to underwrite environmental risks, a sign that regulatory exposure is now material to project pricing. Hotel registration rules further add licensing steps for providers servicing tourism clients. Until new guidelines settle, bid timelines lengthen, and smaller vendors face higher entry barriers.
Macroeconomic Volatility Impacts Investment Decisions
The March 2024 currency float triggered FX swings that complicate budgeting for imported HVAC units and fire-safety hardware. Steel and cement inputs—already underutilized at 50% of national capacity—have seen 10-30% price jumps, leading contractors to insert escalation clauses in FM agreements. Academic work on contract price adjustment shows that projects lacking index-based formulas are suffering cost overruns, eroding provider profitability. Cash-flow tension intensifies when public clients delay payments, forcing vendors to rely on short-term bank facilities. Larger integrators with stronger balance sheets are therefore better equipped to weather volatility.
*Our forecasts treat driver/restraint impacts as directional, not additive. The impact forecasts reflect baseline growth, mix effects, and variable interactions.
Segment Analysis
By Service Type: Soft-Service Digitization Outpaces Technical Core
Hard services captured 58.92% of Egypt's facility management market share in 2025, underscoring the structural need for MEP, HVAC, fire safety, and asset management across the country’s USD 515 billion unawarded project backlog. Soft services, however, are on track for a 13.27% CAGR through 2031 on rising demand for technology-enabled cleaning, security, and office-support packages that enhance occupant experience. AI-driven waste-segregation systems illustrate how FM firms can cut landfill volumes and waste-hauling costs while meeting new ESG metrics. Research on HVAC Maintenance 4.0 confirms that AI and IoT can lift energy efficiency and occupant comfort simultaneously, suggesting that premium soft-service bundles will keep expanding. Hard-service providers are also evolving: smart fire-safety panels and predictive-maintenance software are becoming standard in tender documents, increasing demand for multidisciplinary technicians. The convergence of smart-building requirements ensures that both service categories will remain interdependent, but growth momentum tilts toward digitally infused soft-service lines.


By Offering Type: Outsourcing Consolidates Around Integrated Contracts
Outsourced delivery models accounted for 67.85% of the Egypt facility management market size in 2025 and are projected to compound at 12.74% annually to 2031. Corporates in banking, telecom, and retail are divesting non-core activities, driving multi-site integrated FM deals that bundle security, energy management, and vendor-managed inventory. Hassan Allam’s YANMU logistics joint venture and Contrack FM’s Middle East footprint exemplify the shift to platform providers with nationwide reach. Single-service or bundled-service contracts persist in public hospitals and sensitive government facilities where control considerations keep some tasks in-house. Yet incremental privatization—authorities target a 50% private-sector share of total investment by FY 2025—suggests outsourced penetration will keep rising. Technology integration, unified command centers, and performance-based SLAs make integrated outsourcing the benchmark for value-conscious clients.
By End-user Industry: Industrial Facilities Lead Growth Curve
Commercial properties, including IT parks, malls, and warehouses, delivered 39.55% of 2025 revenue, benefiting from continuous office expansions in Greater Cairo and the North Coast. The industrial and process segment is expected to post the fastest 13.48% CAGR, propelled by new petrochemical complexes, renewable-energy farms, and export-oriented manufacturing clusters along the Suez Canal. Healthcare operators such as Cleopatra Hospitals Group deploy 360-degree service models that integrate clinical engineering, soft cleaning, and waste-tracking modules, illustrating a pivot to outsourced expertise. Hospitality FM gains traction as Gulf investors refurbish historic hotels; ADQ’s portfolio revamp is already generating demand for heritage-asset maintenance protocols. Multi-housing, leisure, and sports arenas also add volume, but the industrial base offers the most pronounced uplift in contract value and technical depth.
Geography Analysis
Greater Cairo and Alexandria collectively generate the lion’s share of Egypt's facility management market contracts due to dense commercial stock and ongoing civic investments. The New Administrative Capital, supported by EGP 24 billion in phase-one funding, is emerging as the single largest greenfield cluster of government, residential, and mixed-use assets in the country. Alexandria’s petrochemical belt and maritime terminals draw specialized hard-service teams skilled in hazardous-area maintenance. Beyond these hubs, Upper Egypt’s New Qena smart-city prototype highlights the diffusion of digital-ready infrastructure southward. The Suez Canal Economic Zone is attracting automation-intensive factories, while the North Coast’s Ras El-Hekma mega-scheme widens tourism-driven FM demand across 40,600 feddans. Industrial zones developed by Elsewedy Industrial Development provide turnkey ecosystems for engineering, textiles, and logistics, necessitating integrated facility services across multiple governorates. Overall, spatial demand is broadening from traditional metro cores toward a network of smart, industrial, and coastal corridors.
Regulatory Landscape
Egypts facility management (FM) activities are governed largely through cross-cutting labor, environmental, building, and sector regulations rather than a single FM-specific law. Labour Law No. 14 of 2025 increased employer compliance requirements around workforce administration and dispute resolution, while Environmental Law No. 4/1994 continues to anchor waste handling and environmental risk controls, influencing procurement of certified disposal partners and insurance coverage for FM contracts.
For technology-led FM (IoT-enabled BMS, connected security, and smart-building analytics), licensing and standards compliance add another layer of oversight. The National Telecommunications Regulatory Authority (NTRA), operating under Telecommunications Law No. 10 of 2003, regulates telecom services and associated licensing structures that affect connectivity-dependent FM deployments (for example, IoT connectivity and data-driven operations). Technical conformity for building automation and control systems is supported through the Egyptian General Organization for Standards and Quality (EOS), including standards aligned to building automation and control functions, which can be referenced in tenders for smart-city and large commercial assets.
Value Chain Analysis
The Egypt FM value chain starts with asset owners and developers (government entities, real estate developers, industrial operators, and institutions) defining SLAs and compliance requirements, then awarding contracts to in-house teams or outsourced providers (single, bundled, or integrated FM). Delivery relies on a service-operations layer of site teams and subcontractors (MEP, HVAC, fire safety, cleaning, security, waste), supported by OEMs and distributors for equipment and spares, and specialist third parties for inspections, certifications, and regulated waste disposal.
Digital infrastructure increasingly sits in the middle of execution, connecting assets, people, and workflows through CAFM/CMMS platforms, BMS/SCADA integrations, and cloud-hosted analytics. Government digitization programs provide a reference pathway for scaling data-driven operations, including MCIT-backed initiatives such as the State Assets Management System built on Hexagon M.App Enterprise to manage over 1.3 million state property assets, and the Cloud First Policy 2024 adopted by the Supreme Council of Digital Society. This shifts value toward integrators and platform-capable FM providers (for example, Apleona Egypt, Imdaad Misr, and local specialists such as Egypro FME and Prosper Egypt) that can combine field service delivery with connectivity, data governance, and sustainability reporting.
Competitive Landscape
The Egypt facility management market features moderate fragmentation: top local conglomerates coexist with regional specialists and international majors. Orascom Construction’s Contrack FM, Hassan Allam Holding, and G4S leverage scale to bid on transport, energy, and government projects. Regional players such as Enova and EFS focus on energy-performance contracts and data-center operations, respectively, while Savills and Imdaad target premium commercial towers. Competitive edge increasingly rests on integrated delivery, proven technology stacks, and certified sustainability frameworks rather than lowest-price offers. Partnerships are multiplying: Siemens Egypt aligns with Al-Attal Holding to embed metaverse-ready building systems in residential estates. White-space opportunities lie in healthcare FM—Egypt may need up to 120,000 new hospital beds by 2030, and renewable assets aligned with the 42% clean-energy target. Consolidation is likely as clients demand single-contract accountability across growing asset portfolios.
Egypt Facility Management Industry Leaders
Contrack FM (Orascom Construction PLC)
Enova Facilities Management Services LLC
EFS Facilities Services Group
Apleona IFMC (Apleona GmbH)
Egypro FME Joint Stock Company
- *Disclaimer: Major Players sorted in no particular order

Market Opportunities and Future Outlook
Smart-city and connected-infrastructure buildout is creating actionable whitespace for integrated FM offerings that blend hard services with always-on digital monitoring. Evidence includes Honeywells role as Master Systems Integrator for the New Administrative Capital (ACUD), where digital-twin enabled utility monitoring and SCADA-based controls raise the operating standard for critical infrastructure and elevate demand for FM teams that can maintain both physical assets and control systems.
Connectivity densification and compute capacity expansion support opportunities in mission-critical FM (data centers, network sites, and ICT-intensive buildings). The February 2026 spectrum allocation deal (USD 3.5 billion) and the 2025/2026 development-plan targets for ICT investments and network-tower expansion increase the installed base of technical assets that need high-availability maintenance, energy management, and compliance-led operations. On the supply side, providers can differentiate through energy-performance contracting and lifecycle cost reduction, supported by collaborations that integrate energy management and distributed generation into asset operations (for example, Enovas partnership with Schneider Electric for energy solutions and microgrids in its asset-management portfolio).
Recent Industry Developments
- June 2026: Contrack FM announced it was awarded the soft services management contract for SODIC EDNC in New Cairo. The win reinforces competitive intensity in large mixed-use developments where occupant experience and SLA execution drive renewals and contract extensions.
- November 2025: Red Sea International Airport selected Enova as its General Facilities Maintenance contractor, covering both hard and soft services. The award highlights the need for integrated FM capabilities in high-availability transport infrastructure where uptime, safety, and energy performance are tightly audited.
- July 2024: The first phase of New Mansoura smart city was inaugurated, adding 19,500 housing units and four universities. This expands the operational asset base that requires multi-site FM coverage across MEP maintenance, cleaning, security, and technology-enabled energy management.


Research Methodology Framework and Report Scope
Market Definition and Coverage
For this study, the Egypt facility management market is defined as revenues earned from managing, operating, and maintaining buildings and sites through hard services and soft services, delivered either in-house or through outsourced contracts across end users in Egypt.
Scope exclusions: We exclude one-off construction and major capex-led retrofit work that is not contracted as recurring facility management, along with pure equipment sales that are not tied to an FM service agreement.
Segmentation Overview
- By Service Type
- Hard Services
- Asset Management
- MEP and HVAC Services
- Fire Systems and Safety
- Other Hard FM Services
- Soft Services
- Office Support and Security
- Cleaning Services
- Catering Services
- Other Soft FM Services
- Hard Services
- By Offering Type
- In-house
- Outsourced
- Single FM
- Bundled FM
- Integrated FM
- By End-user Industry
- Commercial (IT and Telecom, Retail and Warehouses, etc.)
- Hospitality (Hotels, Eateries, Large-scale Restaurants)
- Institutional and Public Infrastructure (Govt, Education, Transportation)
- Healthcare (Public and Private Facilities)
- Industrial and Process (Manufacturing, Energy, Mining)
- Other End-user Industries (Multi-housing, Entertainment, Sports and Leisure)
Data Sources, Market Sizing, and Validation
Desk Research
Desk research was used to ground the demand pool and keep assumptions realistic for Egypt. We reviewed public sources such as CAPMAS publications, the Central Bank of Egypt releases, the Egyptian General Authority for Investment and Free Zones updates, and statistics from the Egyptian Electricity Holding Company and EgyptERA for utility and infrastructure context. We also referenced international sources such as World Bank indicators and UN Comtrade trade statistics, which helped explain how imported maintenance equipment trends can affect service intensity.
To connect macro signals to service revenues, we relied on company annual reports, investor presentations, and local press coverage that discusses outsourcing trends, public infrastructure activity, and large commercial developments. Where private company disclosure was limited, we used paid databases for company financials and news screening, then cross-checked the resulting ranges against contract and tender announcements that are publicly visible. The desk sources listed here are illustrative rather than exhaustive, and we also referred to other public documents for data collection, validation, and clarification.
Primary Interviews and Surveys
Primary work focused on validating what is actually billed in Egypt across hard FM and soft FM, and how contracts are priced and renewed in different facility types. We spoke with a mix of outsourced service providers, in-house facility heads, procurement teams, and ecosystem experts, and we used their inputs to tighten penetration assumptions, the split between bundled versus integrated contract shares, and typical price progression logic under local inflation and FX conditions.
Distribution of primary research fieldwork respondents
| Company type | Respondent position | Region |
|---|---|---|
| Top tier: 36% | CXOs: 13% | |
| Mid tier: 46% | Functional/Unit leaders: 37% | |
| Smaller Players: 18% | Managers: 50% |
Market-Sizing & Forecasting
The core model uses a top-down build that reconstructs FM spending from Egypt's active building base and service intensity, and then it is split by delivery type and offering type based on observed outsourcing behavior. In practice, we start from facility stock and activity signals by end user, apply outsourcing and contract coverage ratios, and then convert those volumes to value using realistic annual contract pricing, including bundled and integrated arrangements.
Several market fingerprints were tracked to keep the numbers anchored, such as construction completions and occupied commercial space additions, public infrastructure operations intensity, industrial activity and plant utilization signals, and the share shift from single service contracts into bundled and integrated FM. Pricing assumptions were kept simple and auditable through typical contract duration, renewal patterns, labor cost pressure, and imported input sensitivity where it changes hard-service costs. To corroborate totals, we also used selective bottom-up approximations, including sampled contract value ranges by facility type, channel checks on tendered FM packages, and a sanity roll-up from known provider footprints to identify coverage gaps.
Forecasts were built using scenario analysis supported by a light multivariate regression on stable drivers such as building additions, operating intensity by end user, and outsourcing penetration, then adjusted using expert views on renewal pricing and contract repricing frequency. When bottom-up evidence was missing for smaller cities or niche facilities, we applied conservative coverage factors and then rechecked the implied spend per square meter or per site before finalizing.
Data Validation & Update Cycle
Before sign-off, outputs are triangulated against independent signals such as tender flow direction, provider utilization commentary, and implied spend levels by facility type, then outliers are reviewed case by case. If a key assumption moves outside an interview-backed range, we re-contact sources to confirm whether the change is real or driven by timing, currency conversion, or contract scope mixing.
Each report is refreshed at least annually, and interim updates are triggered when major macro shifts, policy changes, or large outsourcing awards materially change the outlook. A final analyst pass is completed close to delivery so the tables reflect the latest available indicators and the newest validation feedback.
Mordor Intelligence's Egypt Facility Management Market Size Compared Against Other Published Estimates
Published market sizes for Egypt facility management often do not match because researchers are not always counting the same services, contract types, and pricing timelines. Differences also show up when one estimate leans more on macro building activity, while another leans more on reported company revenues or a narrow sample of outsourced contracts.
In this study, the spread is mainly driven by how frequently assumptions are refreshed and how currency timing is handled for multi-year contracts that get repriced at renewal. When price escalation is applied at different points in the year, and when in-house FM is either included or excluded, totals can shift quickly, which is why the refresh cadence and the FX conversion month are practical for Egypt. Those refresh and conversion checks are explicitly applied in Mordor Intelligence so the estimate stays tied to contract billing reality rather than headline growth signals alone.
Benchmark comparison
| Source | Market Size | Gaps in Research Methodology |
|---|---|---|
| Mordor Intelligence | USD 7.00 B (2025) | |
| Regional Consultancy A | USD 6.10 B (2025) | Uses a tighter outsourced-only boundary and typically excludes in-house FM budgets for institutions and public infrastructure, which reduces the counted spend pool in Egypt. |
| Trade Journal B | USD 8.40 B (2025) | Applies aggressive price uplift from recent inflation into the full-year average and blends some one-off maintenance and retrofit activity into FM, which lifts the implied average contract value. |
Taken together, the table suggests the biggest swing comes from boundary choices (in-house versus outsourced) and the way annual pricing is stepped up inside the base year. By keeping the scope tied to recurring FM services and using repeatable checks on contract repricing and implied spend levels, our final number remains practical to audit and update each year as conditions change in Egypt.


Key Questions Answered in the Report
What is the current size of the Egypt facility management market?
The Egypt facility management market size is USD 7.77 billion in 2026 and is projected to reach USD 13.11 billion by 2031.
Which service category is growing fastest?
Soft services—including cleaning, security and office support—are forecast to grow at a 13.27% CAGR through 2031, outperforming traditional hard services.
Why is outsourcing preferred over in-house FM in Egypt?
Organizations seek cost optimization and specialized expertise, leading outsourced models to hold 67.85% market share in 2025 with a 12.74% projected CAGR.
Which end-user segment offers the highest growth?
Industrial and process facilities—spanning petrochemicals, renewables and manufacturing—are expected to expand at a 13.48% CAGR between 2026 and 2031.
How do regulations affect facility management providers?
Labour and environmental laws increase compliance requirements and costs, prompting FM companies to invest in certified processes and liability insurance.
What technologies are most influential in Egypt’s FM market?
IoT sensors, AI-based analytics and integrated building-management platforms drive energy savings, predictive maintenance and higher service quality across assets.
Page last updated on:


