
Eco Fibers Market Size and Share
Market Overview
| Study Period | 2021 - 2031 |
|---|---|
| Market Size (2026) | USD 57.61 Billion |
| Market Size (2031) | USD 85.12 Billion |
| Growth Rate (2026 - 2031) | 8.12 % |
| Fastest Growing Market | Asia Pacific |
| Largest Market | Asia Pacific |
| Market Concentration | Medium |
Major Players *Disclaimer: Major Players sorted in no particular order Image © Mordor Intelligence. Reuse requires attribution under CC BY 4.0. | |
Eco Fibers Market Analysis by Mordor Intelligence
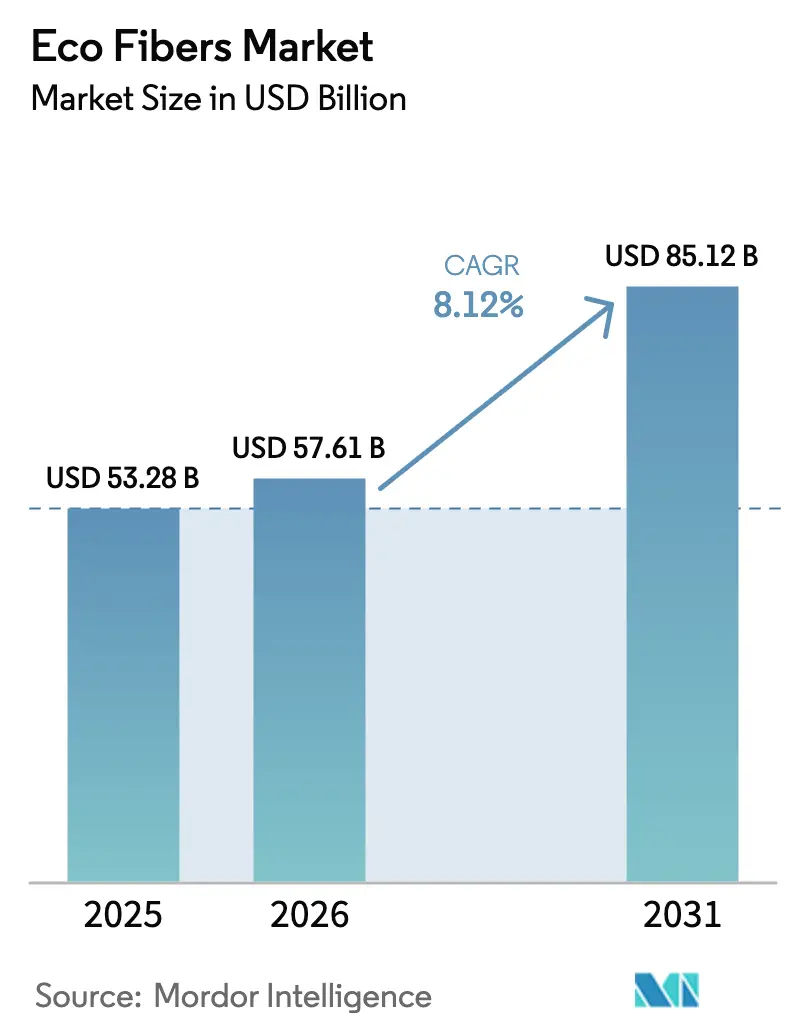
The Eco Fibers Market size is projected to expand from USD 53.28 billion in 2025 and USD 57.61 billion in 2026 to USD 85.12 billion by 2031, registering a CAGR of 8.12% between 2026 to 2031. Rapid policy shifts, notably the European Union’s Extended Producer Responsibility mandates, are redefining procurement models and turning recycled-fiber sourcing into a strategic rather than transactional activity. Fast-fashion groups have begun locking in multi-year supply agreements that guarantee recycled-fiber volumes and traceability, reducing feedstock-availability risk and supporting price stability. Process innovations in low-impact lyocell, expanding agricultural-residue feedstocks, and the commercialization of automated digital-passport systems are further widening adoption opportunities. At the same time, premium pricing for recycled polyester and cotton, along with imminent microfiber-shedding rules, threatens to moderate near-term penetration in price-sensitive segments. Competitive dynamics favor producers that integrate upstream biomass with downstream spinning facilities, a structural advantage most visible in Asia-Pacific, which already accounts for over half of global eco-fiber output.
Key Report Takeaways
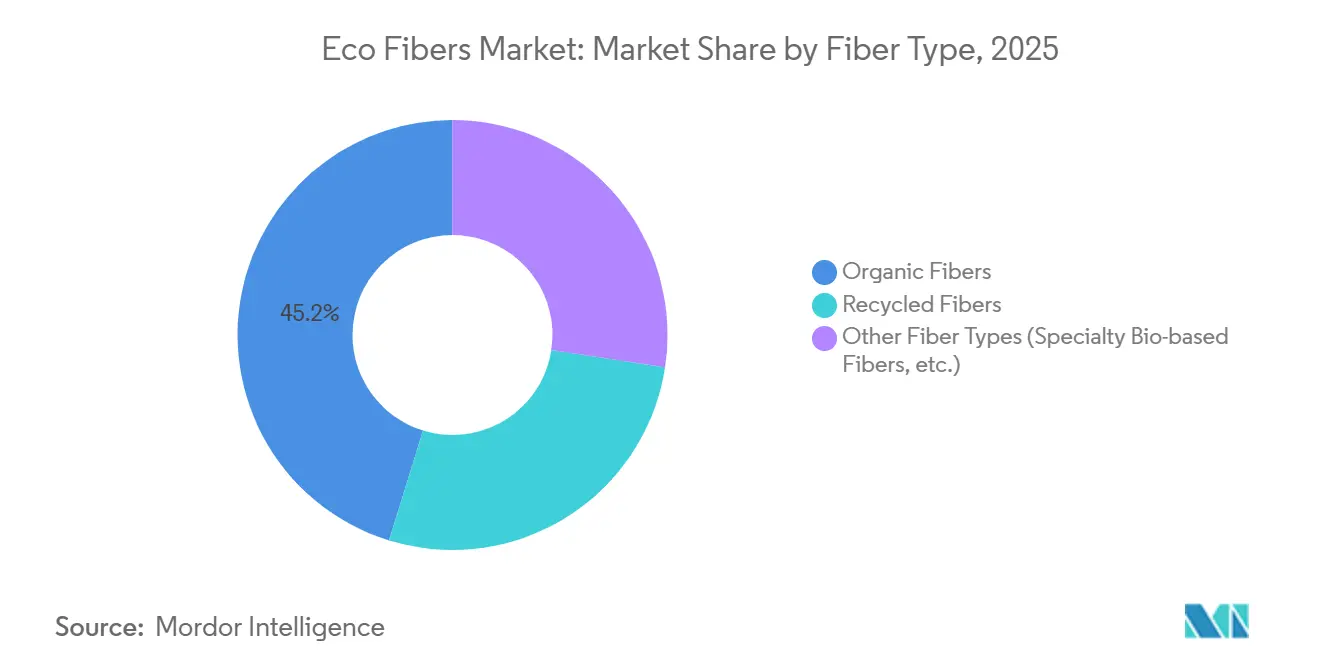
- By fiber type, organic fibers led with 45.22% of the eco fiber market share in 2025 and are projected to record the fastest 9.72% CAGR through 2031.
- By source feedstock, plant-based inputs captured 55.18% revenue share in 2025 and are forecast to expand at a 9.26% CAGR to 2031.
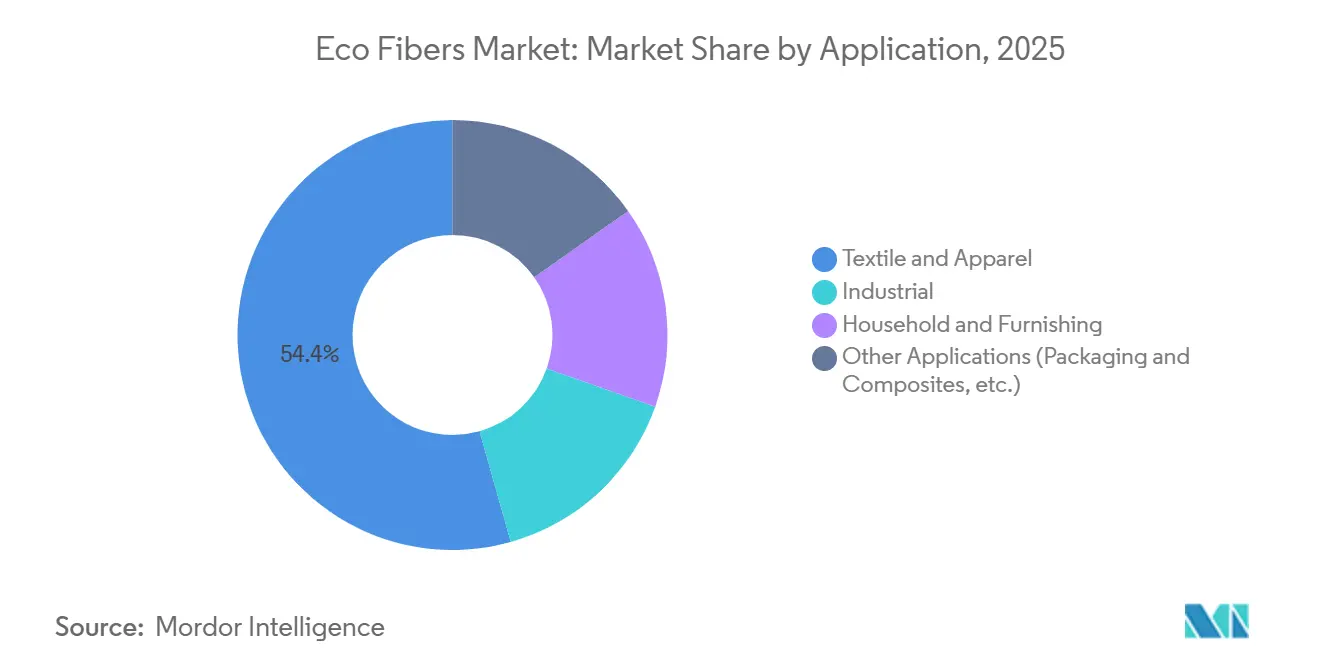
- By application, textile and apparel held 54.36% of the eco fibers market size in 2025, while other applications, including packaging and composites, are advancing at a 9.24% CAGR through 2031.
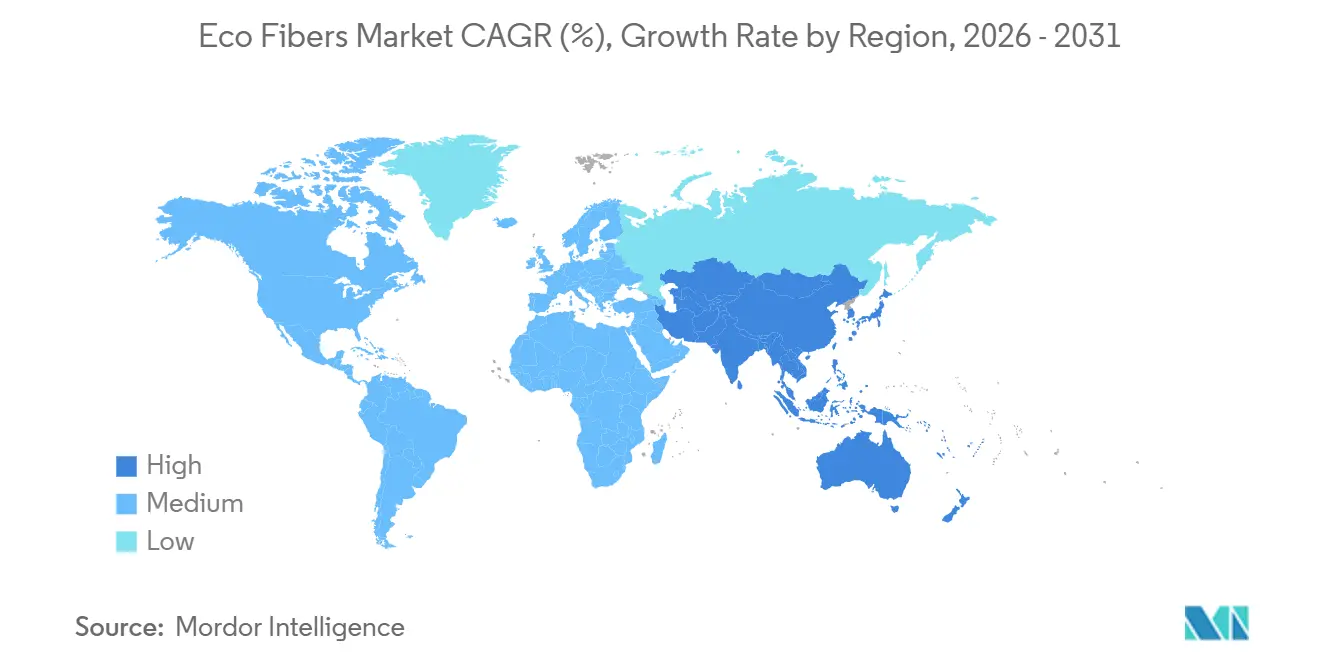
- By geography, Asia-Pacific commanded 53.24% revenue share in 2025 and is set to maintain an 8.12% CAGR, reflecting integrated agricultural-to-spinning supply chains.
Note: Market size and forecast figures in this report are generated using Mordor Intelligence’s proprietary estimation framework, updated with the latest available data and insights as of January 2026.
Market Trends and Insights
Drivers Impact Analysis of Eco Fibers Market*
| Drivers | (~) % Impact on CAGR Forecast | Geographic Relevance | Impact Timeline |
|---|---|---|---|
| Surge in fast-fashion brands adopting recycled polyester | +2.1% | Global, strongest in Europe and North America | Short term (≤ 2 years) |
| EU Extended Producer Responsibility (EPR) driving fiber circularity | +2.3% | Europe, spillover to UK and North America | Medium term (2-4 years) |
| Breakthrough low-impact lyocell spun-bond technology commercializing | +1.4% | Austria, China, India | Medium term (2-4 years) |
| Carbon-negative bio-based fibers from agricultural waste | +1.2% | India, China, ASEAN, South America | Long term (≥ 4 years) |
| Automated fiber-traceability and digital-passport mandates | +0.9% | Europe mandatory, North America voluntary | Short term (≤ 2 years) |
| Source: Mordor Intelligence | |||
Surge in Fast-Fashion Brands Adopting Recycled Polyester
Leading apparel retailers are converting aspirational pledges into binding contracts that guarantee post-consumer polyester volumes for five to seven years. H&M’s December 2025 agreement with Recover underscores a willingness to trade purchase flexibility for assured traceability and price locks. Mid-tier labels such as ONLY followed in September 2025, embedding recycled yarns into core collections rather than limited capsule lines. These commitments shorten payback periods for chemical-recycling investments and encourage suppliers to scale capacity in Europe and Asia-Pacific. Brands with secured inputs now highlight science-based emissions targets and product-level carbon footprints, accentuating the reputational gap with laggards that still rely on spot buying. The trend is producing a bifurcated eco-fibers market in which supply-assured firms can command premium shelf space while others face greenwashing scrutiny under emerging due diligence laws.
EU Extended Producer Responsibility (EPR) Driving Fiber Circularity
The revised Waste Framework Directive, in force since October 2025, obliges member states to launch textile EPR schemes by April 2028, making brands financially responsible for collection and recycling [1]. Fee eco-modulation links lower charges to garments designed for mono-material recovery, incentivizing demand for fibers that simplify dismantling. Mandatory separate collection bans textile disposal in mixed waste streams, raising feedstock availability for mechanical and chemical recycling plants. Digital Product Passports under the Ecodesign for Sustainable Products Regulation embed QR codes that surface fiber type, chemical additives, and recycling routes. The architecture is already influencing non-EU policy: the United Kingdom has opened consultations, and California is drafting a comparable bill. Consequently, compliance costs and design standards are internationalizing, pushing brands worldwide toward circular-ready fibers and verifiable supply chains.
Breakthrough Low-Impact Lyocell Spun-Bond Technology Commercializing
Lenzing’s October 2025 launch of TENCEL Lyocell HV100 positions high-volume lyocell as a cost-competitive substitute for cotton and polyester in hygiene, filtration, and home textiles [2]. Spun-bond routes omit traditional weaving, trimming energy consumption and capital expenditures. Earlier in January 2025, Lenzing broadened its Lyocell Fill range for bedding and upholstery, signaling a push into durable household segments. Joint development with TreeToTextile since 2024 targets non-wood pulping that reduces land-use pressure and feedstock volatility. Parallel initiatives by Plantae Technologies and Zylotex apply hemp cellulose to closed-loop solvents, cutting pesticide and irrigation footprints. Independent life-cycle-assessment audits under ISO 14040 are becoming prerequisites for brand adoption, making transparent environmental data as critical as cost per kilogram.
Carbon-Negative Bio-Based Fibers from Agricultural Waste
The Carbon Removal Certification Framework adopted in December 2024 sets out how bio-based products can earn tradable credits for sequestered carbon, directly rewarding fiber made from rice straw, wheat straw, or sugarcane bagasse. Producers in India and China are piloting blockchain registries that verify additionality and long-term storage, prerequisites for credit issuance. Agricultural-residue feedstocks also reduce open-field burning, curbing methane emissions that carry high global-warming potential. While verification still entails high transaction costs, the monetization outlook is encouraging project developers to co-locate fiber mills near crop belts, minimizing costly biomass logistics. Credit liquidity remains thin, delaying meaningful bottom-line impact until 2028, yet forward purchases by European fashion houses are already underwriting feasibility studies for 100 kt per year facilities.
Restraints Impact Analysis of Eco Fibers Market*
| Restraints | (~) % Impact on CAGR Forecast | Geographic Relevance | Impact Timeline |
|---|---|---|---|
| Premium pricing gap vs conventional fibers | -1.8% | Global, most acute in emerging economies | Short term (≤ 2 years) |
| Impending microfiber-shedding legislation | -0.7% | Europe and California leading | Medium term (2-4 years) |
| Limited recycling infrastructure for blended textiles | -1.1% | Severe in APAC and MEA | Long term (≥ 4 years) |
| Source: Mordor Intelligence | |||
Premium Pricing Gap vs Conventional Fibers
Recycled polyester and cotton currently carry 15-30% price uplifts versus virgin counterparts, straining margins for retailers serving cost-conscious consumers. Collection, sorting, and processing still lack scale economies, especially in markets where municipal waste systems remain informal. Chemical-recycling innovators promise cost parity by yielding virgin-grade output, yet feedstock contamination and solvent-recovery hurdles have delayed full-scale rollouts. The mismatch is most glaring in South Asia and sub-Saharan Africa, where household purchasing power limits willingness to absorb higher price tags. Until processing plants reach throughput that drives unit costs below virgin benchmarks, adoption will concentrate in developed economies where regulatory compliance or brand reputation compensates for the premium.
Impending Microfiber-Shedding Legislation
Legislators are zeroing in on synthetic microfiber pollution, with France already requiring filtration in new washing machines and California poised to follow. Each polyester garment can shed hundreds of thousands of microplastic filaments per wash, contaminating waterways and food systems. Proposed rules target both product-level fixes, such as tighter weaves, and appliance mandates that force in-drum filters. Compliance adds capital and research and development expenses for recycled-polyester producers, potentially eroding their price advantage over virgin yarns. Cellulosic alternatives enjoy a biodegradability edge yet still face scrutiny over solvent toxicity in viscose production. Regulatory fragmentation complicates product rollouts, as global brands must engineer to the strictest applicable standard, effectively making EU and Californian requirements worldwide baselines.
*Our forecasts treat driver/restraint impacts as directional, not additive. The impact forecasts reflect baseline growth, mix effects, and variable interactions.
Eco Fibers Market Segment Analysis
By Fiber Type:
Organic Dominance Anchors GrowthOrganic fibers captured 45.22% of the eco fibers market share in 2025, expanding more rapidly than the broader eco fibers market at a 9.72% CAGR to 2031. This performance reflects consumer perceptions of natural aesthetics and biodegradability, which reinforce brand storytelling around wellness and environmental credentials. The segment is led by organic cotton, hemp, and flax, each benefiting from embedded agricultural infrastructure that demands minimal processing adaptation. Recycled fibers, while smaller in absolute volume, represent the growing cohort, propelled by policy incentives and technology breakthroughs that lift performance to virgin-equivalent levels. Specialty bio-based options from algae, mycelium, and bacterial cellulose carve out high-margin niches in luxury streetwear and high-end sports apparel.
Innovation pipelines are extending organic-fiber reach into price-sensitive categories. Lenzing’s high-volume lyocell variant demonstrates how process refinement can lower cost per kilogram and unlock mass-market applications. Digital Passport compliance advantages also favor organic inputs because they reduce data complexity related to chemical auxiliaries. Yet, land-use competition with food and biofuel crops, aggravated by climate-driven yield swings, poses a latent constraint on scalability. Recycled fibers mitigate land tension but rely on underdeveloped collection networks, especially outside Europe and North America. Niche bio-based materials attract venture funding, but commercialization hinges on fermentation yield improvements and plant design that achieves sub-USD 3 per-kilogram cost parity.

By Source Feedstock:
Plant-Based Materials LeadPlant-based feedstocks held a 55.18% share of the 2025 value and are forecast to grow at a 9.26% CAGR, mirroring rising demand for cotton, bamboo, and sustainably managed wood pulp. Certification systems such as FSC and PEFC have become mandatory procurement filters for mainstream brands. Agricultural-residue feedstocks—rice straw, wheat straw, and sugarcane bagasse—are emerging as cost-negative inputs where governments discourage open-field burning. Animal-based fibers, including wool and silk, maintain premium positioning but face ethical and regulatory headwinds in several high-income markets. Synthetic-waste inputs, chiefly PET bottles, represent the fastest-scaling category as mechanical and chemical recycling lines ramp up in China, the United States, and Northern Europe.
Hemp-based lyocell pilots by Plantae Technologies and Zylotex suggest that fast-growing crops with lower inputs can occupy mid-priced fashion segments once solvent recovery achieves commercial efficiency. Carbon-credit monetization under the EU framework is expected to sweeten project economics for agricultural-residue plants from 2028 onward. Animal-based fibers confront a dual challenge of volatile grazing land costs and activist-driven bans on fur and exotic skins. Synthetic-waste feedstock economics correlate with crude oil prices; when virgin PET prices slump, recycled PET premiums widen and slow demand. Ultimately, portfolio diversification across multiple feedstocks is emerging as the hedge against supply volatility and policy risk.
By Application:
Textile Dominance with Non-Textile MomentumTextile and apparel commanded 54.36% of the eco-fibers market size in 2025, buoyed by athleisure, fast-fashion restocking cycles, and luxury houses integrating circularity metrics into brand equity. Corporate procurement teams are now embedding minimum recycled-content thresholds into supplier scorecards, ensuring steady demand visibility. Industrial end uses—geotextiles, automotive interiors, filtration media—are gaining share as OEMs decarbonize product portfolios in line with Scope 3 emissions targets. Household and furnishing demand remains stable, characterized by longer replacement cycles that suit higher-priced, durable eco-fiber blends. Other applications, notably rigid and flexible packaging as well as bio-composites, are projected to grow at a 9.24% CAGR through 2031, outpacing the textile average as single-use plastic bans proliferate.
Lenzing’s extension of Lyocell Fill to bedding and upholstery evidences how specialty diversification counters apparel margin compression. Packaging buyers value compostability and clean-room compatibility, attributes that cellulose-based films deliver. Composite producers in automotive and construction are specifying natural-fiber reinforcement to trim vehicle weight and embodied carbon. Although apparel commands volume leadership, it is most price-elastic, leading brands to balance sustainability with affordability. Industrial buyers, by contrast, justify eco-fiber premiums through total-cost-of-ownership savings, like lower landfill fees or regulatory compliance credits. Household and furnishing segments spread higher upfront costs across longer use spans, stabilizing demand even as turnover is slower.
Geography Analysis
APAC Eco Fibers Market
Asia-Pacific controlled 53.24% of 2025 revenue and is pacing the broader eco fibers market at an 8.12% CAGR through 2031. China’s export-oriented textile clusters are integrating recycled polyester lines to meet European and U.S. sourcing standards, while domestic sportswear labels adopt lyocell to differentiate quality. India leverages its status as the world’s largest organic-cotton grower, yet under-investment in post-consumer collection limits recycling throughput. Japan and South Korea are piloting chemical-recycling facilities that convert mixed-fiber waste into virgin-grade feedstock, positioning both countries as technology licensors across ASEAN. Vietnam and Bangladesh, favored for competitive labor costs, are attracting greenfield eco-fiber spinning mills, although compliance spending is diminishing wage advantages.
Europe Eco Fibers Market
Europe ranks second by value and grows in parallel, propelled by obligatory EPR fees and the October 2025 Digital Product Passport rules. Germany, France, and Italy host specialty-fiber innovators and advanced recycling hubs, while Austria’s Lenzing anchors the region’s lyocell leadership. High energy prices, however, curb Europe’s cost competitiveness in commodity polyester recycling, redirecting expansion toward high-value cellulosics and collaborative research and development in enzymatic depolymerization. Eastern European nations are attracting near-shoring projects from Western brands keen to cut lead times and trucking emissions.
North America Eco Fibers Market
North America holds a smaller but fast-growing eco-fibers market, concentrated in the United States, with athleisure, outdoor apparel, and homeware. California’s potential microfiber rule is steering brands toward cellulosic alternatives and spurring interest in onshore recycling capacity. Canada advances similar regulations and funds pilot cellulose-based composites for automotive applications. Mexico draws near-shore sewing operations that exploit zero-tariff USMCA corridors and shorter delivery schedules.
South America and MEA Eco Fibers Market
South America’s share is modest and tilted toward Brazil, where sugarcane bagasse underpins early-stage agricultural-residue projects, though currency volatility and logistics constraints slow scale-up. The Middle East and Africa remain nascent eco-fiber producers; Egypt’s long-staple cotton and Ethiopia’s garment parks provide footholds, yet capital inflows hinge on political stability and trade-access continuity to the EU and United States.
Value Chain Analysis
The eco-fibers value chain starts with feedstock origination and qualification, spanning FSC/PEFC-certified wood pulp for MMCFs, agricultural residues (rice straw, wheat straw, bagasse), and synthetic waste such as post-consumer PET and polyamide. Feedstock then moves through sorting and pre-processing (collection, grading, decontamination), followed by conversion routes: mechanical recycling for relatively clean mono-material streams, and chemical or enzymatic pathways for blended or contaminated textiles. Upstream technology owners and intermediates suppliers are increasingly visible in the chain, including textile-to-textile polyester initiatives (Loop Industries) and nylon depolymerization platforms (Samsara Eco), as well as bio-based intermediates such as Qore (a Cargill joint venture) supplying building blocks for spandex in partnership with The LYCRA Company.
Midstream stages include polymerization and solvent preparation and fiber formation (melt spinning for synthetics, closed-loop solvent spinning for lyocell), then finishing and yarn spinning, knitting and weaving or nonwoven conversion, and finally brand sourcing, distribution, and retail. Strategic control points are shifting toward (1) traceability and data capture for Digital Product Passport-style compliance, which is pushing mills and recyclers to provide batch-level verification, and (2) secured offtake that de-risks capacity additions and improves utilization. Notable bottlenecks include limited infrastructure for blended-textile sorting and recycling, climate-driven variability in certified forestry and agricultural yields, and dependence on specific solvents and solvent-recovery performance in lyocell-type processes. Nearshoring and regional hubs are also emerging in response to logistics and compliance requirements, illustrated by Recover and Intradeco establishing a recycled-cotton joint venture in El Salvador (May 2025) and the IFC-backed Morocco Textile Circularity program highlighting an investment pipeline for scaling circular feedstock and processing capacity (reported July 2026).
Competitive Landscape
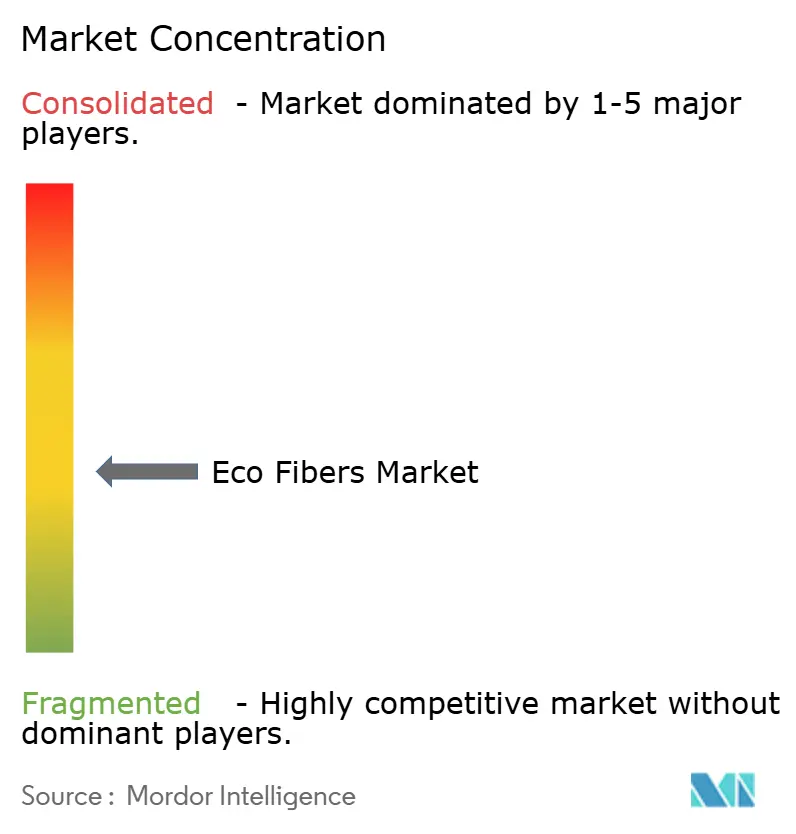
The eco fibers market is moderately fragmented. Grasim’s investment in enzymatic pre-treatment and Sateri’s expansion into closed-loop solvent recovery underscore incumbent strategies to defend share through technical upgrades. Chemical-recycling start-ups such as Renewcell, Eastman, and Circular Systems target the performance gap in blended-textile recycling, promising virgin-equivalent yarn from post-consumer waste once scale materializes. Yet, capital intensity, feedstock quality variability, and lengthy permitting dilute near-term disruptive potential.
Agricultural-waste converters like Ananas Anam (pineapple-leaf leather) and Natural Fiber Welding (plant-based leather) occupy premium product niches where sustainability storytelling commands double-digit margins. Scaling beyond small-batch luxury requires cost parity with chrome-tanned leather, a hurdle unlikely to be cleared before 2029. Digital-traceability mandates reward vertically integrated firms that can streamline data capture; Lenzing and Sateri already embed fiber-level identifiers compatible with forthcoming EU passport ecosystems. White-space openings remain in blended-textile depolymerization and rapid-spectrum content verification, fields attracting venture and corporate venture capital funds.
Looking forward, technology acceleration, regulatory harmonization, and rising carbon prices favor diversified groups with strong balance sheets. Expect consolidation around recycling know-how, feedstock contracts, and digital-passport readiness, with mid-tier standalone spinners facing acquisition or specialization decisions.
Eco Fibers Industry Leaders
-
Lenzing AG
-
Grasim Industries Limited
-
Teijin Frontier Co., Ltd.
-
Sateri
-
Tangshan Sanyou Xingda Chemical Fiber CO., Ltd.
- *Disclaimer: Major Players sorted in no particular order
Eco Fibers Market Companies Covered in this Report
- Ananas Anam
- Bast Fibre Technologies Inc.
- Bcomp
- Circular Systems S.P.C.
- Eastman Chemical Company
- ECOLOGICAL FIBERS INC.
- Fulgar S.p.A.
- Grasim Industries Limited
- HYOSUNG TNC
- Interface, Inc.
- Lenzing AG
- Libolon
- Natural Fiber Welding Inc.
- Patagonia, Inc.
- Renewcell
- Sateri
- Tangshan Sanyou Xingda Chemical Fiber CO., Ltd.
- Teijin Frontier Co., Ltd.
- TORAY INDUSTRIES, INC.
- UNIFI, Inc.
Market Opportunities and Future Outlook
White-space opportunities are concentrated in scalable textile-to-textile recycling for hard-to-process streams (blends and synthetics beyond PET), and in non-wood cellulosic feedstocks that diversify supply away from forest pulp. Lenzing’s move to become the majority owner of TreeToTextile AB (February 2026) provides a concrete pathway for industrializing next-generation cellulose fibers, aligned with brand demand for lower-impact MMCFs and improved feedstock resilience. On the synthetic side, nylon recycling is moving from pilots toward demonstration capacity, supported by brand-backed funding such as lululemon’s participation in Syntetica’s USD 30 million Series A (July 2026) to develop a nylon recycling demonstration facility in Clermont-Ferrand, France, creating a clearer commercialization route for regenerated polyamide fibers used in performance apparel.
A second opportunity area is deployment models that reduce adoption friction, including modular or retrofit recycling installations, regional collection and pre-processing systems, and digitally enabled compliance toolchains that convert traceability from a marketing claim into procurement eligibility. Cross-industry consortia provide a visible mechanism for scaling, exemplified by HKRITA, Looptworks, and Jeanologia partnering to scale The Green Machine textile recycling technology with planned installations in Italy and Turkey (July 2026). At the same time, premium pricing for recycled fibers and the scarcity of blended-textile infrastructure keep room for players that can combine stable feedstock access, processing capability, and verifiable chain-of-custody data for global brands navigating EU-style circularity requirements.
Recent Industry Developments in Eco Fibers Market
- June 2026: Grasim Industries Limited completed an expansion of lyocell capacity by 110,000 tonnes per annum at its Harihar, Karnataka site, adding two new 55,000 TPA lines. The upgrade strengthens integrated supply options for apparel and home-textile buyers seeking lower-impact fibers at scale.
- October 2025: Lenzing AG launched TENCEL Lyocell HV100, a high-volume lyocell variant designed for applications including nonwovens, home textiles, and industrial fabrics. The product push broadened lyocell’s addressable end uses beyond apparel and supported sourcing programs that require traceable, lower-impact MMCFs.
- December 2024: The European Union adopted the Carbon Removal Certification Framework, establishing rules for how carbon removals can be certified and credited. This created a clearer mechanism for agricultural-residue-based and other bio-based fiber projects to link material production with verified carbon accounting, influencing feasibility work for larger integrated bio-based fiber plants.
Eco Fibers Market Report Scope and Research Methodology
Market Definition and Coverage
The eco fibers market covers fiber and yarn inputs positioned as lower impact options that are used across textiles and select technical uses. The sizing is built in value terms and counts sales generated from organic, recycled, and regenerated fiber categories across major producing and consuming regions.
Scope exclusions: This sizing does not treat finished apparel, home textiles, or downstream retail value as part of the eco fibers market unless the value can be cleanly tied back to fiber-level sales.
Segments Covered in This Report
- By Fiber Type
- Organic Fibers
- Recycled Fibers
- Other Fiber Types (Specialty Bio-based Fibers, etc.)
- By Source Feedstock
- Plant-based
- Animal-based
- Synthetic Waste
- Agricultural Residue
- By Application
- Textile and Apparel
- Industrial
- Household and Furnishing
- Other Applications (Packaging and Composites, etc.)
- By Geography
- Asia-Pacific
- China
- India
- Japan
- South Korea
- ASEAN Countries
- Rest of Asia-Pacific
- North America
- United States
- Canada
- Mexico
- Europe
- Germany
- United Kingdom
- France
- Italy
- Rest of Europe
- South America
- Brazil
- Argentina
- Rest of South America
- Middle East and Africa
- Saudi Arabia
- South Africa
- Rest of Middle East and Africa
- Asia-Pacific
Data Sources, Market Sizing, and Validation
Desk Research
Desk research was used to set the market structure and anchor the model to repeatable public signals. We reviewed sources such as the Food and Agriculture Organization crop and fiber series, UN Comtrade trade statistics for textile fibers and yarns, the International Cotton Advisory Committee publications, and Textile Exchange public materials on preferred fibers. Supporting context was also taken from peer reviewed papers on fiber life cycle impacts and from patent databases that show where material innovation is moving.
To keep assumptions realistic, we also ran checks using company annual reports, investor presentations, and reputable press coverage of capacity additions and sustainability claims. In a few cases, paid subscription company financials and a shipment-level import/export database helped confirm directionally correct pricing and trade flows by fiber category. The sources named here are illustrative only, and many other public documents and datasets were also consulted for data collection, validation, and clarification.
Primary Interviews and Surveys
Primary interviews focused on fiber producers, spinners, textile converters, brand sourcing teams, and sustainability specialists who track adoption at the material level. These discussions were used to confirm price ranges by fiber type, the split between organic, recycled, and regenerated fibers, and realistic adoption curves across apparel, household and furnishings, and industrial uses across APAC, EMEA, and the Americas.
Distribution of primary research fieldwork respondents
| Company type | Respondent position | Region |
|---|---|---|
| Top tier: 35% | CXOs: 20% | APAC: 48% |
| Mid tier: 43% | Functional/Unit leaders: 29% | EMEA: 29% |
| Smaller Players: 22% | Managers: 51% | Americas: 23% |
Market-Sizing & Forecasting
The core model is built using a top-down approach where fiber demand is reconstructed from textile and technical end use activity, then filtered through eco fiber penetration rates by application and region. To keep the totals consistent with real market constraints, we corroborate results with selective bottom-up approximations, including sampled supplier revenue roll ups, capacity based sanity checks for regenerated fibers, and simple volume times average selling price calculations for recycled inputs when public trade signals are strong.
Key inputs that move the model include planted area and output for relevant natural fibers, recycled feedstock availability and collection rates, installed capacity and utilization trends for regenerated fibers, trade flows for key fiber and yarn codes, and application share shifts between clothing, household and furnishings, and industrial uses. Pricing uses blended average selling prices adjusted by region and fiber type, and then checked against interview ranges and observed raw material movements. For forecasting, scenario analysis is used since policy push, brand sourcing targets, and recycling infrastructure can change adoption speed, and these variables are easier to stress test than to assume as a straight line. Where bottom-up coverage is thin, we use proxy ratios tied to similar fiber categories, then recheck with expert feedback before finalizing.
Data Validation & Update Cycle
Model outputs are cross-checked against independent signals such as trade balances, capacity announcements, and shifts in preferred fiber sourcing statements to see if the direction matches what the industry is showing. If a large variance appears, the assumptions are reopened, and follow up calls are triggered on the specific variable that is driving the difference, most often pricing, utilization, or penetration by application.
Before sign-off, the work goes through multi-step analyst review where calculations are re-run and outliers are traced back to the source logic. The report is refreshed annually, and interim updates are made when material events occur, such as large capacity start-ups, policy changes, or sharp moves in key feedstock costs. Right before delivery, a final scan is completed so the numbers reflect the latest available information.
Mordor Intelligence's Eco Fibers Market Size Measured Against Other Published Estimates
Published market sizes for eco fibers can look far apart even when many reports reference the same sustainability theme. The differences usually come from what is counted as an eco fiber, which year is treated as the base, and how pricing is carried forward when recycled and regenerated inputs face volatile costs.
The main gap comes from whether downstream textiles and apparel value are blended into the total. Mordor Intelligence counts only fiber-level value across organic, recycled, and regenerated categories, then validates the split using trade flow checks and capacity utilization cues. Other estimates also diverge when they apply aggressive adoption curves from brand targets without confirming regional supply limits, or when currency conversion timing is not aligned to the stated year.
Benchmark comparison
| Source | Market Size | Gaps in Research Methodology |
|---|---|---|
| Mordor Intelligence | USD 57.61 B (2026) | |
| Global Consultancy A | USD 50.33 B (2025) | Uses a different base year and mixes product groupings that can shift totals, especially when manmade and natural eco fibers are combined under broader labels and priced with a single blended trend. |
| Industry Publisher B | USD 73.12 B (2026) | Tends to apply higher implied average selling prices and faster adoption assumptions across clothing and home applications, which can lift value if recycled and regenerated fibers are treated as premium across regions. |
Taken together, the spread is explained mostly by scope and pricing logic rather than simple math errors. Our approach keeps the total tied to fiber-level demand signals and repeatable inputs, so changes can be traced back to adoption, capacity, trade, and price movements year by year.
Key Questions Answered in the Report
What is the projected value of the eco fibers market in 2031?
The eco fibers market is expected to reach USD 85.12 billion by 2031.
Which fiber category leads global demand?
Organic fibers account for the largest share, representing 45.22% of 2025 revenue.
How fast is the eco fibers market growing?
The sector is expanding at an 8.12% CAGR between 2026 and 2031.
Which region commands the highest revenue share?
Asia-Pacific leads with 53.24% of 2025 global sales thanks to integrated agricultural and manufacturing ecosystems.
What policy trend most influences future growth?
Extended Producer Responsibility mandates in the EU and similar proposals in other economies are turning circularity from a voluntary initiative into a legal obligation.