
Market Overview
| Study Period | 2021 - 2031 |
|---|---|
| Forecast Data Period | 2026 - 2031 |
| Historical Data Period | 2021 - 2024 |
| Growth Rate | 3.31 % |
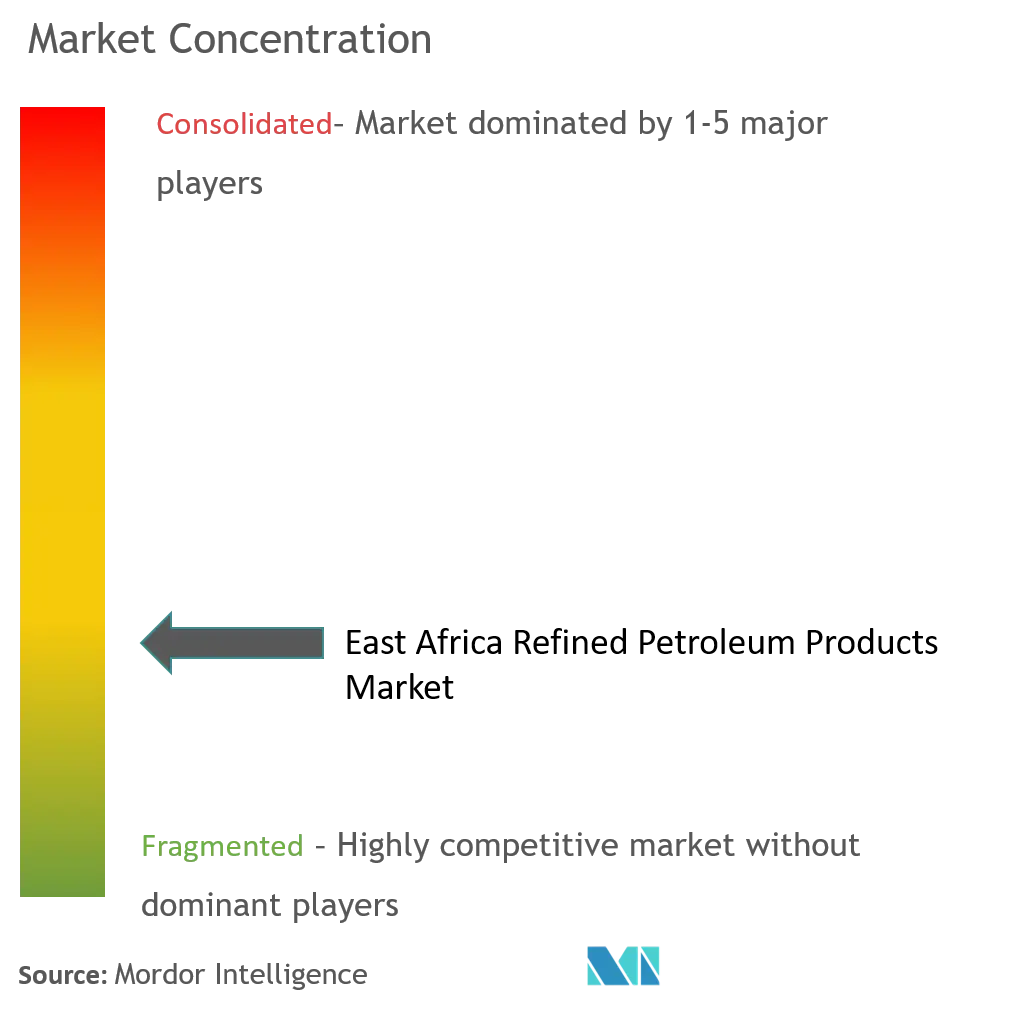
| Market Concentration | Medium |
Major Players *Disclaimer: Major Players sorted in no particular order Image © Mordor Intelligence. Reuse requires attribution under CC BY 4.0. | |
East Africa Refined Petroleum Products Market Analysis by Mordor Intelligence
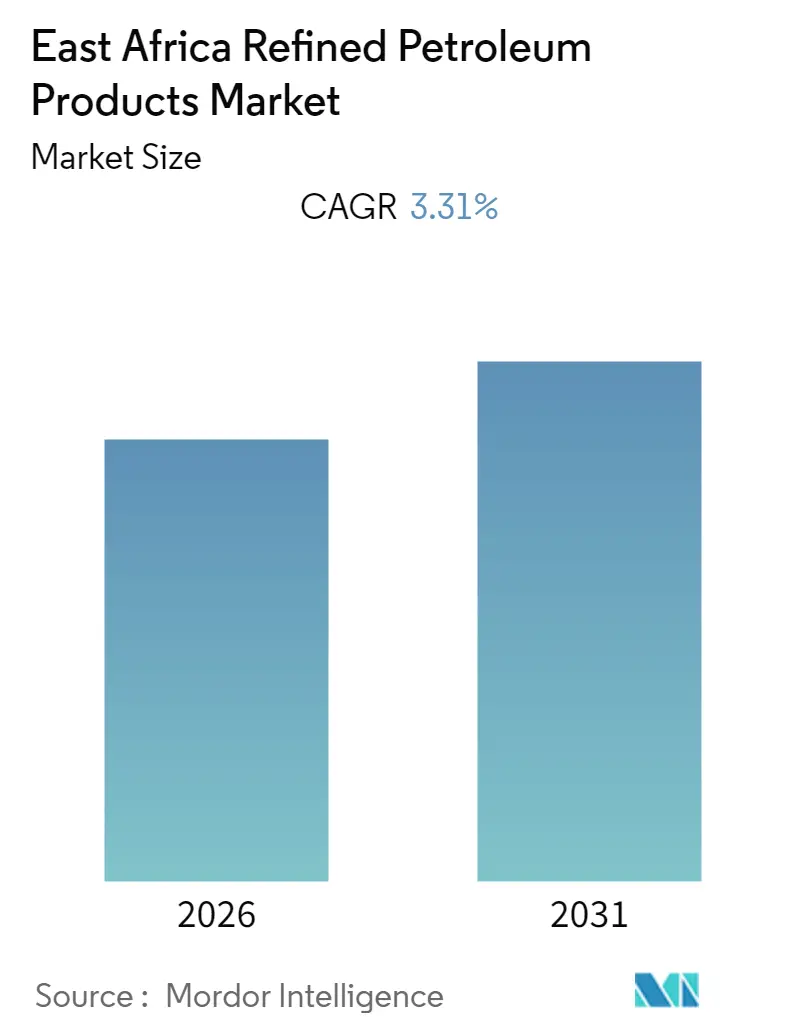
The East Africa Refined Petroleum Products Market size is expected to register a CAGR of 3.31% during the forecast period (2026-2031).
Middle distillate oil products are expected to dominate the market in the forecast period, owing to demand in different sectors, like power generation, transportation, and others.
With more than 140 million people not having access to electricity in 2019 and growing consumption of refined petroleum products from end-user industries, East Africa can create ample opportunities for electricity generation using oil and gas products.
Kenya is expected to dominate the market during the forecast period due to the country's growing demand for gas and oil.
Note: Market size and forecast figures in this report are generated using Mordor Intelligence’s proprietary estimation framework, updated with the latest available data and insights as of 2026.
East Africa Refined Petroleum Products Market Trends and Insights
Middle Distillates to Dominate the Market
Middle distillate refers to refined oil products between lighter fuel like gasoline and heavier fuels like fuel oil. It mainly comprises jet fuel, kerosene, diesel, and others.
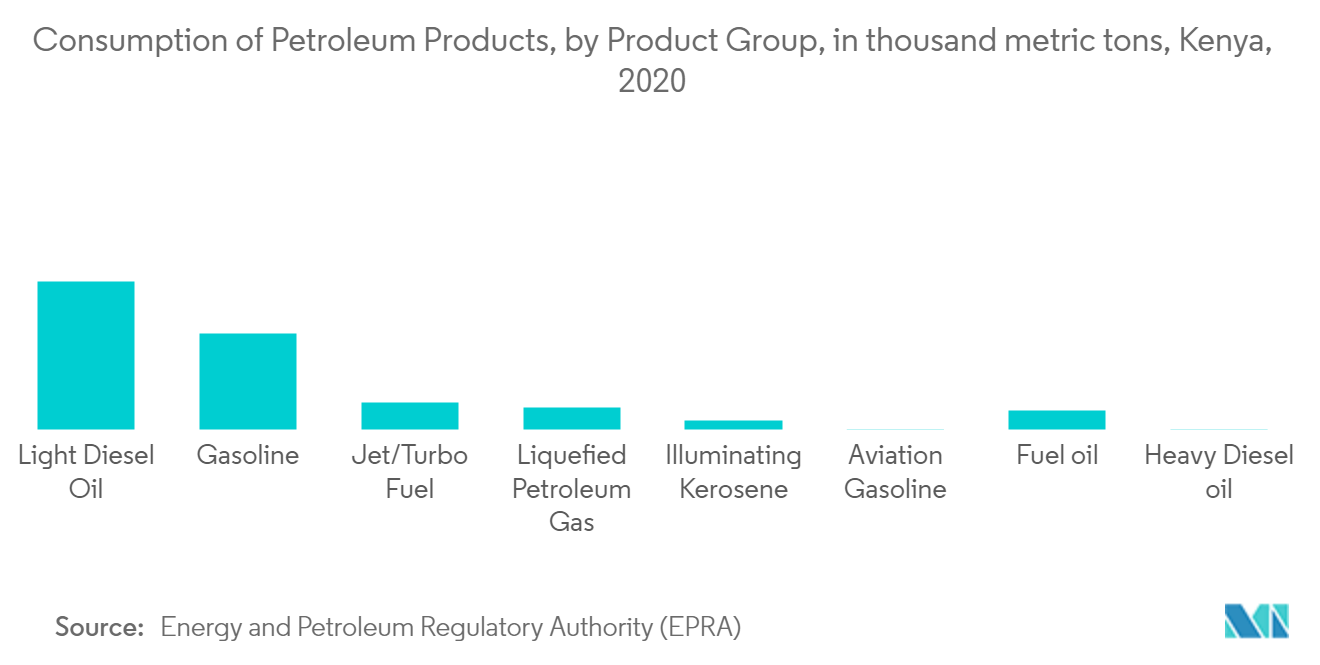
Kenya witnessed an increase in the consumption of refined products in 2020. Light diesel oil and gasoline led the market with daily consumption at 2,157.6 thousand metric ton and 1395.3 thousand metric ton, respectively.
Additionally, front-end engineering and design (FEED) work on the Ugandan refinery has been completed, with a final investment decision (FID) to be made in August 2022. The refinery is expected to be operational by 2023, significantly driving the refined products market.
With growing demand in the transportation and power generation sectors, among others, the demand for middle distillates is expected to grow further and dominate the market in the forecast period.
Kenya to Dominate the Market
According to the International Energy Agency, the demand for gas consumption is expected to grow significantly in Kenya in the future, owing to both overall African and Kenyan ongoing policy scenarios.
The construction of new oil terminals and refineries in the country will also support the growth of refined petroleum products. For instance, the new Kipevu Oil Terminal in Mombasa, Kenya, is due to start operations in January 2022 and will see Kenya double its handling capacity to transport petroleum products to Uganda, Burundi, and Rwanda from the current 35,000 ton. The terminal is expected to drive the growth in the market significantly.
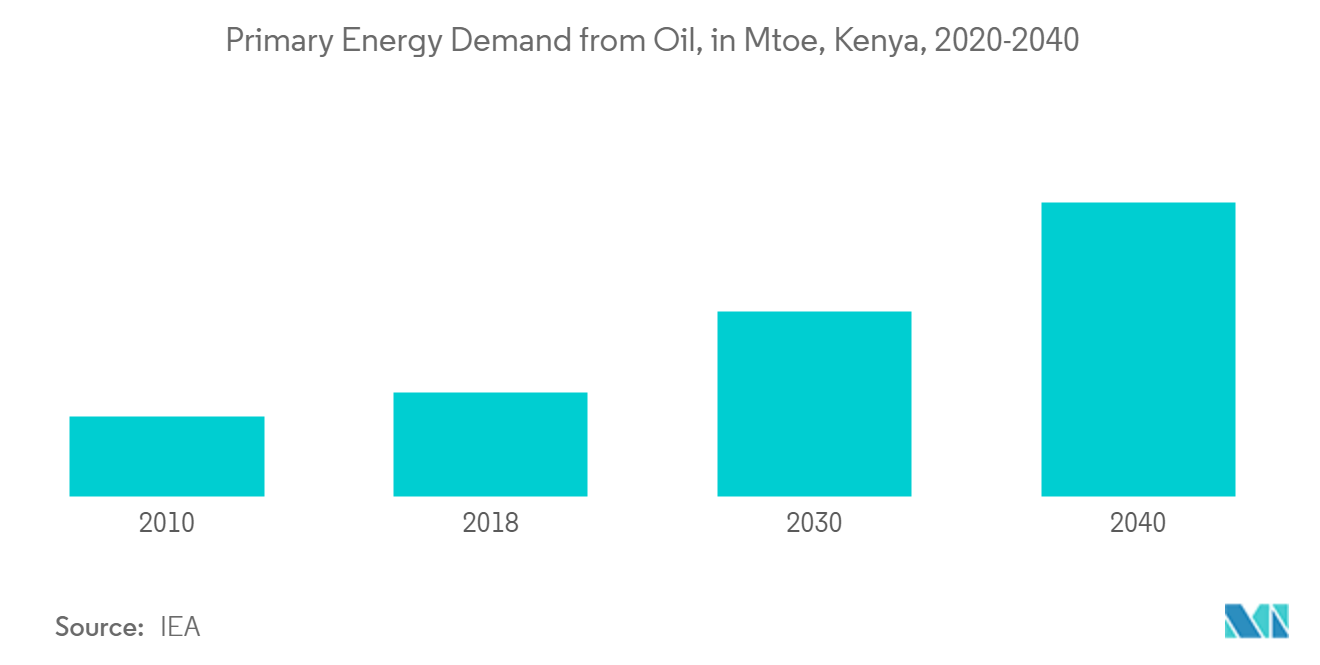
The primary energy consumption by Kenya of oil is expected to reach more than 13 megaton of oil equivalent (Mtoe) by 2040, creating significant demand for refined petroleum products as well.
In December 2021, Kenya Pipeline Company KPC and Kenya's Ministry of Energy announced plans to set up a dedicated LPG storage facility with a capacity of around 25,000 ton, which is expected to have a positive impact on the market studied.
With increases in population and demand for refined petroleum products from end-user industries like automotive and petrochemical industries, the refined petroleum products market in Kenya is expected to dominate the market over the forecast period.
Regulatory Landscape
Regulation of refined petroleum products in East Africa is mainly led by national energy regulators and quality-control frameworks that affect imports, storage, transport, and retail. In Kenya, the Energy and Petroleum Regulatory Authority (EPRA) gazetted petroleum products quality rules in 2025, including the Petroleum (Products Quality Management) Regulations (Legal Notice No. 104 of 2025) and the Petroleum (Products Quality Management) (No. 2) Regulations (Legal Notice No. 185 of 2025). These updates tighten requirements around testing and controls for imported and transiting fuels.
In Tanzania, the Energy and Water Utilities Regulatory Authority (EWURA) and upstream institutions such as the Petroleum Upstream Regulatory Authority (PURA) and Tanzania Petroleum Development Corporation (TPDC) remain key reference bodies for licensing and sector oversight. In March 2026, Tanzania's Ministry of Energy directed PURA and TPDC to pursue actions to revitalize exploration. In May 2026, PURA reported that preparations for Tanzania's fifth oil and gas licensing round were complete, pending Cabinet approval of a revised Model Production Sharing Agreement, an upstream step that feeds into longer-term feedstock and midstream planning. At the regional level, the Energy Regulators Association of East Africa (EREA) and East African Community discussions on harmonization continue to influence cross-border compliance expectations for petroleum products.
Value Chain Analysis
The refined petroleum products value chain in East Africa is import-heavy and corridor-led, with supply sourced largely from international markets and moved through coastal ports into inland depots and retail networks. Marine import reception and storage at Mombasa and Dar es Salaam anchor the chain, followed by primary evacuation through pipelines and road haulage to inland terminals, and then secondary distribution to industrial users, power generation, aviation, and service stations operated by oil marketing companies such as TotalEnergies, Vivo Energy (Shell), and KenolKobil.
Midstream capacity and clearance processes drive product availability and working-capital intensity. Kenya's corridor is supported by Kenya Pipeline Company (KPC) infrastructure and government-to-government import arrangements with suppliers including Saudi Aramco, ADNOC, and ENOC, with offtake handled via nominated oil marketing companies. In 2025, Kenya implemented customs and depot process digitization through integration between KPC and the Kenya Revenue Authority (KRA), including Smart Gates and platform linkages aimed at reducing truck turnaround and clearance times. The region also uses corridor diversification as a supply-risk mitigation tool, such as Uganda National Oil Company's June 2025 contingency imports of 35 million litres routed via Tanzania during disruptions on the Kenyan route. On the capacity side, Tanzania broke ground in March 2026 on a petroleum storage expansion at Dar es Salaam Port (15 new tanks, 378,000 cubic meters). Major upstream-linked logistics infrastructure such as the East African Crude Oil Pipeline (EACOP) progressed through 2026, reinforcing the strategic importance of the Uganda-Tanzania axis alongside the traditional Kenya corridor.
Competitive Landscape
The East African refined petroleum products market is moderately fragmented. Some of the major companies include TotalEnergies SE, Shell PLC, KenolKobil Ltd, National Oil Ethiopia PLC, and Vivo Energy PLC.
East Africa Refined Petroleum Products Industry Leaders
-
National Oil Ethiopia Plc
-
TotalEnergies SE
-
Shell Plc
-
Vivo Energy Plc
-
KenolKobil Ltd
- *Disclaimer: Major Players sorted in no particular order
Market Opportunities and Future Outlook
Near-term opportunity centers on reducing landed costs and improving security of supply through storage expansion, corridor redundancy, and faster clearance across the Kenya and Tanzania import routes. Tanzania's March 2026 Dar es Salaam Port petroleum storage expansion (15 tanks totaling 378,000 cubic meters) and Kenya's ongoing efforts to digitize depot interfaces between KPC and KRA address bottlenecks that contribute to demurrage, truck waiting time, and in-transit losses in a market where middle distillates underpin transport and power demand.
A second opportunity area is downstream and midstream investment tied to new infrastructure and corporate capital programs. Kenya Pipeline Company disclosed in its January 2026 IPO prospectus a plan to increase capital spending over five years (about USD 852.6 million) across network expansion and storage, creating room for contractors, depot services, additive/quality testing services, and oil marketing company throughput growth. The investment pipeline is also starting to reshape regional supply options. In July 2026, Dangote Industries outlined funding plans (cash, bonds, and an IPO) for a proposed 700,000 bpd refinery on Lamu Island, Kenya, while EACOP reported above 90% completion with commissioning processes underway. Together, these developments affect how East Africa weighs imports against potential in-region processing and logistics-linked trade flows.
Recent Industry Developments
- July 2026: Vivo Energy Kenya opened its 350th Shell service station in Kenya, expanding its retail footprint and throughput capacity in a market where branded networks compete on availability and convenience. The addition supports higher volumes across gasoline and middle distillates while strengthening the companys positioning with consumers and commercial fleets.
- June 2026: TotalEnergies Marketing Kenya committed KES 1 billion annually to expand clean cooking and LPG-related initiatives aligned with Kenyas push to increase LPG adoption. This investment supports higher LPG penetration and strengthens TotalEnergies role across fuels plus adjacent household energy distribution channels.
- May 2026: Vivo Energy Kenya launched a new model motorists destination service station on Dennis Pritt Road in Nairobi, emphasizing a multi-service retail format. The move reinforces the shift among oil marketing companies toward higher-margin non-fuel offerings alongside fuel sales, supporting network competitiveness as station density rises.
Research Methodology Framework and Report Scope
Market Definition and Coverage
For this methodology, the market is defined as the value of refined petroleum products supplied for end use across East Africa, covering key fuels within light, middle, and heavy distillates, priced at the point of first sale into the domestic market.
Scope exclusions: We exclude crude oil, upstream production value, and non-fuel petrochemicals, and we also exclude downstream assets and services such as storage, retailing, and pipeline transportation fees.
Segmentation Overview
- Type
- Light Distillates
- Middle Distillates
- Heavy Distillates
- Geography
- Uganda
- Kenya
- Tanzania
- Mozambique
- Rest of East Africa
Data Sources, Market Sizing, and Validation
Desk Research
Desk research starts with building the demand and supply picture country by country, since most volumes are imported and then distributed locally. We use public datasets that show import values, quantities, and product codes, and we check the results against energy-balance style publications and downstream regulator releases.
The sources referred to include public bodies and databases such as UN Comtrade (via World Bank WITS), UN energy statistics yearbooks, energy regulators and ministries (for example, downstream petroleum performance reports), and central bank and national statistics releases on trade and inflation. We also use IMF or World Bank macro series for currency and GDP context. In parallel, we review company annual reports, investor presentations, and port or pipeline corridor updates, plus reputed press, to cross-check changes in supply routes. When needed, a paid subscription for shipment-level import data and a news and financials database is used to validate timing of large cargo arrivals and to reduce gaps in spot price movements. The desk research sources listed here are illustrative, and we also used other documents for data collection, cross-checking, and clarification.
Primary Interviews and Surveys
Primary work is used to test what the desk data cannot fully explain, especially product mix shifts, margin pass-through, and how pricing is applied across importers, wholesalers, and large end users. We spoke with a spread of stakeholders across importing, distribution, and bulk consumption to confirm typical contract structures, product grade substitutions, and the timing of price resets across major East African corridors.
Distribution of primary research fieldwork respondents
| Company type | Respondent position |
|---|---|
| Top tier: 29% | CXOs: 16% |
| Mid tier: 55% | Functional/Unit leaders: 34% |
| Smaller Players: 16% | Managers: 50% |
Market-Sizing & Forecasting
The sizing model is built using a top-down reconstruction where product demand is inferred from country supply availability, using production (where present), imports, exports, and visible stock movements as the starting frame. Those volumes are then converted to value using country-level price proxies that reflect the typical basket for gasoline, diesel, jet fuel and kerosene, and fuel oil, with adjustments for mix across light, middle, and heavy distillates.
To keep the numbers realistic, we corroborate the totals with selective bottom-up checks, such as channel checks on importer throughput ranges, sampled price per liter movements, and cross-border re-export patterns into landlocked neighbors. Inputs that most often move the model include import tonnage by product code, corridor-driven supply shifts, regulated or published pump price trends (as a sanity check on wholesale pricing), freight and insurance effects that show up in landed cost, and currency movements against the USD that change local pricing outcomes. Where product-level reporting is incomplete, we use proportional split rules anchored to the most recent verified mix, and then we correct the splits when primary respondents confirm a structural shift.
For forecasting, scenario analysis is used, since demand is influenced by macro growth and policy actions that can change quickly. The forward view is built by linking fuel demand to indicators like road freight activity, vehicle parc growth signals, industrial output direction, and aviation activity for jet fuel. Price and FX assumptions are then applied in line with what industry participants expect for pass-through timing.
Data Validation & Update Cycle
Validation is done through multiple passes where model outputs are compared against independent signals like total fuel import bills, reported consumption summaries from regulators, and known supply disruptions at ports or along corridors. When a value or growth step looks unusual, we re-check the underlying drivers, and if needed, we contact respondents again to confirm whether the change was caused by price, mix, or volume.
Before sign-off, another analyst reviews the calculations and assumptions so errors and double counting are less likely to slip through. The report is refreshed annually, and interim updates are done when there is a material event such as a policy change, a major currency move, or a supply route disruption. Right before delivery, we run a final pass to ensure the latest available data and events have been reflected.
Mordor Intelligence's East Africa Refined Petroleum Products Market Size Compared Against Other Published Estimates
Published market values for refined fuels in East Africa often look different because each publisher makes its own choices on which countries are in scope, which products are counted, and whether values reflect import parity, wholesale pricing, or retail pump prices. Differences also show up when one estimate is anchored to volumes and another is anchored to spending, since inflation and exchange rates can move the value quickly.
A major spread driver is refresh cadence and currency timing, because this market is sensitive to monthly price resets and FX swings that change USD values even when liters sold are steady. This is why the market approach used by Mordor Intelligence updates price logic with current-year FX averages and then re-checks implied USD per ton against import bills and regulator price releases.
Benchmark comparison
| Source | Market Size | Gaps in Research Methodology |
|---|---|---|
| Mordor Intelligence | USD 0.00 B (2025) | |
| Regional Consultancy A | USD 10.30 B (2022) | Uses a broader petroleum products definition and appears to blend adjacent downstream activities, and the base year is older, so later FX and price swings are not captured consistently. |
| Industry Portal B | USD 19.64 B (2026) | Starts at a forecast year and rolls up downstream scope beyond refined product value, which can inflate totals when refining, distribution infrastructure, and services are included together. |
The table shows that most differences come from year choice and what price point is used, along with whether downstream services are counted inside the same total. By keeping the value tied to observable product supply and by applying repeatable price and FX rules that can be checked against public signals, the estimate stays easier to trace and update when conditions change.
Key Questions Answered in the Report
What is the current East Africa Refined Petroleum Products Market size?
The East Africa Refined Petroleum Products Market is projected to register a CAGR of 3.31% during the forecast period (2026-2031)
Who are the key players in East Africa Refined Petroleum Products Market?
National Oil Ethiopia Plc, TotalEnergies SE, Shell Plc, Vivo Energy Plc and KenolKobil Ltd are the major companies operating in the East Africa Refined Petroleum Products Market.
What years does this East Africa Refined Petroleum Products Market cover?
The report covers the East Africa Refined Petroleum Products Market historical market size for years: 2020, 2021, 2022, 2023, 2024 and 2025. The report also forecasts the East Africa Refined Petroleum Products Market size for years: 2026, 2027, 2028, 2029, 2030 and 2031.