
E-House Market Size and Share
Market Overview
| Study Period | 2020 - 2031 |
|---|---|
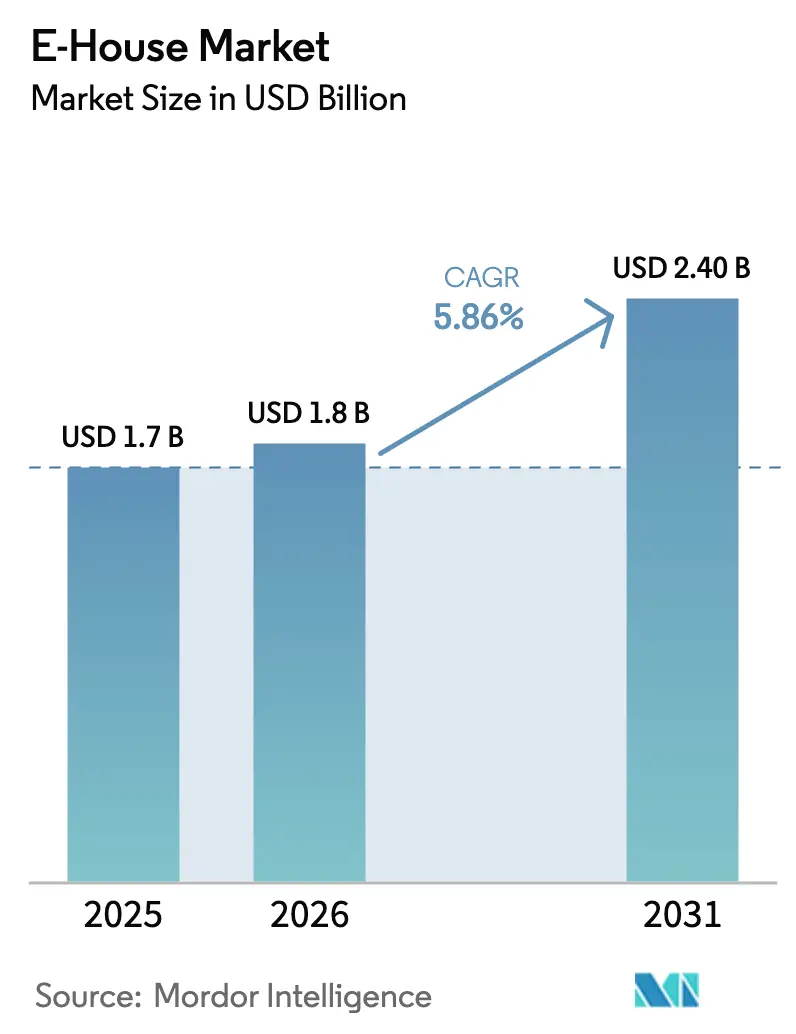
| Market Size (2026) | USD 1.8 Billion |
| Market Size (2031) | USD 2.40 Billion |
| Growth Rate (2026 - 2031) | 5.86% CAGR |
| Fastest Growing Market | Middle East |
| Largest Market | Asia Pacific |
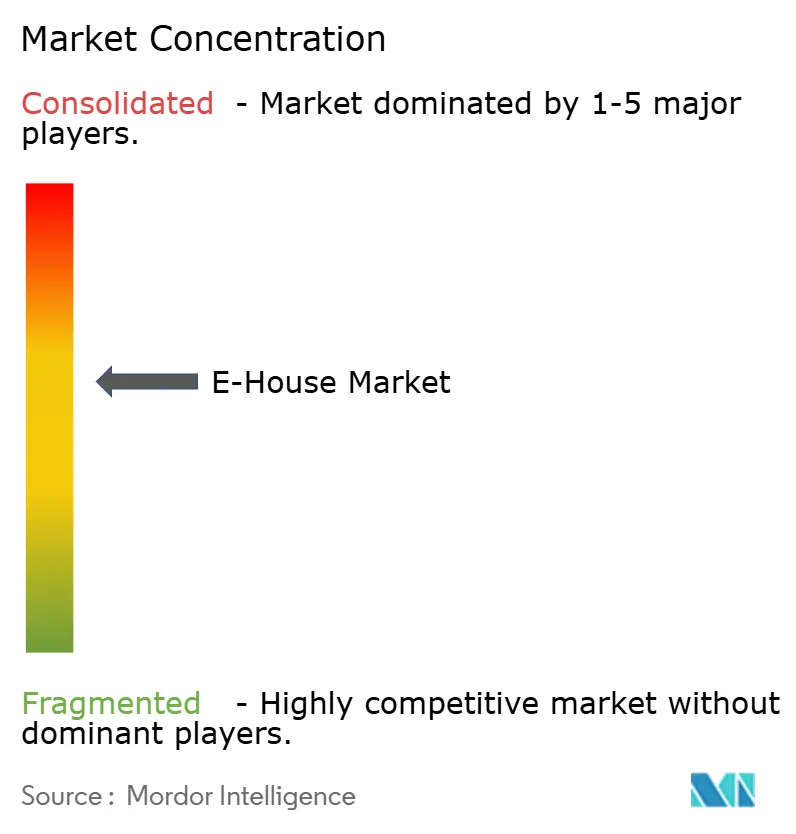
| Market Concentration | Medium |
Major Players *Disclaimer: Major Players sorted in no particular order Image © Mordor Intelligence. Reuse requires attribution under CC BY 4.0. | |
E-House Market Analysis by Mordor Intelligence
The E-House market size is projected to be USD 1.70 billion in 2025, USD 1.80 billion in 2026, and reach USD 2.40 billion by 2031, growing at a CAGR of 5.86% from 2026 to 2031. Surging demand for plug-and-play electrical infrastructure is altering procurement patterns, because factory-assembled modules shorten on-site work from months to weeks and lower construction risk. Utilities are embracing the approach to accelerate grid upgrades, while data-center developers value the ability to pre-commission power blocks that mirror the pacing of server deployments. Adoption is also buoyed by stricter environment, health, and safety rules that favor controlled manufacturing over field fabrication. Competitive pressure from price-aggressive regional players is pushing global suppliers toward flexible product tiers that balance cost and functionality, and the pending sulfur-hexafluoride phase-out is catalyzing a wider shift toward digital, SF₆-free switchgear.
Key Report Takeaways
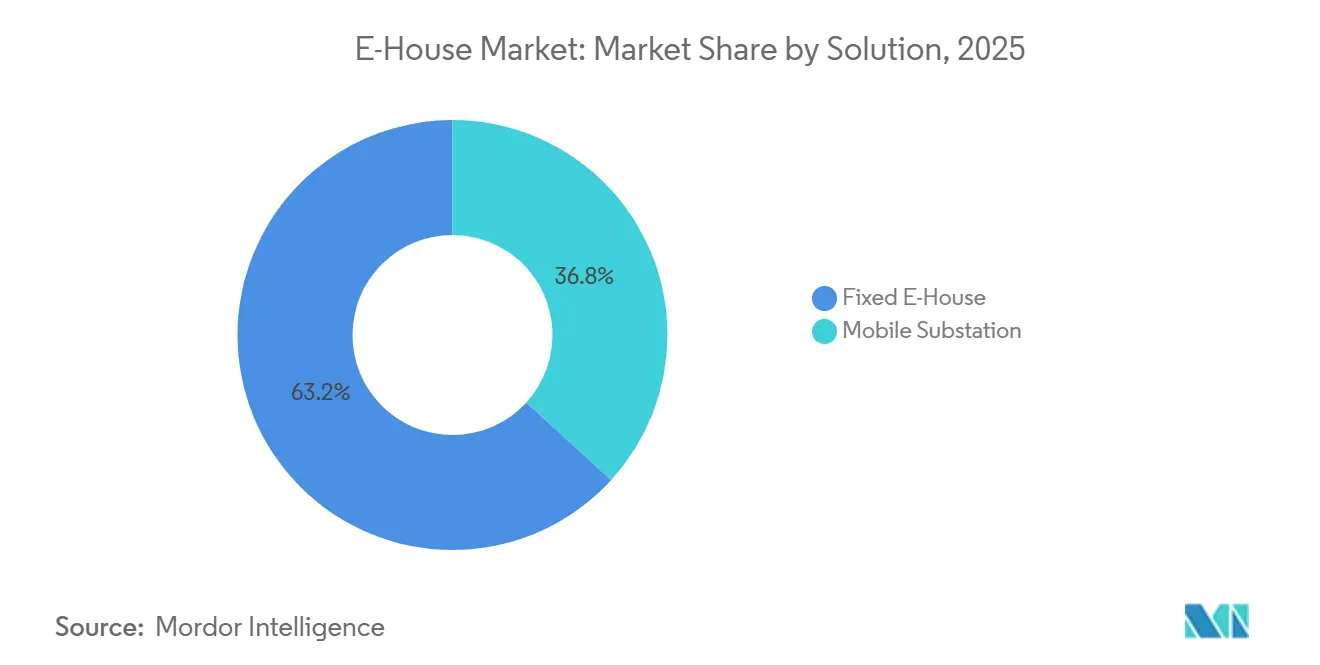
- By solution, fixed units captured 63.23% of 2025 revenue, whereas mobile substations are advancing at a 6.10% CAGR to 2031.
- By voltage rating, medium-voltage configurations held 55.81% of 2025 share, while high-voltage units are on track for a 7.60% CAGR through 2031.
- By application, utilities commanded 49.31% of 2025 revenue, yet data-center deployments are expanding fastest at an 8.14% CAGR to 2031.
- By component, switchgear led with 42.62% of 2025 revenue, and protection and control systems represent the fastest element, growing at an 8.31% CAGR.
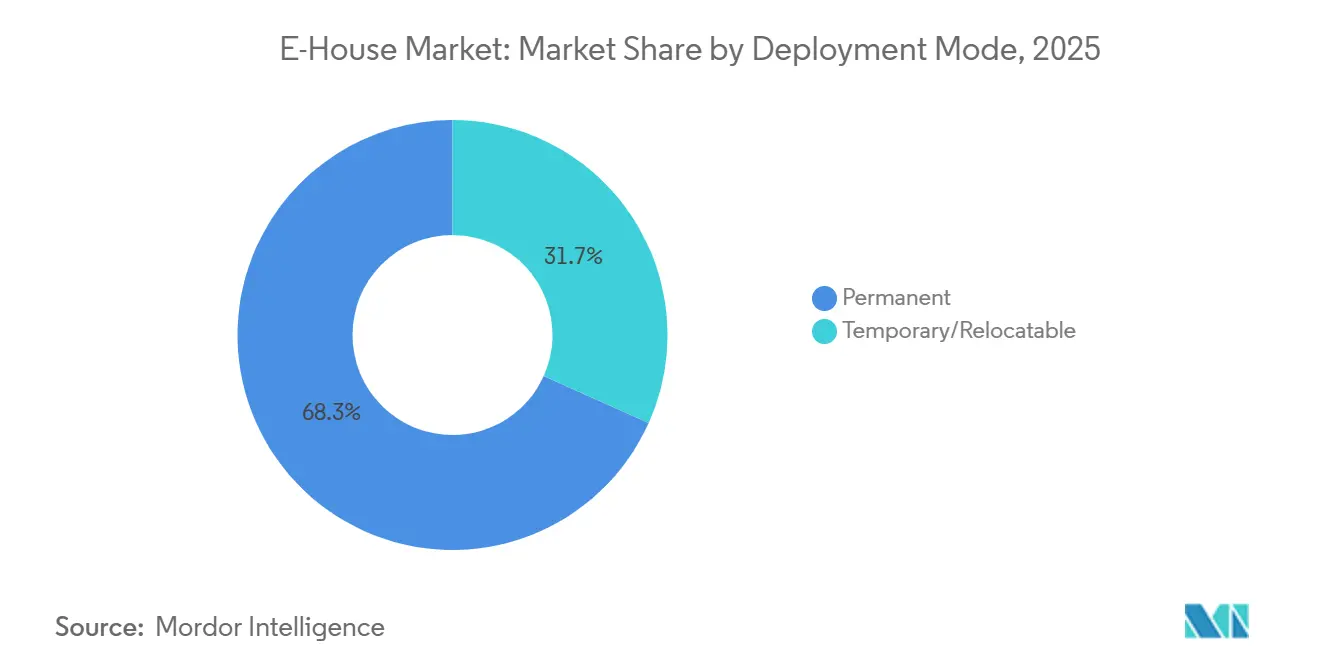
- By deployment mode, permanent installations accounted for 68.29% of 2025 revenue, but temporary and relocatable units are set to register a 5.99% CAGR to 2031.
- By geography, Asia-Pacific contributed 32.53% of global 2025 revenue, whereas the Middle East is forecast to post the highest regional CAGR of 9.42% through 2031.
Note: Market size and forecast figures in this report are generated using Mordor Intelligence’s proprietary estimation framework, updated with the latest available data and insights as of January 2026.
Global E-House Market Trends and Insights
Drivers Impact Analysis*
| Driver | (~) % Impact on CAGR Forecast | Geographic Relevance | Impact Timeline |
|---|---|---|---|
| Rapid expansion of renewable-energy projects requiring modular substations | +1.8% | Global, with concentration in APAC, Middle East, and South America | Long term (≥ 4 years) |
| Electrification of remote industrial and mining sites | +1.2% | APAC core, spill-over to Middle East and Africa, South America mining corridors | Medium term (2-4 years) |
| Replacement of SF₆ with eco-friendly GIS technologies | +0.9% | Global, EU and North America leading regulatory adoption | Short to Medium term (≤ 4 years) |
| Digitalization and remote monitoring for predictive maintenance | +0.8% | Global, with early gains in North America, Europe, and developed APAC markets | Medium term (2-4 years) |
| Demand for fast-deployable power for edge data-centers and 5G nodes | +0.7% | North America and APAC, urban and peri-urban clusters | Short term (≤ 2 years) |
| Resilience spending on modular grid assets for climate and cyber threats | +0.6% | Global, with priority in coastal and storm-prone regions | Medium to Long term (2-4+ years) |
| Source: Mordor Intelligence | |||
Rapid Expansion Of Renewable-Energy Projects Requiring Modular Substations
Utility-scale solar and wind installations are being completed 12–18 months faster than traditional substations, creating a timing gap that factory-built E-Houses bridge by reducing on-site commissioning to roughly one month.[1]Source: Hitachi Energy, “Grid-eXpand Modular Substation Solutions,” hitachienergy.com Saudi Arabia earmarked USD 7 billion in 2025 for grid links that incorporate standardized modules, and 22% of associated contracts already specify E-House designs. Similar policy moves in India, where 15 gigawatts of solar capacity tendered in 2025 carried mandatory modular substation clauses, demonstrate how procurement rules are institutionalizing the concept. Strong demand for 220 kilovolt and 400 kilovolt step-up units is feeding a 7.60% CAGR in the high-voltage segment through 2031. Developers now place E-House orders 9–12 months ahead of site preparation to secure factory slots, reflecting extended transformer lead times that reached 52 weeks in 2025.
Electrification Of Remote Industrial And Mining Sites
Operators in Australia, Chile, and sub-Saharan Africa are swapping diesel gensets for grid-connected E-House substations to curb fuel bills by roughly 45% and satisfy Scope 2 emission targets. Rio Tinto’s Pilbara mines introduced six mobile units in 2025, cutting diesel use by 180 million liters and avoiding 480,000 metric tons of CO₂-equivalent emissions.[2]Source: Rio Tinto, “Pilbara Electrification Program Reduces Diesel Use,” riotinto.com Temporary mobile designs, which represented 31.71% of 2025 revenue, suit exploration phases and are forecast to climb at 5.99% through 2031. Oil and gas producers in the Permian Basin report 25% lower completion costs after adopting electric-fracturing fleets powered by E-Houses. Schneider Electric’s microgrid integration, rolled out in 2025, enables demand-response income streams, proving that modular substations can double as active grid resources.
Replacement Of SF₆ With Eco-Friendly GIS Technologies
The European Union ban on sulfur hexafluoride in medium-voltage switchgear effective January 2026 has accelerated the transition to vacuum and dry-air solutions.[3]Source: European Commission, “Regulation on Fluorinated Greenhouse Gases,” ec.europa.eu ABB’s g³ portfolio attracted 340 orders in 2025, equal to 12% of the firm’s medium-voltage revenue. Siemens’ clean-air switchgear met IEC type-testing in 2025, and GE Vernova launched an SF₆-free E-House platform that captured 68 orders within nine months. Although compliance adds 8–12% to bill-of-materials cost, scale efficiencies are expected to bring parity with legacy designs by 2028. Utilities are therefore opting to replace whole modules rather than upgrade field-installed equipment, which minimizes outage windows.
Digitalization And Remote Monitoring For Predictive Maintenance
Grid operators are embedding IEC 61850-compliant relays and sensors that predict failures well before they occur. Schneider Electric’s Asset Advisor prevented unplanned outages by up to 40% across 1,200 substations as of end-2025. Eaton’s Brightlayer, integrated during the same period, streams busbar temperature and breaker-wear data to cloud dashboards. Regulatory mandates in North America now require critical fault data to reach control rooms within two seconds, a standard that analog relays cannot satisfy. Duke Energy’s deployment of 85 digitally enabled E-House units in 2025 produced a 22% cut in mean-time-to-repair. Suppliers offering integrated hardware-software packages earn 15–20% price premiums because utilities value the reduced operational risk.
Restraints Impact Analysis*
| Restraint | (~) % Impact on CAGR Forecast | Geographic Relevance | Impact Timeline |
|---|---|---|---|
| High upfront CAPEX and limited financing in developing nations | -1.5% | Emerging markets in Africa, South Asia, and Southeast Asia | Medium to Long term (2-4+ years) |
| Availability of low-cost containerised switchgear packages | -0.8% | Global, with a concentration in price-sensitive markets | Short to Medium term (≤ 4 years) |
| Logistical constraints in relocating large E-House modules | -0.5% | Global, acute in regions with underdeveloped transport infrastructure | Medium term (2-4 years) |
| Utility interconnection approval delays for mobile substations | -0.4% | North America, EU, and developed APAC markets with complex regulatory frameworks | Short term (≤ 2 years) |
| Source: Mordor Intelligence | |||
High Upfront CAPEX And Limited Financing In Developing Nations
Turnkey E-House substations cost 25–35% more than containerized assemblies, straining budgets where concessional capital is scarce. Nigeria’s transmission utility secured only 40% of its USD 1.2 billion modernization plan in 2025 because lenders hesitated to finance movable assets. Developers in Indonesia shifted 18 planned purchases to locally fabricated containers costing USD 800,000 each, compared with USD 1.3 million for European turnkey solutions. Because many jurisdictions refuse to treat mobile units as real estate, sponsors cannot pledge them as collateral, which pushes weighted-average funding costs up by 2–3 percentage points. Although the African Development Bank offered a USD 500 million guarantee facility in 2025, only 12 projects qualified due to protracted approval cycles.
Availability Of Low-Cost Containerised Switchgear Packages
Manufacturers such as TGOOD and LS Electric sell medium-voltage switchgear housed in shipping containers for USD 600,000–900,000, roughly 30% below full E-House solutions, and have taken 42% of India’s collector-substation awards in 2025. Even after factoring transformer and HVAC add-ons, total installed cost stays 15–20% lower. In response, Tier-1 players are releasing stripped-down variants that omit redundancy features but threaten to cannibalize premium lines. Utilities in Brazil and Mexico specify container packages for rural projects where ambient temperatures seldom exceed 35 °C, eliminating the need for climate control and saving USD 80,000–120,000 per site. The price gap is therefore sharpest in low-voltage settings below 1 kilovolt, where technical complexity is limited.
*Our forecasts treat driver/restraint impacts as directional, not additive. The impact forecasts reflect baseline growth, mix effects, and variable interactions.
Segment Analysis
By Solution: Mobile Units Gain Traction In Disaster-Recovery Fleets
Fixed designs dominated revenue at 63.23% in 2025, underscoring their role in long-life utility and industrial assets that justify deep foundations and 25-year HVAC systems. The E-House market share advantage reflects confidence in structures that support seismic loads and corrosive environments. Meanwhile, the mobile substation slice is projected to clock a 6.10% CAGR through 2031, propelled by utilities seeking rapid storm recovery and miners wanting relocatable power blocks.
Duke Energy enlarged its hurricane fleet to 42 trailer units in 2025, restoring service to 180,000 customers within 72 hours of Hurricane Helene. Leasing models priced at USD 35,000–50,000 per month from specialist rental firms further reduce capital strain for short-cycle users. Fixed platforms are also evolving: Siemens’ 2025 release allows operators to bolt on extra switchgear without downtime, preserving the fixed segment’s lead while offering modular flexibility.


By Voltage Rating: High-Voltage Segment Accelerates With Transmission Upgrades
Medium-voltage equipment between 1 kilovolt and 35 kilovolts held 55.81% of 2025 revenue, because most distribution substations fall within this band. The E-House market size for the medium bracket remains anchored by standardized IEEE and IEC designs that streamline procurement. High-voltage modules above 35 kilovolts, however, are expanding at a 7.60% CAGR as nations connect offshore wind and hydropower to distant load centers.
National Grid’s eight high-voltage units for the Dogger Bank project cut site work by 14 months. Low-voltage solutions serve specialist roles in data centers and hospitals, where arc-flash-rated switchgear such as ABB’s 2025 MNS iS delivers enhanced safety. Overall, harmonized seismic and electromagnetic rules published in 2024 make cross-border sourcing easier, accelerating growth at both ends of the voltage spectrum.
By Application: Data Centers Provide The Fastest Lift
Utilities remained the anchor at 49.31% of 2025 revenue, reflecting ongoing replacement of aging grid infrastructure. Yet hyperscale cloud providers are driving the highest growth, with data-center use cases on an 8.14% CAGR trajectory through 2031 as artificial-intelligence inference clusters demand sub-10-millisecond latency. Microsoft added 14 edge sites in 2025, each powered by dual-feed, 20 MVA E-House blocks.
Renewable developers are the next largest adopters, with Siemens delivering 92 collector units in Spain and Portugal during 2025. Oil and gas fleets, miners, and chemicals plants round out demand with niche requirements such as ATEX-certified enclosures. Together these diverse end-users underscore the broad functional reach of modular substations beyond the traditional utility sphere.
By Component: Protection Systems Outpace The Core Switchgear
Switchgear commanded 42.62% of 2025 revenue, anchoring the E-House market share for first-line protection elements. Nevertheless, digital relay packages are forecast to expand at an 8.31% CAGR because operators prioritize condition-based maintenance and two-second fault reporting. Transformers equipped with amorphous-metal cores, commercialized by Hitachi Energy in 2025, further reduce losses by close to 65%.
Busbar systems are shifting toward aluminum alloys that deliver 30% weight savings, trimming transport costs. HVAC and auxiliary modules are adopting variable-speed chillers and free-cooling economizers that cut energy use nearly in half. Uninterruptible power units now operate at 99% efficiency at mid-load, enabling designers to downsize cooling equipment and lower lifetime operating expense.
By Deployment Mode: Permanent Installations Retain A Wide Lead
Permanent projects delivered 68.29% of 2025 revenue, showing that most operators still favor assets with 25-year depreciation schedules. Foundations engineered for seismic resistance, anti-corrosion paint systems, and integrated fire suppression all reinforce this dominance. The E-House market size for temporary and relocatable designs, however, is slated to widen at a 5.99% CAGR, reflecting event power rentals and mining feasibility studies.
Aggreko grew its fleet to 180 mobile units in 2025, serving Western Australia mines, Middle East construction ventures, and post-disaster relief in Southeast Asia. Quick-disconnect couplings let crews dismantle and truck entire substations within 72 hours, suiting phased rollouts. Yet bridge weight limits and narrow roads restrict adoption in dense cities and mountain corridors, meaning fixed installations will continue to dominate heavy-load geographies.
By Component: Advanced Systems Drive Market Evolution
Switchgear still holds leadership at 38%, yet the rapid uptake of digital protection is redrawing the component value chain. Digital-twin diagnostics delivering 97% fault-detection accuracy validate the investment thesis for smart control packages. Transformers, buswork, and HVAC systems now integrate IoT sensors to feed condition-based maintenance dashboards.
Edge computing embedded in the relay rack allows sub-cycle decision-making independent of central SCADA, a critical feature for islanded microgrids. Cable routings are being redesigned as plug-in modules, facilitating factory-acceptance tests that cut on-site commissioning days by 50%. These shifts suggest the E-House market will reward vendors capable of bundling hardware, firmware, and cloud analytics as a unified offer.
Geography Analysis
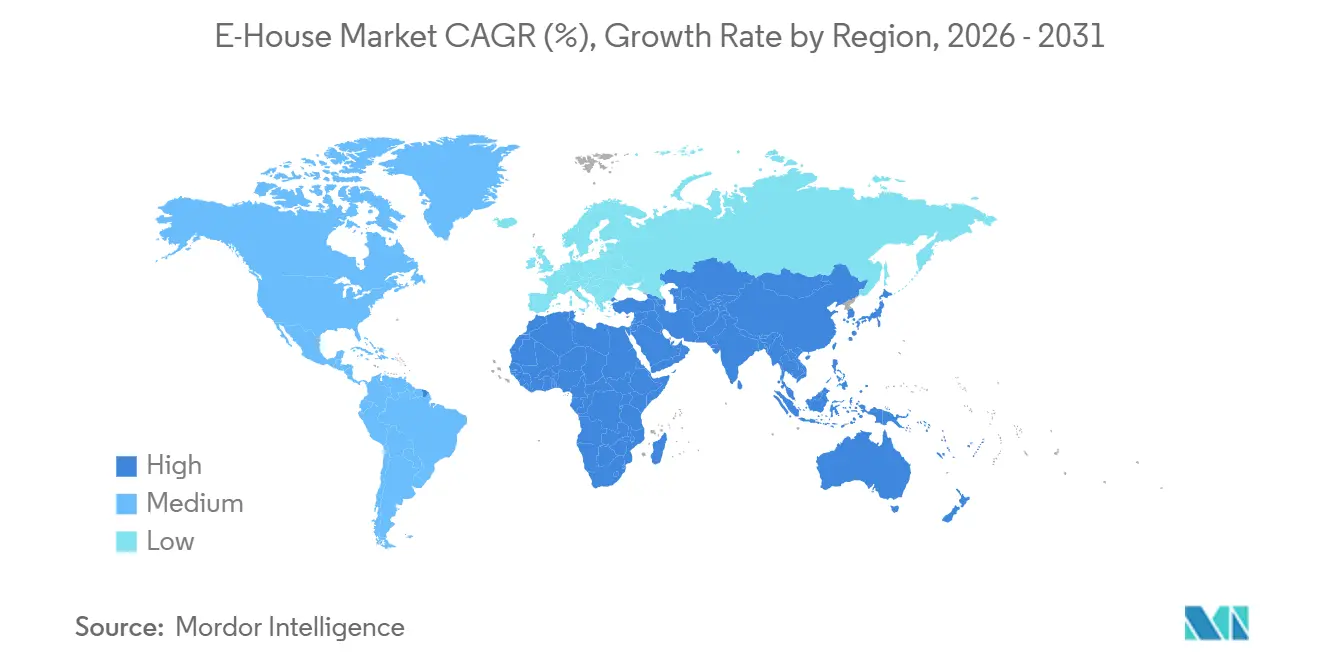
Asia-Pacific generated 32.53% of global E-House market revenue in 2025, underpinned by China’s USD 45 billion grid-reinforcement outlay and India’s hydrogen-linked renewables drive. State Grid of China installed 340 modular substations during the year to support cross-country power corridors. India’s Solar Energy Corporation incorporated E-House specifications in all 15 gigawatts of solar tenders launched in 2025, cutting execution risk and compressing schedules. Japan’s utility sector positioned 62 mobile units across earthquake zones, confirming that resilience planning is now a mainstream procurement criterion.
The Middle East is forecast to post a 9.42% CAGR through 2031, sustained by Saudi Arabia’s Vision 2030 backbone and the United Arab Emirates’ 75% clean-energy target. NEOM alone ordered 12 high-voltage modules for its 4 gigawatt hydrogen cluster in 2025. Qatar used modular substations to power cooling and desalination assets built for the FIFA World Cup. Africa’s uptake centers on South Africa, Nigeria, and Kenya, where Eskom contracted 14 units for renewable zones in 2025.
Europe and North America together held 45% of 2025 revenue, but regulatory momentum in the European Union, specifically the January 2026 SF₆ ban, positions the region as a technology bellwether. Germany’s Federal Network Agency cleared 28 offshore modules in 2025, each compliant with clean-air GIS rules. In North America, Duke Energy, National Grid, and Pacific Gas and Electric completed large-scale rollouts of IEC 61850 relays that slashed fault-reporting times. South America’s growth pivots on Brazilian and Chilean solar-plus-storage projects that now specify relocatable E-Houses to match incremental buildouts.

Regulatory Landscape
The market is increasingly shaped by safety, grid-code, and environmental compliance, which tends to favor factory-assembled, pre-tested power modules over field-built substations. A key global anchor is the European Union restriction on sulfur hexafluoride (SF6) for medium-voltage switchgear effective January 2026. This is accelerating adoption of vacuum and dry-air alternatives inside E-Houses and is pushing utilities toward whole-module replacement decisions to minimize outage windows.
Interconnection approvals and digital-protection requirements also affect E-House specifications for regulated utility deployments, particularly where fast fault-reporting and IEC 61850-based protection and control architectures are required. On the procurement side, government-linked tendering for renewables is formalizing modular-substation requirements in several markets, including 2025 solar tenders in India that included modular substation clauses. That process reinforces standardized designs, factory acceptance testing, and compliance-driven documentation as differentiators for global OEMs and regional assemblers.
Competitive Landscape
Global concentration remains moderate: the top five suppliers, ABB, Siemens, Schneider Electric, Eaton, and GE Vernova, controlled roughly half of 2025 revenue. Their edge lies in vertically integrated transformer and gas-insulated switchgear manufacturing, which safeguards margins in capital-intensive high-voltage orders. Regional assemblers, particularly in China, erode pricing at the medium-voltage level by bundling containerized packages that come in 25–35% cheaper, pushing incumbents to offer value-strip variants.
Technology differentiation now hinges on digital overlays and SF₆-free designs. Schneider Electric’s EcoStruxure suite and Eaton’s Brightlayer platform deliver cloud analytics that foresee transformer failures six to nine months in advance, allowing suppliers to charge 15–20% premiums. ABB’s 2025 patent for temperature-sensing busbars exemplifies incremental hardware innovation. GE Vernova’s g³-ready line found rapid market uptake because utilities face statutory phase-out clocks.
Business models are broadening. Aggreko and United Rentals popularized 12-month leasing at USD 35,000–50,000 per month for 15 MVA trailers, drawing miners and event organizers who balk at outright purchase. Joint ventures such as Siemens and Bechtel’s 2025 partnership illustrate how engineering, procurement, and construction firms blend with OEMs to capture single-source contracts from data-center hyperscalers. White-space potential persists in sub-Saharan Africa and Southeast Asia, where slow grid extensions create a niche for relocatable assets that stand in until permanent infrastructure arrives.
E-House Industry Leaders
ABB Ltd.
Siemens AG
Eaton Corporation Inc.
Schneider Electric SE
Electroinnova S.L.
- *Disclaimer: Major Players sorted in no particular order

Market Opportunities and Future Outlook
A near-term opportunity is emerging around compliance-driven retrofit cycles and fleet standardization as utilities and industrial operators move away from SF6-containing switchgear and refresh protection and control systems. The EU SF6 restriction effective January 2026, along with commercial momentum in SF6-free portfolios, is contributing to whole-module replacement decisions where outage windows and site constraints make like-for-like upgrades less practical. Examples include ABBs g3 order traction in 2025 and GE Vernovas activity around an SF6-free E-House platform.
Faster-build power blocks for data centers and industrial electrification also widen whitespace for suppliers that bundle factory-integrated switchgear, transformers, and digital monitoring into repeatable platforms. Market evidence points to hyperscalers deploying standardized E-House power blocks, such as Microsoft adding edge sites in 2025 with dual-feed 20 MVA blocks, and to utilities scaling digitally enabled substations, including Duke Energy deploying digitally enabled E-House units in 2025 with measurable maintenance-response gains. Separately, remote mining and oilfield electrification programs, such as Rio Tintos Pilbara mobile units in 2025, are expanding demand for relocatable designs and for service-led offers like leasing and predictive-maintenance packages where capital constraints and interconnection lead times increase the operational value of modular, pre-commissioned assets.
Recent Industry Developments
- July 2026: ABB expanded its partnership with VoltaGrid to support data center power projects, adding integrated eHouse units alongside additional synchronous condenser and flywheel technology. The update links prefabricated electrical infrastructure to fast-deploy microgrid-style capacity for hyperscale and edge builds, reinforcing the use of factory-integrated power blocks in data center schedules.
- October 2025: Eaton acquired a 60% stake in Zest WEGs South African unit for USD 240 million, strengthening access to mining and industrial electrification customers in the region. The acquisition improves local execution capacity and broadens Eatons ability to supply modular substations and adjacent power equipment into African mining corridors.
- January 2024: Duke Energy advanced utility deployment of digitally enabled E-House substations using IEC 61850-aligned protection and control architectures to improve fault visibility and restoration workflows. The rollout reflects how digital overlays are becoming a procurement requirement in modular substations, supporting premium pricing for integrated hardware-software offerings.


Research Methodology Framework and Report Scope
Market Definition and Coverage
This market covers revenue generated from prefabricated electrical houses (E-Houses) that are engineered, assembled, and tested in a controlled facility, then shipped as a ready-to-install power and control enclosure for industrial and utility sites.
Scope exclusions: rental E-House fleets, battery-only containers, and permanent concrete substations are excluded from the numbers.
Segmentation Overview
- By Solution
- Fixed E-House
- Mobile Substation
- By Voltage Rating
- Low Voltage (≤1 kV)
- Medium Voltage (1–35 kV)
- High Voltage (>35 kV)
- By Application
- Utilities
- Industrial
- Oil and Gas
- Mining and Minerals
- Chemicals
- Data Centres
- Renewables (Solar/Wind)
- Other Industrial Applications
- By Component
- Switchgear
- Transformer
- Busbar and Cables
- Protection and Control Systems
- HVAC and Auxiliary Systems
- Others
- By Deployment Mode
- Permanent
- Temporary/Relocatable
- By Geography
- North America
- United States
- Canada
- South America
- Brazil
- Argentina
- Mexico
- Rest of South America
- Europe
- Germany
- United Kingdom
- France
- Italy
- Spain
- Rest of Europe
- Asia Pacific
- China
- Japan
- South Korea
- India
- Australia
- New Zealand
- Rest of Asia-Pacific
- Middle East and Africa
- Middle East
- United Arab Emirates
- Saudi Arabia
- Turkey
- Rest of Middle East
- Africa
- South Africa
- Nigeria
- Kenya
- Rest of Africa
- Middle East
- North America
Data Sources, Market Sizing, and Validation
Desk Research
For the desk stage, we start by aligning on how E-Houses are described and sold, then we build a fact base around demand drivers and project activity. Public sources we use include International Energy Agency (IEA) materials for power investment direction, US Energy Information Administration (EIA) data for generation and grid indicators, and World Bank reporting to anchor industrial output context.
We also reference UN Comtrade for trade flows tied to electrical equipment categories that are commonly shipped with E-Houses, and International Electrotechnical Commission (IEC) references to understand the common technical boundaries. Company filings, investor presentations, and industry press help map product language and typical delivery models. Where needed, we use paid subscriptions for company financials and intelligence, patent databases, and shipment-level import-export views to sanity-check directional demand. These examples are not exhaustive, and other public sources were also used to collect, validate, and clarify data points.
Primary Interviews and Surveys
Primary work was used to pressure-test the size model through interviews and structured surveys with E-House manufacturers, EPCs, switchgear and automation integrators, and end users in utilities and heavy industries. Because this is a global market, inputs were gathered across APAC, EMEA, and the Americas to cross-check pricing, lead times, and project pipelines across the main demand centers.
Distribution of primary research fieldwork respondents
| Company type | Respondent position | Region |
|---|---|---|
| Top tier: 25% | CXOs: 16% | APAC: 41% |
| Mid tier: 57% | Functional/Unit leaders: 28% | EMEA: 35% |
| Smaller Players: 18% | Managers: 56% | Americas: 24% |
Market-Sizing & Forecasting
Sizing starts from a top-down build where power and industrial project activity is translated into an addressable pool for prefabricated electrical rooms, then filtered by adoption patterns for factory-built solutions. To keep totals realistic, we run selective bottom-up checks using sampled project counts by region, typical configuration values, and channel feedback on the share delivered as a packaged E-House versus a traditional on-site build.
Key inputs used (illustrative) include new renewables and grid connection additions, mining and metals capex cycles, large industrial expansion projects, typical E-House content per project, average selling price ranges by voltage level, and lead-time and utilization trends reported by suppliers. When data was not available for smaller countries, we handle gaps using proxy indicators such as industrial output growth and known project pipelines, then normalize results back to regional totals.
For forecasting, scenario analysis is applied around project pipeline and the timing of utility and industrial investments, and assumptions are adjusted after primary discussions on pricing movement and backlog conversion. The output is also checked for year-to-year continuity so the final curve does not jump unless a demand driver supports it.
Data Validation & Update Cycle
Validation is done in steps, so we do not rely on a single data stream. Model outputs are triangulated against independent signals such as large-project announcements, trade movement of related electrical equipment categories, and regional capacity and build-out indicators, with variances flagged for review.
Before sign-off, the estimates go through internal analyst checks where unusual growth rates, price assumptions, and regional splits are revisited. If needed, respondents are re-contacted to confirm the driver behind the change. Reports are refreshed annually, and interim updates are made when material events affect demand, supply, or pricing. Right before delivery, a final pass is completed so clients receive the most current view available at that time.
Mordor Intelligence's E House Market Size Compared Against Other Published Estimates
Published E-House market values do not always match because each publisher draws the line differently on what is counted as an E-House sale and which year is treated as the baseline. Differences also come from how pricing is treated across regions, and whether numbers are refreshed when project pipelines and lead times shift.
Rental fleets and battery-only containers sit outside Mordor Intelligence's scope, and this exclusion alone can move totals when other estimates treat temporary power blocks and containerized energy storage as part of the same spend bucket. Other gaps typically come from mixing permanent substation builds with factory-tested modules, applying one global price curve without voltage-level adjustment, or using aggressive pipeline conversion rates that are not checked back with EPC and end-user feedback.
Benchmark comparison
| Source | Market Size | Gaps in Research Methodology |
|---|---|---|
| Mordor Intelligence | USD 1.80 B (2026) | |
| Industry Publisher A | USD 1.72 B (2024) | Uses an earlier base year and does not clearly separate E-Houses from adjacent modular electrical enclosures, which can shift pricing and project mix when rolled into one total. |
| Industry Publisher B | USD 1.86 B (2025) | Base year differs and the scope notes are less explicit on excluding rental fleets and battery-only containers, which can lift the spend total in regions with higher temporary power demand. |
The table shows that most of the spread is explained by year selection and by whether adjacent containerized solutions are counted inside the same market. By keeping inputs tied to project activity, voltage-linked pricing, and repeatable inclusion rules, we can deliver a market value that is easier to trace back to real demand drivers.


Key Questions Answered in the Report
What is the projected size of the E-House space by 2031?
It is forecast to reach USD 2.40 billion in 2031, advancing at a 5.86% CAGR from 2026.
Which region is expected to post the fastest growth over the next five years?
The Middle East is on track for roughly a 9.42% CAGR through 2031, lifted by Vision 2030 transmission build-outs and large hydrogen projects.
Why are data-center operators turning to modular substations?
Factory-assembled power blocks synchronize with rapid server rollouts and support the sub-10-millisecond latency that artificial-intelligence workloads demand.
How is the European sulfur-hexafluoride ban reshaping equipment designs?
Vendors are shifting to vacuum and dry-air switchgear, which adds about 8–12% to materials cost yet removes SF₆ leakage risk and ensures regulatory compliance.
Page last updated on:






