
EHealth Market Size and Share
Market Overview
| Study Period | 2020 - 2031 |
|---|---|
| Market Size (2026) | USD 317.64 Billion |
| Market Size (2031) | USD 661.35 Billion |
| Growth Rate (2026 - 2031) | 15.78 % |
| Fastest Growing Market | Asia Pacific |
| Largest Market | North America |
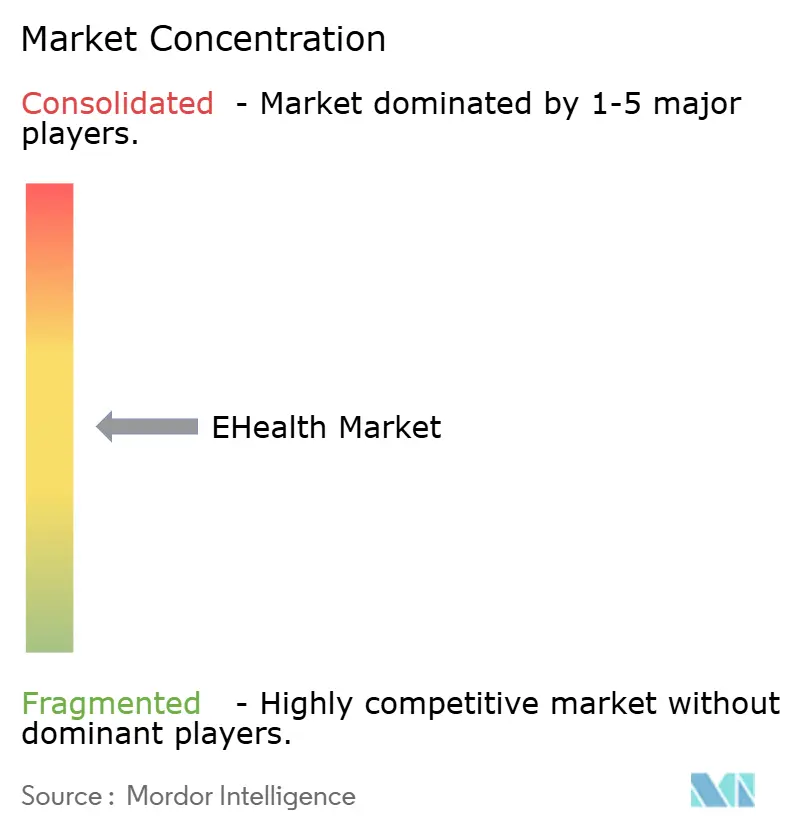
| Market Concentration | Medium |
Major Players *Disclaimer: Major Players sorted in no particular order Image © Mordor Intelligence. Reuse requires attribution under CC BY 4.0. | |
EHealth Market Analysis by Mordor Intelligence
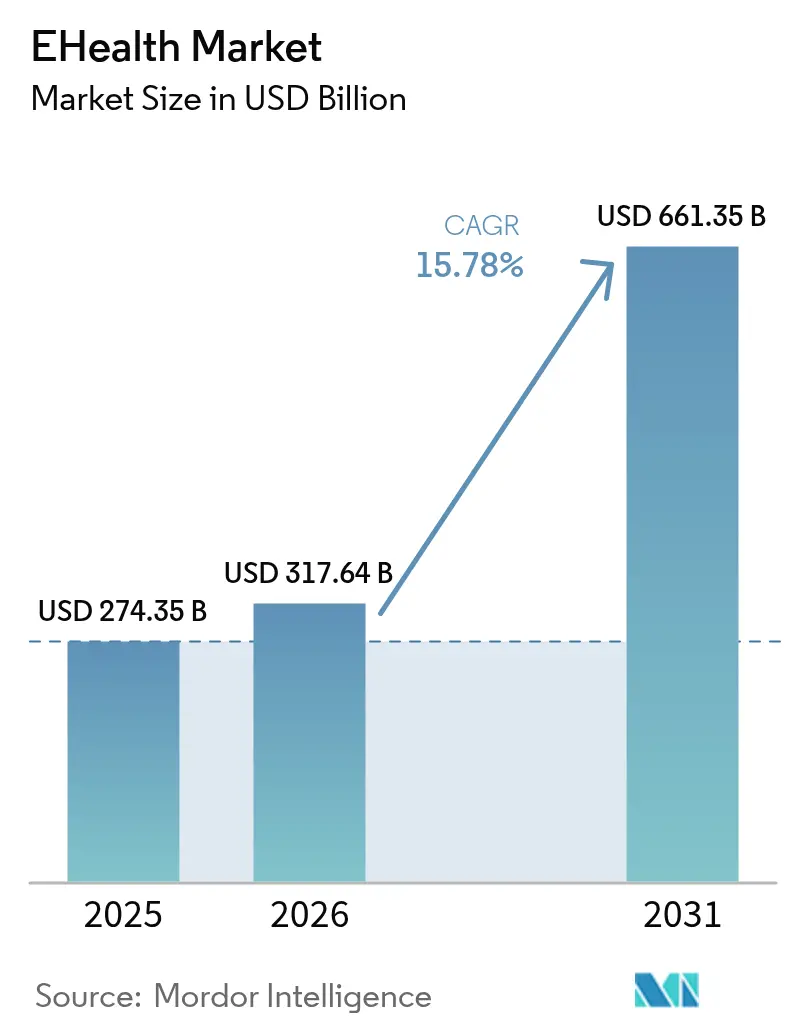
The eHealth market size was valued at USD 274.35 billion in 2025 and estimated to grow from USD 317.64 billion in 2026 to reach USD 661.35 billion by 2031, at a CAGR of 15.78% during the forecast period (2026-2031). This performance stems from rapid gains in connectivity, favorable legislation, and sustained investment in digital-first care pathways that let providers scale services without proportional increases in staff or physical infrastructure. Rising reimbursement for remote monitoring, wider 5G rollouts, and the integration of generative-AI assistants into clinical workflows further expand the addressable patient base, while growing consumer acceptance anchors long-run demand. Health-system mergers now dedicate high capital to IT modernisation, illustrating that digital capabilities have shifted from “nice to have” to “mission critical.” Still, data-security incidents and interoperability gaps temper near-term growth ambitions and oblige new spending on cyber-risk mitigation and data-exchange standards.
Key Report Takeaways
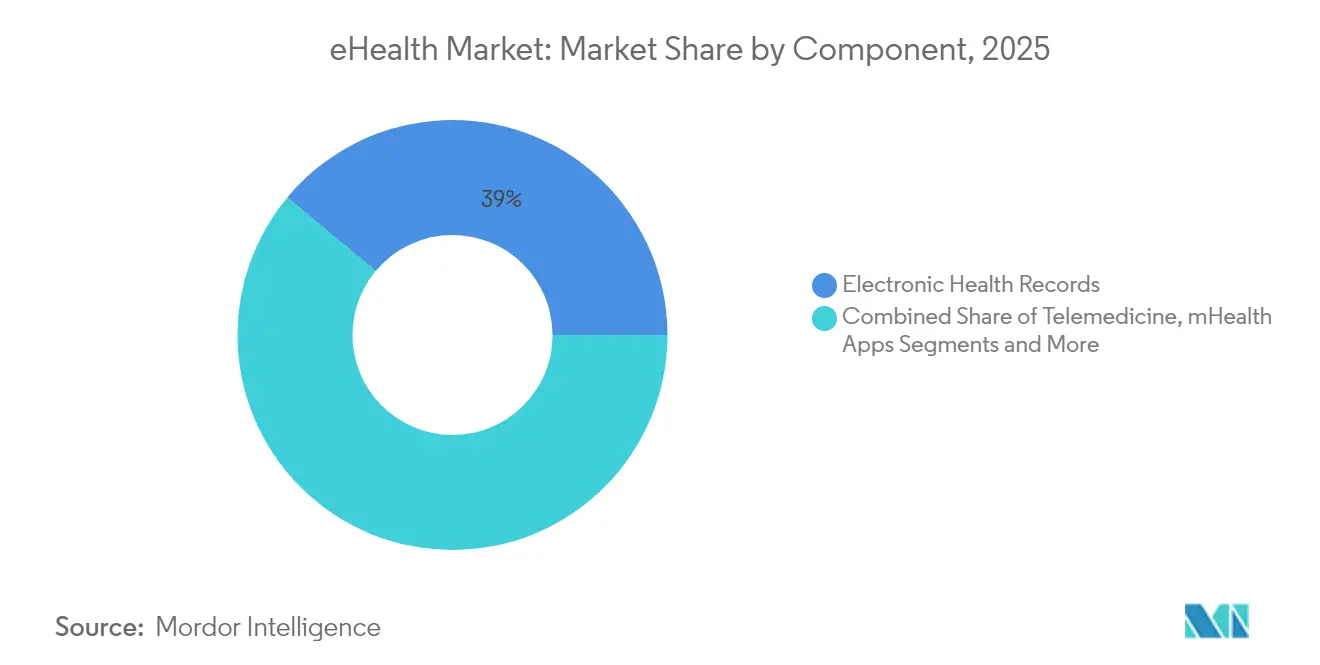
- By component, Electronic Health Records led with 38.95% revenue share in 2025; Telemedicine is poised for a 19.89% CAGR through 2031.
- By delivery mode, cloud-based platforms captured 52.10% of 2025 revenue, while hybrid solutions are projected to expand at 22.20% CAGR to 2031.
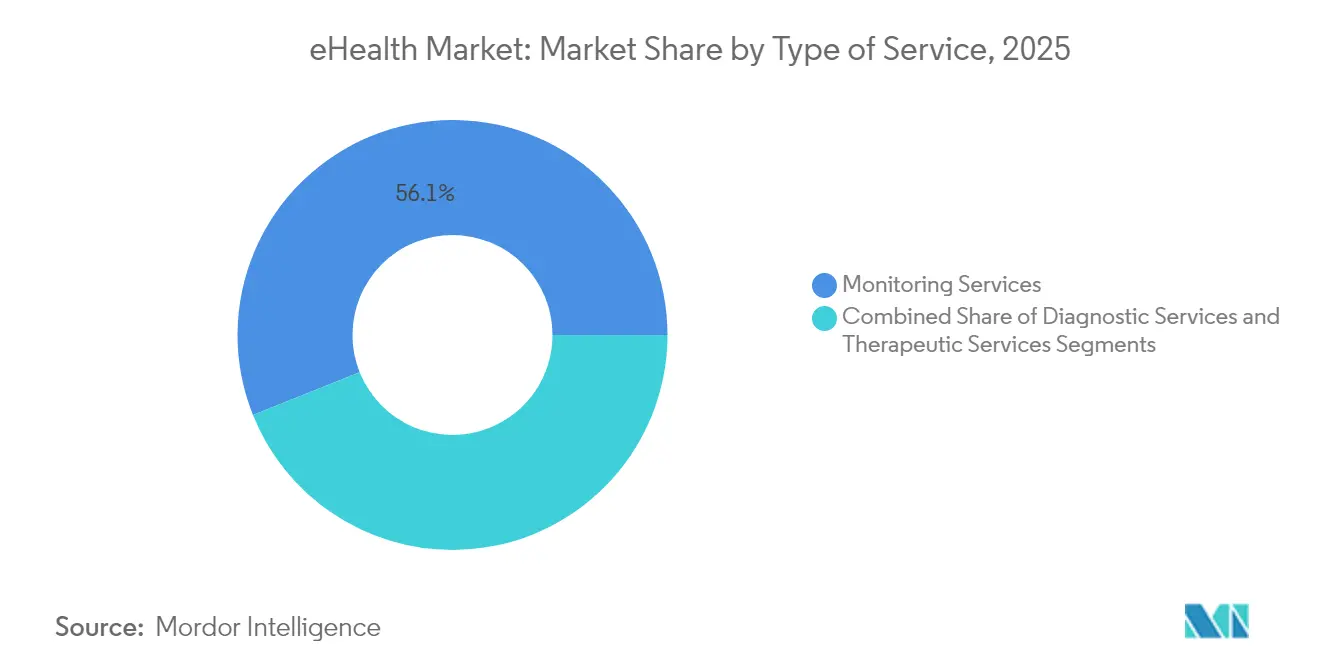
- By service type, monitoring accounted for 56.07% of 2025 revenue; diagnostic services are forecast to rise at an 18.28% CAGR to 2031.
- By end user, hospitals and health systems held 52.30% of 2025 revenue, yet patients and individual consumers are set for 19.32% CAGR through 2031.
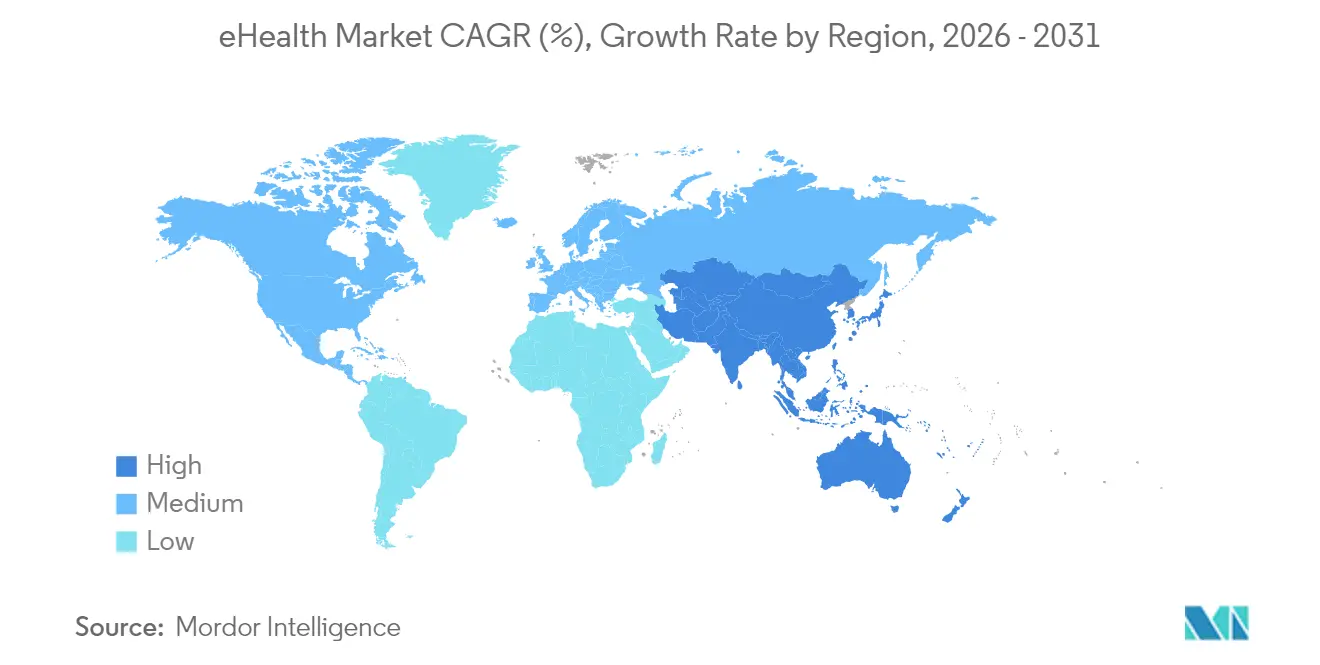
- By geography, North America commanded 42.35% 2025 revenue, whereas Asia-Pacific is expected to deliver the fastest 20.22% CAGR to 2031.
Note: Market size and forecast figures in this report are generated using Mordor Intelligence’s proprietary estimation framework, updated with the latest available data and insights as of 2026.
Market Trends and Insights
Drivers Impact Analysis of EHealth Market*
| Driver | (~) % Impact on CAGR Forecast | Geographic Relevance | Impact Timeline |
|---|---|---|---|
| Government Incentives For Digital Health Adoption | +4.2% | Global, with early gains in US, EU, Australia | Medium term (2-4 years) |
| Growing Prevalence Of Chronic Diseases Demanding Remote Monitoring | +3.8% | Global, concentrated in aging populations | Long term (≥ 4 years) |
| Expansion Of High‐Speed Connectivity (5G) Enabling Telehealth | +2.9% | APAC core, spill-over to North America & EU | Short term (≤ 2 years) |
| Integration Of Generative-AI Copilots Into EHR Workflows | +3.1% | North America & EU, expanding to APAC | Medium term (2-4 years) |
| Emergence Of Retail & Big-Tech Virtual Clinics | +2.3% | North America, selective expansion globally | Short term (≤ 2 years) |
| Source: Mordor Intelligence | |||
Government Incentives For Digital Health Adoption
Financial carrots and regulatory sticks continue to accelerate eHealth market penetration. The HTI-2 rule finalized by the U.S. Department of Health and Human Services penalizes information blocking and forces tighter interoperability, spurring hospital demand for standards-compliant upgrades[1]. Meanwhile, the European Health Data Space secured EUR 810 million to harmonize data exchange across 27 member states, offering vendors a single continental entry point. Australia’s 2023-2028 National Digital Health Strategy funds interoperability layers that link federal registries to state systems. Collectively, these programs shorten sales cycles, provide direct subsidy pools, and cement the convening power of governments in setting technical baselines. As compliance dates approach, provider budgets increasingly prioritize certified platforms, creating a pull-through effect for integration consultancies and cybersecurity vendors. The visible policy pipeline increases investor confidence, keeping capital flows robust even in tighter macro conditions.
Growing Prevalence Of Chronic Diseases Demanding Remote Monitoring
Rising incidence of diabetes, hypertension, and COPD shifts care toward continuous at-home oversight and generates recurring device and analytics revenues. Remote patient monitoring adoption reached 81% of U.S. clinicians by 2023 and delivered a 76% drop in 30-day readmissions among high-risk cohorts. Teladoc Health reports a threefold rise in diabetes-member engagement and a 0.4 reduction in A1c through predictive nudges, underscoring clinical validity. Wearable shipments are tracking 55% annual growth as sensors graduate from fitness tracking to FDA-cleared medical functionality. As insurers expand reimbursement codes, device makers bundle AI-powered triage layers that flag deterioration early and escalate only when clinically necessary, trimming utilization costs. High-speed cellular connectivity broadens eligible populations in rural areas, while cloud-native dashboards lower IT overhead for small practices, opening fresh sub-segments of the eHealth market.
Expansion Of High-Speed Connectivity (5G) Enabling Telehealth
Ultra-reliable low-latency networks unlock real-time use cases such as telesurgery and edge-based imaging analysis. The world’s first 5G remote robotic transcervical thyroidectomy linked surgeons 1,500 km apart with 99 ms latency, validating clinical safety thresholds[2]. University hospitals in Düsseldorf and Boston deployed private 5G to reduce packet loss that can jeopardize patient monitoring. Europe’s federally funded 6G Health consortium now tests augmented-reality assisted rounds, indicating a longer-run roadmap beyond current commercial networks. As spectrum auctions widen, rural broadband pilots in India and Indonesia demonstrate cost-effective tele-ICU models, reducing urban overflow. Vendors able to certify medical-grade network equipment gain a defensible niche while cloud platforms race to localize edge nodes for compliance. Collectively, improved bandwidth raises service quality thresholds and cements video consultation as a mainstream care modality rather than an emergency substitute.
Integration Of Generative-AI Copilots Into EHR Workflows
Large-language models embedded in clinical systems promise to convert onerous documentation into short voice commands and auto-drafted encounter notes. Stanford Health Care’s ChatEHR lets clinicians query patient histories conversationally, an early proof that search and summarization can shave hours off charting time. Oracle’s Clinical Digital Assistant integrates ambient voice capture to populate structured fields, tackling a pain-point cited by 41% of providers who spend over four hours daily on paperwork. GE HealthCare is co-building foundation models on AWS to accelerate imaging-workflow coding and reduce development cycles. Early pilots show documentation time savings near three hours per shift and improved accuracy, indirectly expanding appointment capacity. Regulatory sandboxes in the UK and Singapore fast-track clinical validation, pushing vendors to bake in bias-mitigation and audit trails from day one. These copilots are now a primary differentiator in EHR renewals, shaping a new competitive frontier across the eHealth market.
Restraints Impact Analysis of EHealth Market*
| Restraint | (~) % Impact on CAGR Forecast | Geographic Relevance | Impact Timeline |
|---|---|---|---|
| Data Security & Privacy Concerns | -2.1% | Global, heightened in EU due to GDPR | Long term (≥ 4 years) |
| Interoperability Challenges Among Disparate Systems | -1.8% | Global, acute in fragmented markets | Medium term (2-4 years) |
| AI Algorithm Liability & Malpractice Insurance Gaps | -1.4% | North America & EU, emerging in APAC | Medium term (2-4 years) |
| Source: Mordor Intelligence | |||
Data Security & Privacy Concerns
Cyber incidents reached a record 677 major breaches in 2024, affecting 182.4 million individuals and highlighting persistent attack-surface expansion as devices proliferate. The Change Healthcare ransomware event alone disrupted claims processing nationwide, underscoring the systemic nature of third-party dependencies. Health records command premium dark-web prices because they carry immutable personal identifiers, attracting both cybercriminals and nation-state actors. The HHS cybersecurity strategy now proposes new HIPAA Security Rule standards, while the Health Care Cybersecurity Improvement Act offers funding for small practices to upgrade tools. EU regulators impose heavy fines for GDPR lapses, forcing multinationals to engineer data-minimization workarounds. Ongoing vulnerability management costs and rising cyber-insurance premiums erode margins, causing some providers to defer non-critical digital projects and slowing overall eHealth market adoption.
Interoperability Challenges Among Disparate Systems
A decade of policy pushes lifted U.S. hospital participation in data exchange from 23% to 70%, yet only 47% of clinicians report easy access to external patient information. Data-standard inconsistencies, vendor-specific APIs, and cost barriers hamper smaller practices more severely, perpetuating information silos. The Draft Federal FHIR Action Plan outlines a common interface approach, but implementation requires skilled development resources in short supply[3]. Internationally, the European Health Data Space sets ambitious unification goals, yet cross-border data portability still confronts linguistic, ethical, and consent hurdles. Fragmentation complicates longitudinal analytics and undermines AI model accuracy, prompting payers and life-science companies to invest in data-normalization layers that inflate project costs. Until harmonization improves, the friction-filled ecosystem will clip a portion of the forecast CAGR for the eHealth market.
*Our forecasts treat driver/restraint impacts as directional, not additive. The impact forecasts reflect baseline growth, mix effects, and variable interactions.
EHealth Market Segment Analysis
By Component:
EHR Dominance Meets Telemedicine AccelerationElectronic Health Records generated the largest 38.95% share of the eHealth market in 2025 as regulatory compliance, incentives, and enterprise-grade functionality kept procurement pipelines robust. Cloud-enabled upgrades bundled with analytics and population-health modules have renewed growth, while embedded generative-AI copilots from Epic and Oracle compress documentation time and attract multi-year license renewals. The component’s lead positions vendors to cross-sell revenue-cycle and clinical-decision add-ons, sustaining average deal sizes. Telemedicine posted the fastest 19.89% CAGR outlook because post-pandemic consumer familiarity, payment parity laws, and scalable video infrastructure lowered adoption barriers. Amazon’s consolidation of Clinic into One Medical signals that platform integration and national brand trust will dictate competitive advantage going forward.
Fast-moving mHealth apps combine smartphone cameras, edge AI, and low-cost sensors to support dermatology, ophthalmology, and mental-health triage, deepening consumer engagement. Clinical Decision Support tools embedded in imaging platforms record higher sensitivity and specificity, reinforcing demand for algorithm training datasets. e-Prescribing exhibits steady expansion under mandatory electronic-controlled-substance regulations, but remains hampered by inconsistent pharmacy system upgrades. Together, diversified component innovation keeps the eHealth market vibrant and spurs ecosystem partnerships.

By Delivery Mode:
Cloud Leadership Drives Hybrid InnovationCloud platforms supplied 52.10% of 2025 revenue and anchor modernization roadmaps because they eliminate capital-intensive data centers and power automatic patching, essential to cyber-risk management. Microsoft Cloud for Healthcare exemplifies how shared responsibility models and responsible-AI toolchains de-risk adoption while compressing deployment timelines. Hybrid solutions, however, hold the fastest 22.20% CAGR forecast, reflecting provider desire to retain sensitive workloads on-premise while off-loading non-PHI analytics to hyperscale services. Vendors now pre-package connectors that let organizations shuttle data across environments without refactoring legacy code, smoothing migration trajectories.
On-premise deployments persist in military hospitals, genomic research institutes, and jurisdictions mandating data localization, though their eHealth market share continues to erode as total cost of ownership rises. The hybrid paradigm also aids multi-cloud strategies, preventing lock-in and aligning compute location with regulatory risk profiles. As cloud regions proliferate and sovereign-cloud offerings mature, the addressable base for fully managed subscriptions expands further, reinforcing a long-run shift toward consumption-based pricing models.
By Type of Service:
Monitoring Prevalence Supports Diagnostic ExpansionMonitoring services represented 56.07% revenue in 2025, propelled by Medicare reimbursement and chronic-condition prevalence. Remote Patient Monitoring platforms demonstrated a 76% fall in 30-day readmissions, underscoring economic value to payers and hospitals. The segment’s dominance anchors the largest eHealth market size contribution among all service categories. AI-powered dashboards triage alerts, enabling clinicians to oversee larger patient panels without quality loss.
Diagnostic services hold the fastest 18.28% CAGR as AI models shorten radiology turnaround and boost detection accuracy. Tele-radiology benefits from 5G transfer speeds that support high-resolution imaging, while tele-pathology leverages digital microscopy for expert remote reads. Therapeutic and other services, including digital therapeutics and virtual rehabilitation, grow from a small base amid reimbursement uncertainties but gain credibility from FDA clearances. Balanced growth across service lines diversifies revenue sources and improves the resilience of the overall eHealth market.
By End User:
Hospital Systems Anchor Consumer GrowthHospitals and health systems contributed 52.30% of 2025 revenue and remain the backbone customers because they control large budgets and must meet statutory data-sharing obligations. M&A activity, such as Sanford-Marshfield’s USD 500 million IT modernization, showcases capital allocation toward integrated platforms that consolidate clinical, revenue-cycle, and population-health modules. Their scale requirements sustain multi-year enterprise deals and service contracts.
Patients and individual consumers post a 19.32% CAGR, the fastest among end users, propelled by subscription telehealth, home-testing kits, and wellness ecosystems. Retailers like Costco and Best Buy bundle primary-care visits and connected devices, illustrating shifting power toward consumer-directed channels. Payers invest in digital engagement portals that integrate benefits navigation with condition-management programs, while pharma sponsors digital endpoints to accelerate decentralized trials. The expanding consumer base spreads the eHealth market’s risk profile and compels interface simplicity and omni-channel access.
Geography Analysis
North America EHealth Market
North America produced 42.35% of 2025 revenue, driven by mature reimbursement frameworks, a high clinician-to-patient ratio, and aggressive investment in AI-enabled clinical decision support. The HTI-2 rule and federal AI strategic plan signal long-term regulatory stability, encouraging provider spending and venture capital inflows. Canada advances provincial interoperability initiatives, and cross-border telehealth partnerships allow winter-surge overflow management, while Mexico scales cloud-hosted records to underserved regions. Ongoing cyber-attacks remain a regional restraint, prompting higher security budgets that inflate total cost of ownership for eHealth deployments.
APAC EHealth Market
Asia-Pacific delivers the highest 20.22% CAGR, with China’s 5G medical pilots, India’s insurance-backed digital health stack, and Australia’s federally funded interoperability plan as key accelerants. Successful remote robotic surgery across 1,500 km in China validates ultra-low-latency care models and burnishes national AI ambitions bmc. Singapore embeds IoT sensors into public-hospital wards for predictive analytics, while Thailand pursues virtual-care to bridge specialist shortages. Government-led sandbox programs streamline approvals and shorten commercial lead times, sustaining investor confidence in the region’s eHealth market.
Broader European Markets
Europe maintains steady expansion anchored by EUR 810 million earmarked for the European Health Data Space and the risk-based EU AI Act slated for phased compliance by 2027. Germany’s 6G Health project positions Europe at the forefront of next-generation connectivity, and the UK’s sector-specific AI governance introduces differentiated oversight paths for clinical algorithms. Nordic nations pilot personal-data wallets that give citizens granular consent controls, while Southern European providers upgrade cloud capacity to offset clinician shortages. The regulatory push for trust and safety enhances adoption intent but also raises compliance costs, compelling smaller vendors to seek partnership or acquisition.
Competitive Landscape
The eHealth market features a converging field where legacy EHR vendors, big-tech entrants, and AI-first start-ups vie for platform primacy. Incumbents like Epic, Oracle Cerner, and athenahealth defend share through broad functionality and entrenched client bases, layering generative-AI assistants to modernize user experience. Amazon reorganized its health arm into six focused units, showcasing strategic pivot toward an integrated virtual-first offering and signaling that platform breadth, not physical footprint, will dictate future dominance. Walmart’s exit from clinic build-outs and CVS’s telehealth emphasis confirm that retail players prioritize scalable digital touchpoints over brick-and-mortar risk.
White-space opportunities abound in cross-vendor data-exchange middleware, algorithm-liability insurance, and home-based acute-care orchestration. Transcarent absorbed Accolade in a USD 621 million merger to assemble an AI-powered advocacy engine covering 20 million members, illustrating a shift toward navigation-centric value propositions. GE HealthCare collaborates with AWS to train imaging foundation models, while Cognizant pairs with Google Cloud on sector-specific LLM toolkits, underscoring the premium placed on cloud GPU access and model-lifecycle governance. Mid-tier players differentiate through narrow clinical specialties, such as Zimmer Biomet’s co-marketing with RevelAi for ortho-outcomes management, proving that vertical depth can counter horizontal platform scale.
Competition also unfolds in cybersecurity posture and regulatory readiness. Vendors that offer turnkey HIPAA and GDPR compliance, zero-trust architectures, and auditable AI pipelines win RFP points and shorten sales cycles. As the EU AI Act deadlines near, compliance services become bundled differentiators. Overall, the pace of innovation forces continuous road-mapping, while capital markets reward firms able to balance revenue growth with disciplined go-to-market spending in the expanding eHealth market.
EHealth Industry Leaders
-
athenahealth Inc.
-
Veradigm LLC
-
Oracle Cerner
-
Epic Systems Corporation
-
Teladoc Health
- *Disclaimer: Major Players sorted in no particular order
EHealth Market Companies Covered in this Report
- Veradigm
- Athenahealth
- Salesforce Health Cloud
- Oracle
- Microsoft Healthcare
- GE Healthcare
- eClinicalWorks
- Epic Systems
- Optum
- Siemens Healthineers
- Koninklijke Philips
- Teladoc Health
- Amwell (American Well)
- Medtronic
- Mckesson
- Meditech
- Google Cloud Healthcare
- DrChrono Inc.
- NextGen Healthcare
- Kareo
- Dedalus Group
Market Opportunities and Future Outlook
Interoperability mandates and publicly funded health-data infrastructure are creating whitespace for vendors that can operationalize standards-based exchange at national scale. In 2026, Canada introduced the Connected Care for Canadians Act (Bill S-5) to mandate interoperability standards and prohibit data blocking, while Spain launched its National Health Data Space (ENDS) backed by EUR 70 million in public infrastructure investment plus EUR 28 million for regional technology adaptation. These programs lift demand for FHIR-based APIs, consent management, identity matching, and cross-organization data quality tooling, supporting integration platforms and managed services that reduce implementation friction across multi-vendor estates.
Provider modernization and AI-enabled workflow automation are also shifting buying criteria toward platforms that reduce documentation and administrative burden while meeting rising security and audit requirements. Ireland moved into vendor shortlisting procurement for a national EHR following government approval, and Quebec began piloting the Dossier Sante Numerique rollout in 2026, indicating continued large-scale replacement and consolidation cycles. That dynamic continues to favor vendors with migration, change management, and clinical safety validation capabilities. At the ecosystem level, the World Health Organization joining the Open Health Stack Software Foundation in July 2026 reinforces momentum behind open, standards-based digital public infrastructure, supporting modular, reusable building blocks (registries, terminology services, data exchange layers) that can be localized across markets without re-architecting core components.
Recent Industry Developments in EHealth Market
- June 2026: Charta Health joined the athenahealth Marketplace to bring AI-powered chart review capabilities to athenaOne customers for pre-billing audits. The integration approach expands athenahealths third-party ecosystem while giving provider groups an add-on path to automate compliance and revenue integrity workflows within an existing EHR environment.
- December 2025: athenahealth collaborated with Microsoft to offer Microsoft Dragon Copilot as an ambient notes option within athenaOne for ambulatory clinicians. Embedding ambient documentation into a core EHR workflow reinforces vendor stickiness and raises the bar for AI-assisted clinical productivity features during contract renewals.
- June 2024: The Change Healthcare ransomware incident disrupted claims processing across the United States and highlighted systemic third-party concentration risk in digital health operations. The event prompted payer and provider prioritization of cyber resilience, business continuity planning, and tighter vendor risk management across eHealth platforms.
EHealth Market Report Scope and Research Methodology
Market Definition and Coverage
In this methodology, the e-health market covers spending on digital tools and services used to deliver, manage, or support healthcare electronically, including clinical records, virtual care, e-prescriptions, and remote monitoring used by providers, payers, and patients.
Scope exclusions: We exclude stand-alone wellness apps and fitness wearables that do not connect to regulated healthcare workflows or clinical systems.
Segments Covered in This Report
- By Component
- Electronic Health Records
- Telemedicine
- mHealth Apps
- Clinical Decision Support
- e-Prescribing
- Other Components
- By Delivery Mode
- Cloud-based Solutions
- On-premise Solutions
- Hybrid Solutions
- By Type of Service
- Monitoring Services
- Remote Patient Monitoring
- Chronic Disease Management
- Diagnostic Services
- Tele-radiology
- Tele-pathology
- Therapeutic Services
- Digital Therapeutics
- Virtual Rehabilitation
- Monitoring Services
- By End User
- Hospitals & Health Systems
- Insurance Companies & Payers
- Patients & Individual Consumers
- Other End Users
- Geography
- North America
- United States
- Canada
- Mexico
- Europe
- Germany
- United Kingdom
- France
- Italy
- Spain
- Rest of Europe
- Asia-Pacific
- China
- Japan
- India
- South Korea
- Australia
- Rest of Asia-Pacific
- Middle East and Africa
- GCC
- South Africa
- Rest of Middle East and Africa
- South America
- Brazil
- Argentina
- Rest of South America
- North America
Data Sources, Market Sizing, and Validation
Desk Research
Desk research is used to set the market boundary, establish country-level starting points, and test adoption and spend patterns before we finalize the model. We referenced public health and digital indicators, reimbursement and regulatory cues, and healthcare system capacity signals that influence how quickly e-health solutions move from pilots into routine use.
Typical sources included, where relevant, national health statistics and spending releases such as those published by the World Health Organization, the OECD, and the World Bank, along with U.S. CDC and FDA publications for program and device related context. We also used materials such as peer-reviewed medical informatics journals, health IT and telehealth association updates, company annual reports and investor presentations, and reliable press coverage to track product rollouts and pricing behavior. For baselines that are harder to collect, we used paid subscriptions that compile company financials, patents, and shipment-level trade flows in a selective way to fill gaps and cross-check totals. These examples are not exhaustive, and many other public and paid sources were also used for data collection, validation, and research clarification.
Primary Interviews and Surveys
Primary work focuses on confirming what is actually being purchased and deployed, then translating that into consistent pricing and volume assumptions across regions. We spoke with a mix of solution providers, hospital and clinic decision makers, payer and plan stakeholders, and channel partners across APAC, EMEA, and the Americas to avoid over-weighting one healthcare system type.
Distribution of primary research fieldwork respondents
| Company type | Respondent position | Region |
|---|---|---|
| Top tier: 33% | CXOs: 20% | APAC: 44% |
| Mid tier: 46% | Functional/Unit leaders: 26% | EMEA: 32% |
| Smaller Players: 21% | Managers: 54% | Americas: 24% |
Market-Sizing & Forecasting
Sizing starts from a top-down build where healthcare digitization demand pools are reconstructed using country healthcare expenditure, connected population and smartphone access, provider IT readiness, and adoption of telehealth and electronic records. These pools are then converted into addressable spend at end-user price levels. The result is corroborated with selective bottom-up approximations, such as sampled average selling price ranges for software subscriptions and services, multiplied by estimated active installations, along with channel checks for remote monitoring volumes, before final totals are adjusted.
Key inputs used in the model include government and payer policy signals that influence reimbursement, clinician and facility counts that shape deployment capacity, the pace of EHR and teleconsultation penetration, remote patient monitoring enrollment trends, and typical contract structures that differentiate recurring from one-time revenues. For forecasting, scenario analysis is used, with a base case tied to expected policy continuity and provider digitization roadmaps, then scaled through upside and downside cases around funding cycles, cyber and privacy requirements, and procurement delays. Where bottom-up data is incomplete for smaller markets, gaps are handled through peer-country proxies linked to healthcare spend per capita and digital access, followed by expert review.
Data Validation & Update Cycle
Validation is done through triangulation across independent signals, with checks that compare modeled spend against healthcare IT budgets, provider adoption indicators, and publicly visible program rollouts. Outliers are investigated, assumptions are re-checked, and follow-up calls are triggered when country totals move outside expected ranges or when pricing bands do not match what respondents report.
Before sign-off, the model and write-up go through multi-step analyst reviews to keep calculation logic, currency handling, and year alignment consistent. Reports are refreshed annually, with interim updates when material events occur, and a final pre-delivery pass is completed so the client receives the most current view.
Mordor Intelligence's E Health Market Sizing Compared With Other Published Estimates
Published e-health market numbers often differ because the boundary of what counts as e-health, the pricing level used, and the year selected as an anchor are not consistent across studies. As a result, two credible-looking figures can still be measuring different baskets of revenue.
Observed end-user pricing in provider contracts, along with adoption signals like EHR rollout progress and teleconsultation utilization trends, are used as checks to keep Mordor Intelligence aligned to spend that is actually paid for regulated care workflows, rather than broader wellness-only demand.
Benchmark comparison
| Source | Market Size | Gaps in Research Methodology |
|---|---|---|
| Mordor Intelligence | USD 274.35 B (2025) | |
| Industry Publisher A | USD 141.00 B (2024) | Uses an earlier base year and a narrower value capture, and the scope description leans toward selected product and service buckets without clearly aligning all items to end-user price levels across countries. |
| Global Publisher B | USD 176.29 B (2025) | Applies a creator or factory-gate value concept and also counts adjacent categories like wearables, which can shift totals away from end-user spending for provider and payer deployments. |
The spread across the three figures is mainly explained by the pricing level and what is counted inside the market basket, not just by forecast optimism. By anchoring the model to repeatable demand signals and then validating the implied spend against real-world pricing bands, the resulting estimate stays easier to reconcile and update year over year.
Key Questions Answered in the Report
How large is the eHealth market today?
The eHealth market size reached USD 317.64 billion in 2026 and is forecast to climb to USD 661.35 billion by 2031 at a 15.78% CAGR.
Which component leads the eHealth market?
Electronic Health Records command the largest 38.95% share, reflecting their central role in digitizing clinical workflows.
Which region is growing the fastest in eHealth adoption?
Asia-Pacific is projected to post the highest 20.22% CAGR through 2031, propelled by 5G rollouts and national digital-health programs.
Which is the fastest growing region in EHealth Market?
Asia Pacific is estimated to grow at the highest CAGR over the forecast period (2026-2031).
What service type generates most revenue in the eHealth market?
Monitoring services account for 56.07% of 2025 revenue, underpinned by expanding remote patient monitoring reimbursement.
What is the biggest restraint to eHealth market growth?
Data security and privacy concerns exert the strongest negative impact, clipping the forecast CAGR by an estimated 2.1%.
How will generative AI influence the eHealth industry?
Generative-AI copilots integrated into EHRs are already saving clinicians several hours of documentation per day and will become a major buying criterion in system renewals.