
E-commerce App Market Size and Share
Market Overview
| Study Period | 2020 - 2031 |
|---|---|
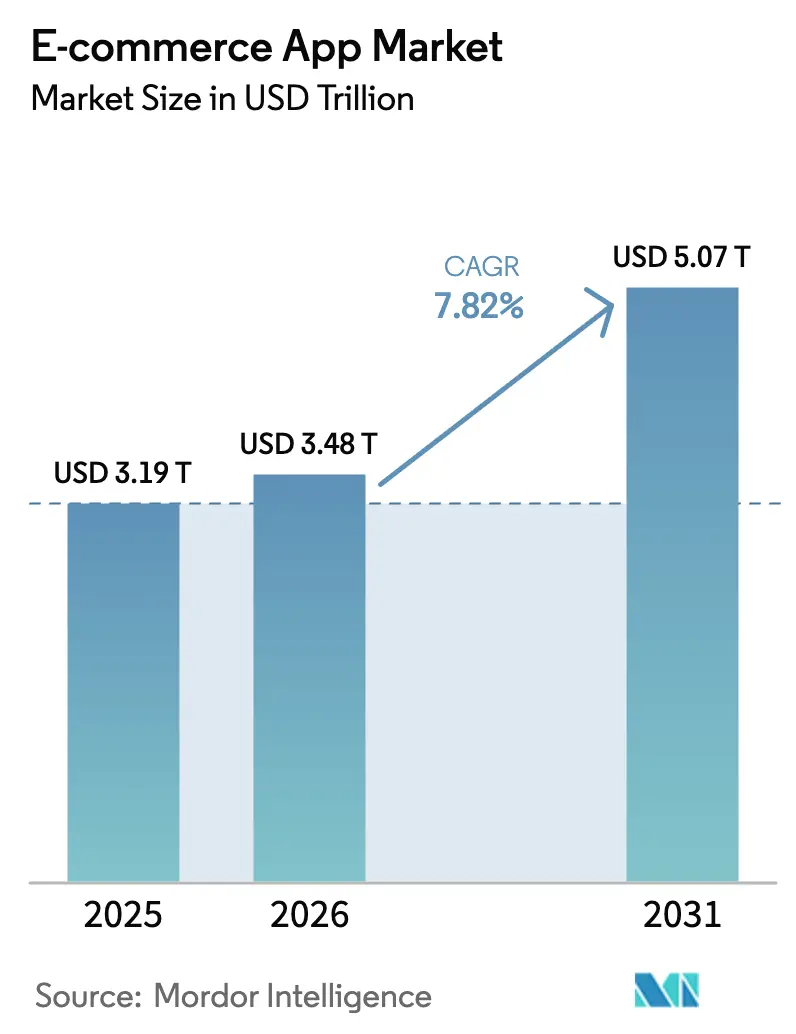
| Market Size (2026) | USD 3.48 Trillion |
| Market Size (2031) | USD 5.07 Trillion |
| Growth Rate (2026 - 2031) | 7.82 % |
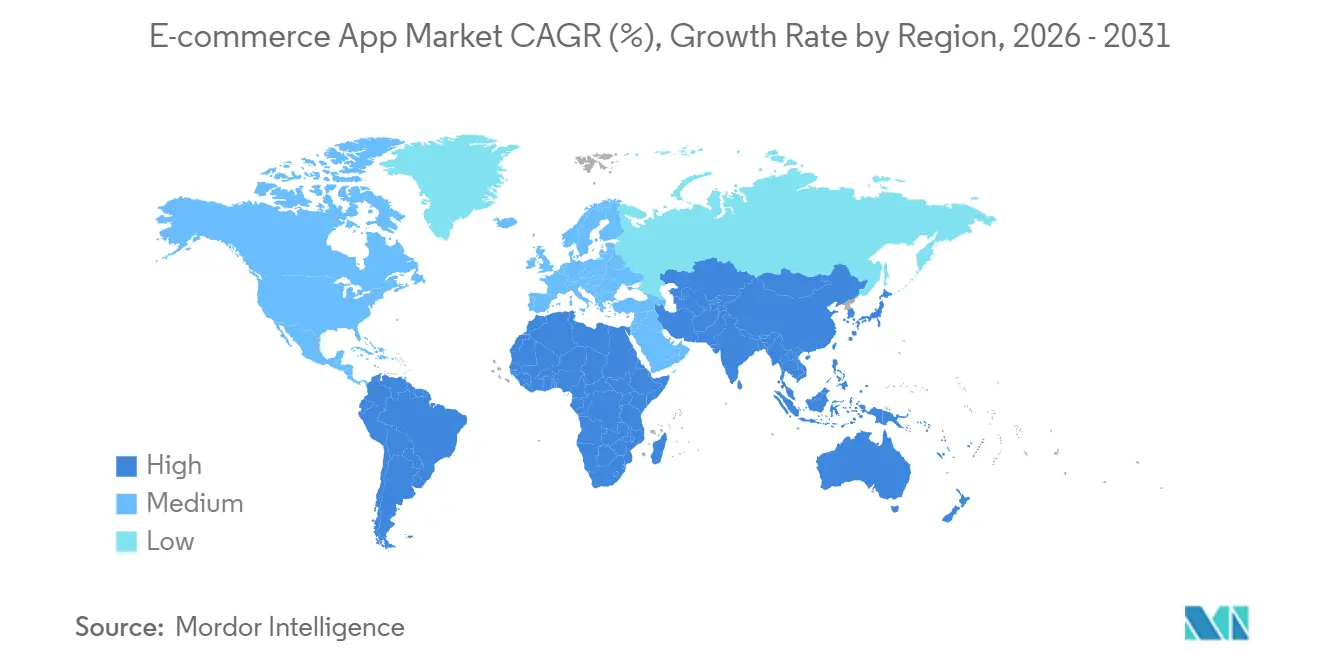
| Fastest Growing Market | Africa |
| Largest Market | Asia-Pacific |
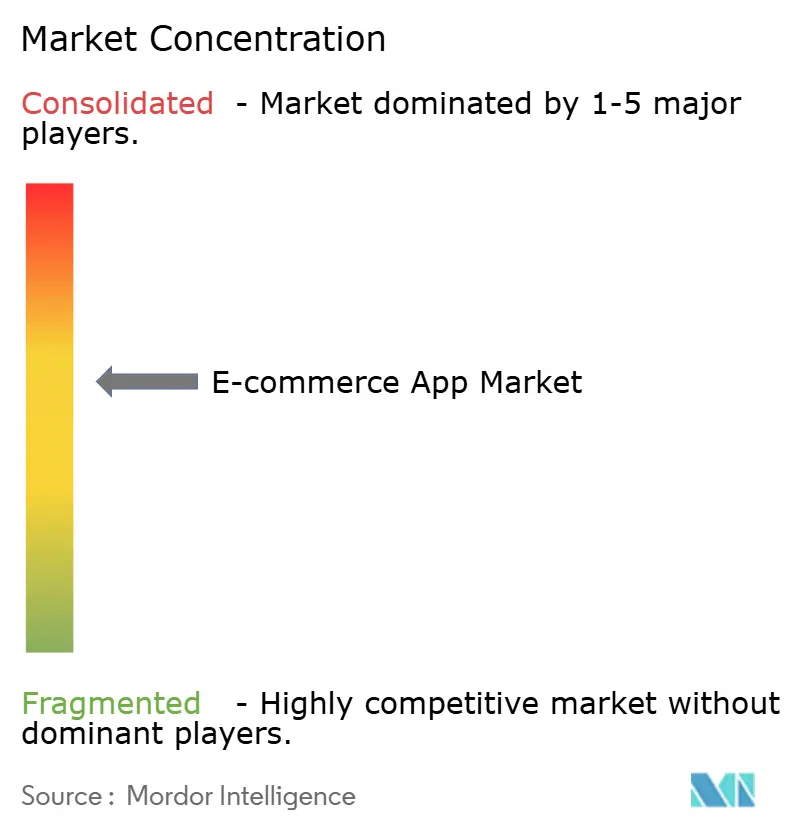
| Market Concentration | Medium |
Major Players *Disclaimer: Major Players sorted in no particular order Image © Mordor Intelligence. Reuse requires attribution under CC BY 4.0. | |
E-commerce App Market Analysis by Mordor Intelligence
The e-commerce app market size is projected to be USD 3.19 trillion in 2025, USD 3.48 trillion in 2026, and reach USD 5.07 trillion by 2031, growing at a CAGR of 7.82% from 2026 to 2031. Immersive augmented-reality try-ons, enabled by 5G networks that cut median page-load times by 40%, have raised conversion rates by 18% to 22% in fashion and home-furnishing categories. Subscription models are gathering momentum as consumers trade one-off fees for all-you-can-ship memberships, a shift that shields platforms from cyclical spending dips. Social-commerce integrations on short-video platforms now collapse discovery and checkout into 90 seconds, prompting brands to redirect 15% to 20% of search-advertising budgets toward creator partnerships. Meanwhile, mobile-money interoperability in Africa and instant-payment rails in India compress settlement friction, broadening addressable demand and stimulating competitive entry.
Key Report Takeaways
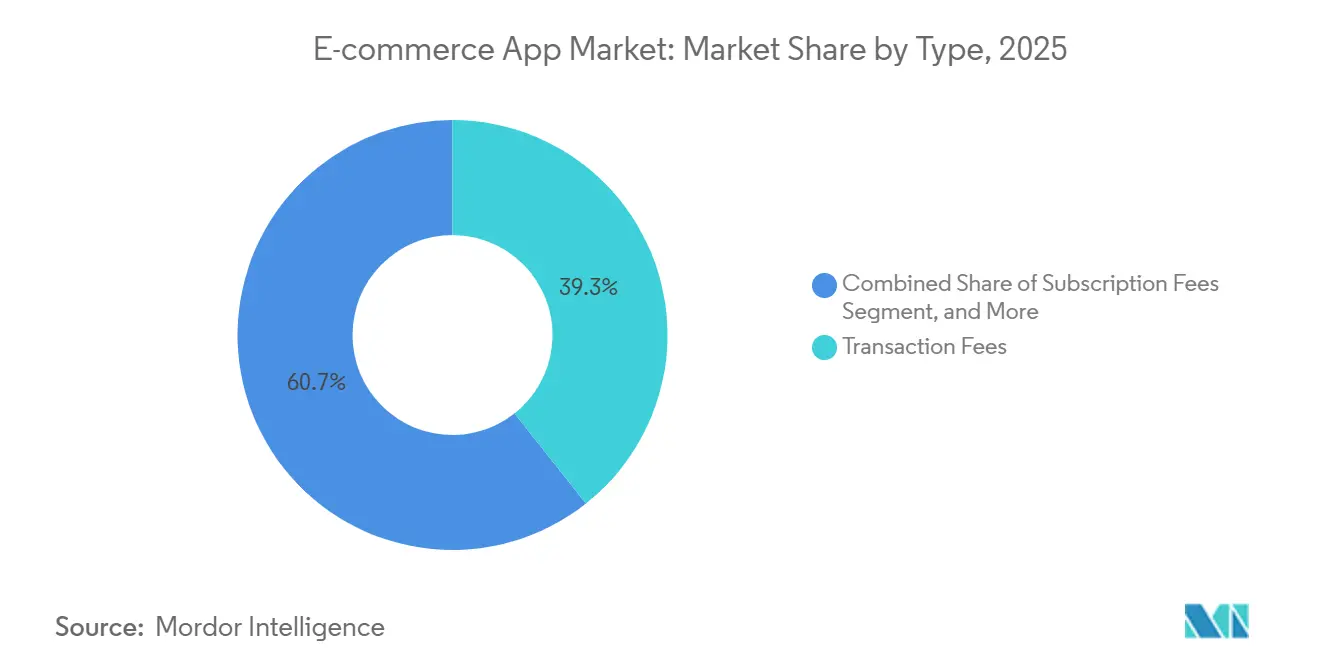
- By type, transaction fees led with 39.34% revenue share in 2025 while subscription fees are forecast to expand at an 8.82% CAGR to 2031.
- By platform, android held 72.67% of the e-commerce app market share in 2025, whereas super-app mini-programs post the highest projected CAGR at 8.24% through 2031.
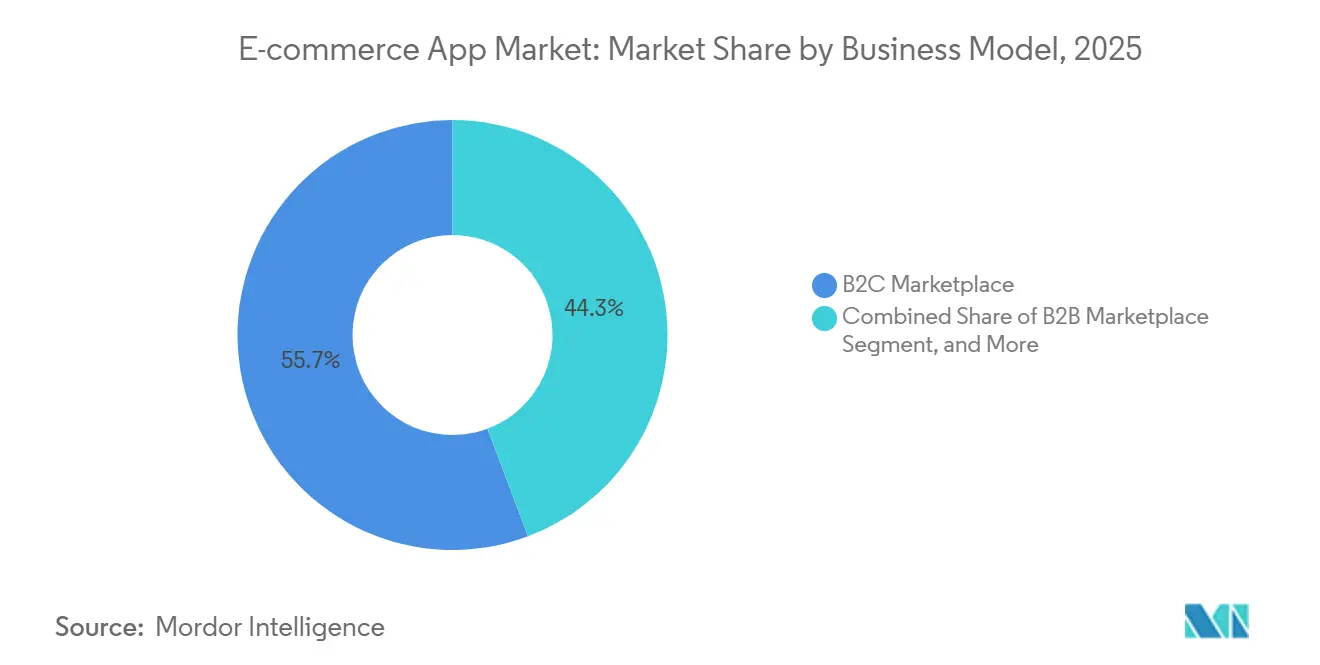
- By business model, business-to-consumer marketplaces accounted for 55.71% of the e-commerce app market in 2025, and peer-to-peer resale is advancing at an 8.41% CAGR through 2031.
- By product category, fashion and apparel commanded a 28.66% share in 2025, while grocery and FMCG are set to grow at a 9.11% CAGR through 2031.
- By geography, Asia-Pacific accounted for 42.48% of 2025 revenue, and Africa is the fastest-growing region, with an 8.89% CAGR to 2031.
Note: Market size and forecast figures in this report are generated using Mordor Intelligence’s proprietary estimation framework, updated with the latest available data and insights as of January 2026.
Global E-commerce App Market Trends and Insights
Drivers Impact Analysis*
| Driver | (~) % Impact on CAGR Forecast | Geographic Relevance | Impact Timeline |
|---|---|---|---|
| Proliferation of 5G Enhancing Mobile-Commerce Experiences | +1.2% | Global, with early density in South Korea, United States, China | Medium term (2-4 years) |
| Rapid Expansion of Buy-Now-Pay-Later Integrations | +1.4% | North America, Europe, Australia | Short term (≤ 2 years) |
| Growing Social-Commerce Convergence via Short-Video Platforms | +1.6% | Asia-Pacific core, spill-over to North America and Europe | Short term (≤ 2 years) |
| AI-Driven Personalization Increasing Average Order Value | +1.3% | Global, led by North America and Asia-Pacific | Medium term (2-4 years) |
| Rising Penetration of Affordable Smartphones in Emerging Economies | +1.5% | Africa, South Asia, Southeast Asia | Long term (≥ 4 years) |
| Government Push for Digital Payments and e-Invoices | +1.0% | India, Brazil, Middle East, with pilot programs in Africa | Medium term (2-4 years) |
| Source: Mordor Intelligence | |||
Proliferation of 5G Enhancing Mobile-Commerce Experiences
Single-digit-millisecond latency on 5G enables rich product visualization that had stalled on 4G. In South Korea, 5G penetration reached 50% in 2024, and AR-enabled listings achieved a 2.3x click-through rate compared to static images.[1]Samsung Electronics, “AR Features Drive Engagement,” news.samsung.com Retailers exploit network slicing to guarantee sub-50-millisecond checkout during flash sales, curbing the USD 18 billion in annual losses from cart abandonment. Telcos are also bundling zero-rated data plans that subsidize app usage in price-sensitive markets across Southeast Asia and Latin America, thereby boosting e-commerce app adoption.
Rapid Expansion of Buy-Now-Pay-Later Integrations
BNPL accounted for 9.8% of U.S. e-commerce transactions in 2024, but its reclassification as credit card lending now imposes Regulation Z dispute-resolution obligations that may inflate compliance costs by USD 1.2 billion annually. Despite tighter oversight, PayPal disclosed that BNPL users exhibit a 35% higher lifetime value than one-time buyers, validating installment flexibility as a demand catalyst.[2]PayPal Holdings, “Annual Report 2025,” pypl.com Incumbents able to underwrite risk with proprietary data will likely widen moats as the e-commerce app market evolves.
Growing Social-Commerce Convergence via Short-Video Platforms
TikTok Shop processed USD 20 billion GMV across Southeast Asia in 2024, demonstrating that shoppable live streams can compress the purchase funnel to under 90 seconds. Instagram’s 2025 rollout of in-app checkout to 27 additional countries removed redirect friction that had caused 40% of social-referred traffic to leak.[3]Meta Platforms, “Form 10-K 2025,” meta.com Brands now allocate up to 20% of their performance spend to influencer partnerships that convert at 3x the rate of traditional algorithmic recommendations. Logistics APIs that auto-populate shipping addresses have cut abandonment rates by 22 percentage points, reinforcing social video as a durable demand driver.
AI-Driven Personalization Increasing Average Order Value
Recommendation engines surpassing 85% accuracy raise average order values by 12% to 15%, a benchmark confirmed in Amazon’s 2025 shareholder letter. Shopify merchants enabling dynamic bundling saw carts expand 18% after a June 2025 AI upgrade. Return rates fell 23% among retailers deploying predictive sizing tools, expanding gross margins while easing logistics pressure. Heightened privacy rules are now channeling investment toward first-party data capture through loyalty programs, cementing personalization as a pivotal capability.
Restraints Impact Analysis*
| Restraint | (~) % Impact on CAGR Forecast | Geographic Relevance | Impact Timeline |
|---|---|---|---|
| Intensifying Regulatory Scrutiny on App Tracking Transparency | -0.9% | Global, with strictest enforcement in European Union, United States | Short term (≤ 2 years) |
| Escalating Cross-Border Logistics Costs for SMEs | -0.7% | Global, acute in Africa, Latin America, Southeast Asia | Medium term (2-4 years) |
| Heightened Consumer Concerns Around Data Privacy Breaches | -0.6% | North America, Europe, with rising awareness in Asia-Pacific | Medium term (2-4 years) |
| Talent Shortage in Mobile Cyber-Security Engineering | -0.5% | Global, most severe in North America, Europe | Long term (≥ 4 years) |
| Source: Mordor Intelligence | |||
Intensifying Regulatory Scrutiny on App Tracking Transparency
Opt-in rates for Apple’s App Tracking Transparency framework slipped to 25% by 2024, severing cross-app identifier graphs that powered retargeting and costing Meta an estimated USD 10 billion in mobile-ad revenue. The European Union levied EUR 2.1 billion in GDPR fines on non-compliant e-commerce apps during 2023-2024, forcing developers to rebuild consent flows that capture 40% less first-session data. Platforms now pivot toward contextual ads and first-party loyalty schemes, yet short-term revenue pressure persists across the e-commerce app market.
Escalating Cross-Border Logistics Costs for SMEs
Small-parcel shipping rates rose 18% in 2024, shrinking margins for SMEs lacking volume to negotiate contracts. Customs digitization delays under Europe’s Import Control System 2 held 22% of inbound parcels for more than five days during its October 2024 rollout. Flexport and other freight-aggregation platforms pool SME shipments to secure container rates 25% below spot, but access remains uneven in Africa and Southeast Asia.
*Our forecasts treat driver/restraint impacts as directional, not additive. The impact forecasts reflect baseline growth, mix effects, and variable interactions.
Segment Analysis
By Type: Subscription Models Counter Fee Fatigue
Transaction fees accounted for 39.34% of revenue share in 2025, as marketplaces monetized every completed sale, yet subscription fees are on track to expand at an 8.82% CAGR through 2031. Amazon Prime exemplifies the model with 230 million members who contributed USD 40 billion in annual fees during 2025, cushioning revenue against discretionary slowdowns. Rising subscription uptake indicates that predictable logistics perks and exclusive drops outweigh the perceived loss of flexibility for many shoppers, a trend expected to deepen as the e-commerce app market matures.
Recurring billing is increasingly supported by the regulatory framework. Europe's Digital Markets Act prohibits the mandatory use of proprietary payment systems, thereby reducing the dominance of in-app commissions associated with transaction fees. E-commerce applications that integrate transaction income with subscription models experience a 30% decrease in revenue volatility, emphasizing the benefits of diversification.


By Platform: Mini-Programs Chip Away at the Duopoly
Android maintained 72.67% of the installed base in 2025, propelled by sub-USD 100 devices popular in Asia and Africa. iOS captured just 19% of downloads but 45% of GMV, driven by affluent user cohorts in North America and Europe. In 2025, WeChat boasted 4.5 million mini-programs on its super-app platform, collectively handling transactions worth USD 420 billion, marking an impressive 8.24% CAGR for the segment.
Mini-programs inherit parent-app credentials and payment methods, boosting retention compared with standalone apps, which lose 70% of new installs within 30 days. China’s regulators now require business license displays in mini-programs, raising compliance overhead while solidifying consumer trust. Although North American antitrust scrutiny chills super-app expansion, mini-program traction across Asia positions the format as a durable growth pillar in the e-commerce app market.
By Business Model: Resale Platforms Power Circular Growth
Business-to-consumer marketplaces accounted for 55.71% of 2025 revenue, offering an unmatched breadth of assortment but razor-thin seller margins of 3% to 5%. Peer-to-peer resale, advancing at an 8.41% CAGR, counters this dynamic by monetizing authentication services and carbon-offset badges rather than listing fees. In 2025, Depop's carbon-neutral checkout boosted average order values by 11%, highlighting the positive impact of sustainable initiatives on consumer spending behavior.
Business-to-business platforms are streamlining procurement processes. They utilize ERP APIs that automatically trigger reorders whenever inventory levels fall below set thresholds. However, regulatory duties vary across the board. For instance, resale applications bear the brunt of liabilities when it comes to counterfeit products. This challenge prompted Poshmark to implement advanced computer-vision filters, achieving an impressive 92% accuracy rate, ensuring listings are vetted before going live. Collectively, these models shed light on the fragmentation of value pools within the e-commerce application market.
By Product Category: Quick-Commerce Redefines Convenience
Fashion and apparel accounted for 28.66% of revenue in 2025, buoyed by frequent replenishment and social media-inspired loops. Grocery and FMCG, however, are forecast to post a 9.11% CAGR as 10-minute delivery compresses last-mile costs through hyper-local dark stores. By late 2025, Zepto and Blinkit, both hailing from India, had set up 800 micro-fulfillment centers, seizing 12% of the grocery expenditure in Mumbai and Bengaluru.
Trade-in programs play a significant role in facilitating the recovery of secondary-market value for electronics and media sales within brand ecosystems. These programs not only enhance the lifecycle of products but also contribute to sustainable practices by encouraging reuse and recycling. Each vertical strategically adapts technology to address specific challenges and consumer needs, thereby underscoring the segmentation depth and innovation within the e-commerce app market.
Geography Analysis
Asia-Pacific generated 42.48% of 2025 revenue, as China’s super-app ecosystems embedded retail, payments, and social networking into a single platform, processing 4.5 million daily mini-program transactions. India’s Unified Payments Interface cleared 11.6 billion monthly transactions, enabling even street vendors to accept QR-code payments through Paytm and PhonePe. Southeast Asia’s live-stream commerce hit USD 180 billion in GMV, compressing discovery-to-purchase cycles to sub-100 seconds.
North America held a 28% share in 2025, with the United States contributing USD 820 billion as Amazon Prime’s 180 million domestic members fueled one-day shipping economics. Mexico’s app penetration jumped to 48% on the back of MercadoPago micro-loans that extend credit to unbanked consumers. California’s Consumer Privacy Act curtailed third-party data sharing, forcing a pivot toward contextual ad strategies across the e-commerce app market.In accordance with the Digital Markets Act, Europe mandated interoperable payments, resulting in an 8 to 12 percentage point reduction in gatekeeper take rates, thereby benefiting third-party developers. Following Brexit, customs frictions extended delivery times in the United Kingdom by 5 days, necessitating dual-fulfillment footprints and consequently increasing logistics costs. While Russia encountered challenges due to payment-network sanctions, these were partially mitigated by the country's domestic Mir rails.
Africa is the fastest-growing region at an 8.89% CAGR, propelled by mobile-money interoperability that cuts cross-border fees from 7% to under 1%. Jumia adopted a 60% cash-on-delivery model in Nigeria and Egypt, deploying GPS-tagged drop-off points where formal addresses are scarce. Implementation lags under the African Continental Free Trade Area still leave customs clearance at 7-10 days, a barrier ripe for digital brokers. Brazil’s Pix processed 3.2 billion monthly instant-payment transactions, evaporating three-day settlement lags. MercadoLibre’s 1,800 fulfillment sites now enable next-day delivery in major metros, raising service expectations across the region. Argentina’s consumers lean on installment plans to hedge against inflationary erosion, underscoring macro volatility’s sway over the e-commerce app market.
Middle East markets reached 48% penetration in 2025, buoyed by mandates requiring businesses with annual revenue above SAR 1 million to accept digital payments. Noon and Amazon.ae compete on same-day service despite the 45-degree Celsius summers that challenge perishable logistics. The UAE's VAT-refund app allows tourists to instantly reclaim taxes on eligible purchases, providing a seamless and efficient process. This initiative has significantly contributed to a 14% increase in luxury app purchases, highlighting its positive impact on consumer spending within the country.

Regulatory Landscape
Regulation for e-commerce apps is tightening around platform accountability, seller transparency, and data use, with the European Union setting the clearest enforcement tone. In 2026, EU marketplace rules expanded in practice through Digital Services Act-style risk controls and adjacent platform-rule packages that emphasize seller verification and algorithmic transparency for large platforms. Enforcement actions against major cross-border marketplaces highlighted the compliance cost tied to counterfeit and illegal-listing exposure.
Alongside platform-governance rules, cross-border trade and national e-commerce laws are reshaping operational requirements. Vietnam advanced its updated regime via the Ministry of Industry and Trade with Decree 248/2026/ND-CP detailing obligations for domestic and foreign platforms, including reporting and operational conditions that affect onboarding, catalog governance, and payments. In China, the State Administration for Market Regulation moved on trade-secret and confidentiality protections (effective June 1, 2026), and draft work on E-commerce Law amendments signals a tighter linkage between platform governance and external trade pressures.
Value Chain Analysis
The e-commerce app value chain begins with merchant acquisition and catalog ingestion, then moves through discovery (search, social commerce, and recommendations), checkout and payments, order orchestration, fulfillment, last-mile delivery, and post-purchase services such as returns, refunds, and customer support. Value capture concentrates in transaction fees and advertising for many marketplaces, while subscriptions (for shipping and loyalty benefits) create a parallel monetization layer that can dampen revenue volatility, as seen in leading ecosystems that combine logistics perks with app-based engagement.
In 2026, compliance and logistics digitization are being built into the operating layer of the chain rather than treated as back-office add-ons. EU marketplace compliance obligations raised the bar for seller verification and content monitoring, increasing fixed costs and encouraging consolidation as smaller marketplaces exited. Larger platforms absorbed more of this spend and reinforced their scale advantages. On the logistics side, broader adoption of interoperable electronic freight information and digital supply-chain standards (including OECD-backed frameworks for data interoperability and traceability) is pushing carriers, warehouses, and platforms to integrate via APIs, improving exception management and returns processing, while also increasing dependency on shared data standards and audit-ready records.
Competitive Landscape
Moderate fragmentation defines the e-commerce app market. The top five players - Amazon, Alibaba, Shopify, Walmart, and JD - command 38% of 2025 revenue, while regional champions such as MercadoLibre, Jumia, and Flipkart dominate local niches by tailoring logistics and payment rails to on-the-ground realities. Horizontal super-apps aggregate ride-hailing, food, and retail under a single login, whereas vertical specialists own farm-to-doorstep supply chains.
Alibaba’s unified commerce protocol synchronizes 1.2 billion SKU updates daily, routing orders to the nearest node within 80 milliseconds, a scale that erects technical barriers for newcomers. Quick-commerce disruptors Zepto and Blinkit exploit 15-minute grocery windows to capture urban top-up missions, compelling traditional grocers to launch comparable offerings. Shopify’s AI discovery tool, rolled out mid-2025, lifted cart sizes by 18% without incremental acquisition spend, highlighting the technology’s leverage for margin expansion.
Privacy-by-design architectures now separate leaders from laggards in markets where data stewardship sways consumer trust. Platforms that encrypt data in transit and trim retention windows post 22% higher trust scores in shopper surveys and face 40% lower legal exposure to privacy fines. As regulations tighten in the e-commerce app market, this compliance advantage may expand, providing companies adhering to these standards with a stronger competitive position and increased consumer trust.
E-commerce App Industry Leaders
Amazon.com, Inc.
eBay Inc.
Walmart Inc.
Alibaba Group Holding Limited
Shopify Inc.
- *Disclaimer: Major Players sorted in no particular order

Market Opportunities and Future Outlook
Regulatory and trade-policy changes are creating concrete whitespace for e-commerce apps that can package compliance as a product feature. Vietnam is a clear example: the Law on E-commerce and Decree 248/2026/ND-CP (effective July 1, 2026) increase demand for platform capabilities such as stronger seller KYC, standardized reporting, and auditable transaction records. These capabilities can be packaged into onboarding, merchant tooling, and embedded payments for both domestic and cross-border sellers. In the EU, heightened marketplace obligations and enforcement intensity increase the value of trust and safety tooling, counterfeit detection workflows, and seller-verification services that reduce platform liability while supporting conversion.
Supply-chain digitization and data interoperability also offer a practical opportunity area, especially for cross-border commerce and quick-commerce models that rely on reliable status visibility. OECD work on interoperable data standards for AI-driven risk management and environmental traceability aligns with e-commerce apps that integrate logistics status, returns, and carbon-related attributes into the shopper experience and merchant dashboards. Separately, national industrial strategies that prioritize e-commerce integration with the real economy, such as China policy guidance tied to the 2026-2030 planning cycle, support continued investment in platform infrastructure, merchant enablement, and online-to-offline fulfillment linkages within super-app and marketplace ecosystems.
Recent Industry Developments
- July 2026: Global rollout of Buy Box changes; removal of standalone seller-performance eligibility checks; EU/UK effective 20 July 2026. The governance shift reallocates visibility and price competition among marketplace sellers. Brands must adapt monitoring and pricing strategies to maintain Buy Box competitiveness.
- July 2026: Implementation of new Seller Fulfilled Prime (SFP) delivery-speed thresholds; increased next-day and two-day delivery requirements for Prime items (effective 6 July 2026). Delivery-speed governance reshapes marketplace fulfillment dynamics. The tighter standards drive sellers to invest in logistics and carrier capabilities to meet expectations.
- May 2026: Licensing of Alexa for Shopping AI technology to third-party retailers via AWS, enabling deployment of custom AI shopping assistants. AI enabled shopping assistants extend discovery and conversion within e-commerce apps. The initiative broadens the role of AI infrastructure for merchants and may reshape app-level experiences.


Research Methodology Framework and Report Scope
Market Definition and Coverage
For this study, the e-commerce app market is the total value of goods and services sold through mobile-first commerce applications where browsing, ordering, and payment are completed in an app environment.
Scope exclusions: This sizing excludes offline retail sales, pure desktop web checkout that is not app-mediated, and non-commerce app revenue streams such as standalone advertising or app development services.
Segmentation Overview
- By Type
- In-app Purchases
- Advertisements
- Subscription Fees
- Transaction Fees
- Freemium Upsell
- By Platform
- Android
- iOS
- Super-App Mini-Programs
- By Business Model
- B2C Marketplace
- B2B Marketplace
- C2C / Peer-to-Peer
- Direct-to-Consumer Brand App
- By Product Category
- Fashion and Apparel
- Electronics and Media
- Grocery and FMCG
- Home and Furniture
- Health and Beauty
- Other Product Categories
- By Geography
- North America
- United States
- Canada
- Mexico
- Europe
- Germany
- United Kingdom
- France
- Russia
- Rest of Europe
- Asia-Pacific
- China
- Japan
- India
- South Korea
- Australia
- Rest of Asia-Pacific
- Middle East and Africa
- Middle East
- Saudi Arabia
- United Arab Emirates
- Rest of Middle East
- Africa
- South Africa
- Egypt
- Rest of Africa
- Middle East
- South America
- Brazil
- Argentina
- Rest of South America
- North America
Data Sources, Market Sizing, and Validation
Desk Research
Desk research was used to set the starting point for the demand pool and to keep assumptions realistic across regions. We leaned on official digital economy and connectivity indicators, plus payments and retail commerce signals that have stable time series.
Public sources used for this work included materials such as ITU mobile broadband statistics, World Bank indicators for digital access and macro baselines, UNCTAD e-commerce and digital trade notes, OECD digital economy publications, and WTO data where cross-border commerce context was needed. We also reviewed app ecosystem disclosures and commerce policy updates from regulator and central bank publications, and then cross-checked directionally with company filings, investor decks, and credible business press. Paid subscriptions were used in a limited way for company financial intelligence, shipment level trade checks where relevant, and patent databases to sanity check feature-led adoption themes. The sources named here are illustrative only, and many other public references were consulted to collect, validate, and clarify the final inputs.
Primary Interviews and Surveys
Primary work focused on turning broad digital commerce signals into app-specific conversion and monetization assumptions, and then stress testing those assumptions across regions. We spoke with operators, channel partners, merchants, and enabling service stakeholders to confirm how app checkout mix, paid feature take-up, and category seasonality are actually trending, and to reconcile gaps left by public datasets.
Distribution of primary research fieldwork respondents
| Company type | Respondent position | Region |
|---|---|---|
| Top tier: 26% | CXOs: 12% | APAC: 41% |
| Mid tier: 60% | Functional/Unit leaders: 31% | EMEA: 37% |
| Smaller Players: 14% | Managers: 57% | Americas: 22% |
Market-Sizing & Forecasting
Sizing started with a top-down demand reconstruction that links retail and digital commerce totals to the share executed inside apps, then adjusted based on platform usage patterns and payment completion rates. To keep totals grounded, we corroborated the outputs with selective bottom-up checks, including sampled app-enabled GMV-to-revenue relationships, channel conversations on take rates, and sanity checks using a small set of large-app disclosures where they were available.
The inputs that mattered most included smartphone and mobile broadband penetration, digital wallet and account-to-account payment adoption, the app share of online transactions, average order value shifts by major product categories, and cross-border order intensity in markets with high import flows. When direct app-only splits were not published, gaps were handled through ranges informed by interview feedback and then narrowed using consistent rules across countries. Forecasts were built using scenario analysis supported by a small set of explanatory drivers, including connectivity, payment rails adoption, and consumer spending outlook. The final path was aligned to what practitioners described as the most likely base case.
Data Validation & Update Cycle
Validation was done through triangulation between model outputs, independent indicators, and what interviewees described as feasible ranges for conversion and order values. Outliers were flagged early, then reviewed through analyst-to-analyst checks that look for sudden jumps caused by currency timing, one-off promotional periods, or category mix changes.
If a variance could not be explained with desk inputs, respondents were re-contacted to confirm whether the assumption should be changed or whether the anomaly was real and market driven. Reports are refreshed annually, and interim updates are made when material events occur, such as major regulatory shifts in payments, abrupt consumer demand changes, or significant platform policy changes. Before delivery, a final pass is completed so clients receive the most current view based on the latest available releases.
Mordor Intelligence's E Commerce App Market Size Measured Against Other Published Estimates
Published market sizes for e-commerce apps do not always match, because studies often count different money flows and also anchor to different base years. The main drivers usually come down to what gets treated as app-based commerce, how cross-border value is converted to USD, and how fast the model is refreshed when new payment and retail data is released.
Some estimates broaden the scope to include commerce completed through any mobile browser session, or they carry forward older FX averages across multiple years. Mordor Intelligence counts value only when the purchase journey is completed within an app checkout environment, and it also refreshes near-term inputs using the latest year-specific mobility, payments, and consumer spending signals before projecting forward.
Benchmark comparison
| Source | Market Size | Gaps in Research Methodology |
|---|---|---|
| Mordor Intelligence | USD 3.48 T (2026) | |
| Industry Publisher A | USD 3.90 T (2024) | Uses an earlier base year and appears to blend broader mobile commerce activity into app value, which can lift totals when mobile web checkout is counted alongside in-app transactions. |
| Research Boutique B | USD 6.09 T (2026) | Shows a higher 2026 value that likely assumes a wider transaction pool and more aggressive monetization progression, with limited visible checks on app-only checkout share and currency timing. |
Taken together, the spread is mostly explained by scope and timing choices, not by arithmetic differences. By tying the total to app-completed checkout signals, applying consistent currency-year handling, and then cross-checking with practical channel feedback, the estimate stays traceable to a repeatable set of inputs that can be revisited during updates.


Key Questions Answered in the Report
How large is the e-commerce app market in 2026 and what growth is expected?
The e-commerce app market size stood at USD 3.48 trillion in 2026 and is projected to reach USD 5.07 trillion by 2031, reflecting a 7.82% CAGR.
Which platform leads global installs?
Android dominated with 72.67% of installs in 2025, benefiting from low-cost smartphones across Asia, Africa and Latin America.
What segment is growing fastest by revenue model?
Subscription fees are forecast to expand at an 8.82% CAGR through 2031 as consumers opt for all-you-can-ship memberships and ad-free browsing.
Which region shows the highest growth momentum?
Africa posts the fastest regional CAGR at 8.89%, propelled by interoperable mobile-money systems that slash cross-border fees.
How are 5G networks influencing mobile commerce?
5G’s single-digit-millisecond latency enables augmented-reality try-ons and sub-50 millisecond checkout windows, raising conversion rates up to 22% in visual categories.
What regulatory change most impacts advertising revenues?
Apple’s App Tracking Transparency framework cut global opt-in rates to 25%, reducing cross-app targeting and costing major platforms billions in ad revenue.
Page last updated on:


 Your data is secure and never sold or shared.


