
E-bike Motor Market Size and Share
Market Overview
| Study Period | 2021 - 2031 |
|---|---|
| Market Size (2026) | USD 4.61 Billion |
| Market Size (2031) | USD 6.39 Billion |
| Growth Rate (2026 - 2031) | 6.72 % |
| Fastest Growing Market | North America |
| Largest Market | Asia-Pacific |
| Market Concentration | Medium |
Major Players *Disclaimer: Major Players sorted in no particular order Image © Mordor Intelligence. Reuse requires attribution under CC BY 4.0. | |
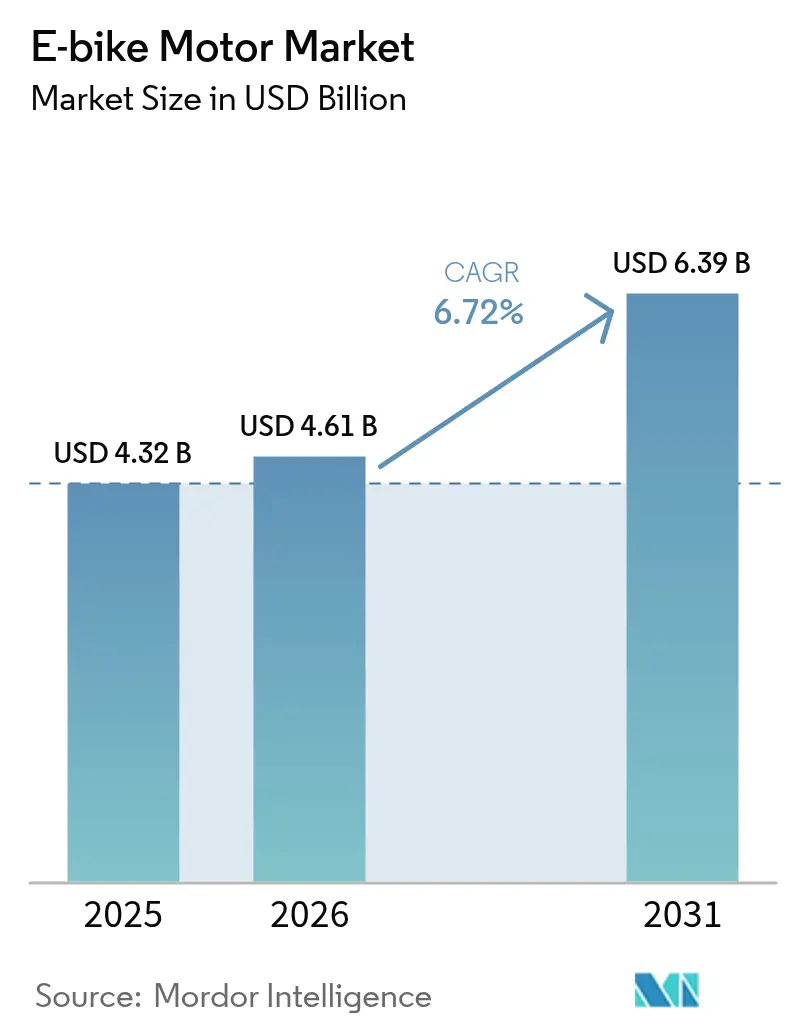
E-bike Motor Market Analysis by Mordor Intelligence
The e-bike motor market size was valued at USD 4.32 billion in 2025 and estimated to grow from USD 4.61 billion in 2026 to reach USD 6.39 billion by 2031, at a CAGR of 6.72% during the forecast period (2026-2031). Demand accelerates as cities tighten carbon-reduction mandates, logistics firms electrify fleets, and OEMs roll out software-defined drive units. The e-bike motor market benefits from falling battery prices, yet faces margin pressure from rare-earth magnet volatility that prompts suppliers to explore iron-nitride and ferrite alternatives. Intensifying consolidation—the Yamaha-Brose deal and Bosch’s expanding smart-system portfolio—signals a shift toward vertically integrated offerings that blend hardware with over-the-air software. Asia-Pacific remains the primary production hub, but North America’s appetite for high-power, throttle-enabled models drives fresh investment in local assembly lines.
Key Report Takeaways
- By motor type, hub systems held 67.58% e-bike motor market share in 2025, whereas mid-drive systems are on track for an 8.36% CAGR through 2031.
- By e-bike category, urban models captured 42.86% of the e-bike motor market size in 2025, while e-mountain bikes are projected to post an 8.02% CAGR to 2031.
- By power rating, sub-250 W units commanded 57.42% share of the e-bike motor market size in 2025; in contrast, motors above 500 W are expanding at an 8.66% CAGR.
- By sales channel, OEM factory-fit installations represented 64.05% share in 2025, but the aftermarket is forecast to register a 9.18% CAGR over the outlook period.
- By geography, Asia-Pacific dominated with a 78.05% share in 2025, whereas North America is expected to grow at a 9.14% CAGR through 2031.
Note: Market size and forecast figures in this report are generated using Mordor Intelligence’s proprietary estimation framework, updated with the latest available data and insights as of 2026.
Global E-bike Motor Market Trends and Insights
Drivers Impact Analysis*
| Driver | (~) % Impact on CAGR Forecast | Geographic Relevance | Impact Timeline |
|---|---|---|---|
| Soaring Urban-Commuter Uptake | +1.8% | North America, Europe | Medium term (2-4 years) |
| Stricter EU and China CO₂ Targets | +1.2% | Europe, China | Long term (≥ 4 years) |
| OEM Push for Smart Integrated Systems | +1.1% | North America, Europe | Medium term (2-4 years) |
| Electrification of Delivery Fleets | +0.9% | Global urban centers | Short term (≤ 2 years) |
| Venture Funding into Mid-Drive Specialists | +0.7% | North America, Europe | Short term (≤ 2 years) |
| Magnet-Material Breakthroughs | +0.6% | Global hubs | Long term (≥ 4 years) |
| Source: Mordor Intelligence | |||


Soaring Urban-Commuter Uptake
Corporate bike-leasing programs fuel predictable, bulk demand that raises minimum quality thresholds for motor suppliers. Tax incentives lower end-user costs by up to 40%, channeling consumer preference toward premium drive units with onboard connectivity. As leasing spreads to France and the Nordics, the e-bike motor market secures an annuity-like volume stream anchored by fleet replacement cycles of three to four years. Motor makers leverage this stability to justify higher R&D outlays, especially for AI-based diagnostics that cut downtime. The growth of commuter e-bike lanes in major cities further reinforces baseline demand.
Stricter EU and China CO₂ Targets
Revised European vehicle-emission rules and China’s GB 17761-2024 standard press suppliers to maximize efficiency per kilogram, rather than peak wattage. Bosch’s magnesium-housing Performance Line CX Gen 5 trims 100 g in weight yet maintains 85 Nm torque[1]“Performance Line CX,”, Bosch eBike Systems, bosch-ebike.com. China now mandates embedded battery-management systems, anti-tamper hardware, and satellite positioning, rewarding firms with advanced software stacks and penalizing low-end assemblers. These rulebooks also accelerate the industry’s shift from lead-acid to lithium packs, cementing demand for compatible motor electronics. Compliance costs rise, but early movers gain a head start and access to high-regulation markets, reinforcing their brand equity in the e-bike motor market.
OEM Push for Smart Integrated Systems
Bike brands now specify drive units, batteries, displays, and firmware as a single package to streamline warranty and service. Bosch’s Smart System integrates over-the-air theft protection, auto-shift, and AI route planning, and its eShift interface now interoperates with Shimano and TRP drivetrains. Yamaha’s pending acquisition of Brose’s e-bike division deepens its European engineering bench, positioning it to deliver fully calibrated powertrains to OEM partners. Integration raises switching costs for brands, strengthening ecosystem lock-in and cementing recurring revenue streams from updates and digital services within the e-bike motor market.
Electrification of Delivery Fleets
Parcel and food-delivery operators adopt cargo e-bikes to skirt congestion charges and cut emissions. Fleet buyers value duty-cycle resilience, waterproof connectors, and quick-swap batteries, reshaping motor design priorities toward torque consistency and thermal management. Because commercial riders average six to eight charge cycles per week—triple that of commuters—motors must endure higher load spectra. Volume contracts from logistics firms create forward visibility that underwrites plant expansions in Poland, Vietnam, and Mexico, insulating global supply chains.
Restraints Impact Analysis*
| Restraint | (~) % Impact on CAGR Forecast | Geographic Relevance | Impact Timeline |
|---|---|---|---|
| High Upfront Motor–Battery Cost | -1.4% | Global | Short term (≤ 2 years) |
| Dependence on NdFeB Magnets | -0.8% | Global | Medium term (2-4 years) |
| Fire-Safety Recalls and Insurance Hikes | -0.6% | North America, Europe | Short term (≤ 2 years) |
| Speed-Cap Policy Divergence | -0.5% | Global | Medium term (2-4 years) |
| Source: Mordor Intelligence | |||
Dependence on NdFeB Magnets
China processes roughly 85% of global rare-earth output, leaving motor OEMs vulnerable to export restrictions and spot-price spikes[2]“Rare Earths Statistics and Information,”, U.S. Geological Survey, usgs.gov. Setting up processing facilities beyond China's borders demands years of capital investment and environmental approvals, extending the period of vulnerability. This challenge is compounded by the complexities of navigating regulatory frameworks and securing sustainable supply chains. As the e-bike motor market grapples with margin risks linked to magnet supply fluctuations, it awaits the scaling of iron-nitride or ferrite alternatives, which could provide a more stable and cost-effective solution in the long term.
Speed-Cap Policy Divergence
Global standards vary widely: the EU caps assistance at 25 km/h and 250 W continuous, while many U.S. states allow 750 W motors with a throttle up to 28 mph. Such fragmentation obliges brands to maintain multiple SKUs, complicating inventory and homologation. Platform launches slow as engineering teams juggle disparate firmware, connectors, and compliance paperwork, muting the otherwise bullish e-bike motor market trajectory in certain regions.
*Our forecasts treat driver/restraint impacts as directional, not additive. The impact forecasts reflect baseline growth, mix effects, and variable interactions.
Segment Analysis
By Motor Type: Mid-Drive Momentum
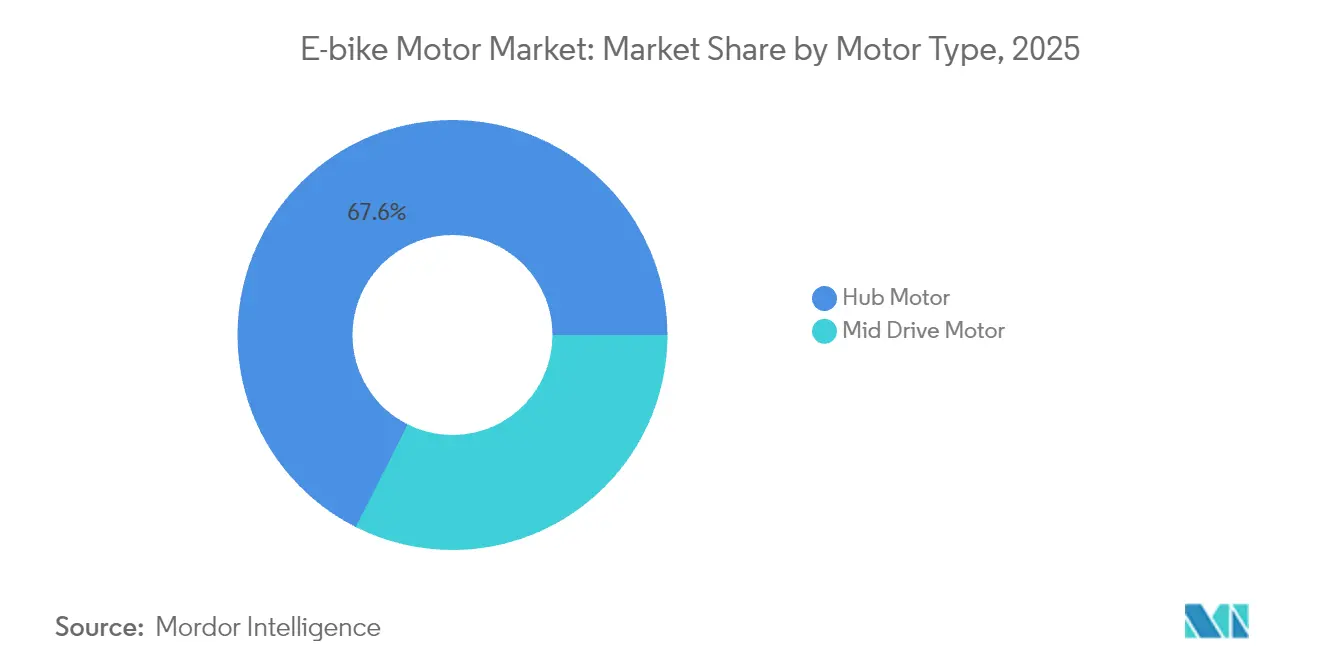
Hub motors retained a 67.58% e-bike motor market share in 2025, underpinned by low cost, plug-and-play installation, and widespread availability. Yet mid-drive units, projected to register an 8.36% CAGR, are reshaping premium categories through improved weight distribution and drivetrain synergy. Hub innovators answer back with features such as clutch-free coasting and sealed multi-speed gearboxes, prolonging their relevance in budget city bikes.
Shifts in component sourcing underscore the trajectory. Automotive-grade suppliers bring in IP-protected torque-sensor stacks and ASIC-based controllers that elevate mid-drive efficiency. Firmware updates enable user-selectable power maps, furthering personalization. While hub systems will dominate volume for entry-level and shared-mobility fleets, margin-rich mid-drive platforms will capture outsized profit pools, reinforcing the two-tier structure within the e-bike motor market.


By E-Bike Type: Urban Core and Mountain Surge
Urban commuting bikes accounted for 42.86% of sales in 2025 and remain the anchor of the e-bike motor market size through mid-decade. City authorities add protected lanes and extend employer tax perks, magnifying baseline demand. At the same time, e-MTB shipments exhibit the fastest 8.02% CAGR as high-traction torque and adaptive suspension merge with 29-inch chassis standards. Motors designed for mountain bikes integrate barometric sensors to modulate power based on gradient, improving battery utilization. Fleet urban models emphasize weather sealing and predictive maintenance alerts that cut downtime for couriers.
The two segments differ on price elasticity; e-MTBs command ASPs approximately 1.7 times that of commuter units, justifying richer motor features. Urban platforms drive scale production, pushing down per-unit electronics cost, which then trickles into performance-oriented e-MTBs. This virtuous loop helps sustain volume growth across both segments, reinforcing the the overall robustness of the e-bike motor market.
By Power Rating: Regulatory Logic
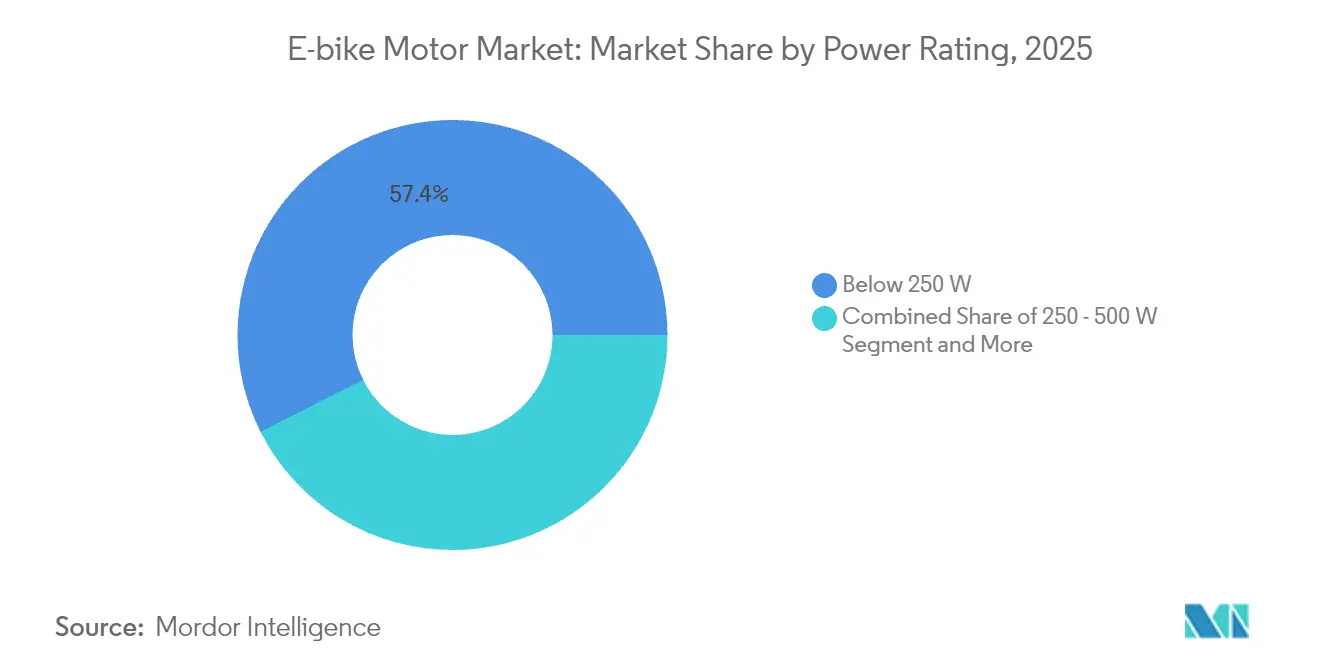
Sub-250 W motors led with 57.42% share in 2025 because they comply with EU pedelec rules that grant access to bike lanes without registration. The e-bike motor market size for this band is poised to grow steadily on the back of commuter adoption in dense cities. Conversely, motors exceeding 500 W will chart an 8.66% CAGR, fueled by North American demand for throttle-enabled Class 3 bikes. Mid-power (250–500 W) remains a bridging category favored in Asia-Pacific, where regional standards often mirror European wattage limits but allow brief peak outputs.
As policymakers revisit definitions of light-electric vehicles, suppliers develop modular controllers that let OEMs software-cap power for compliant export, lowering SKU proliferation. Battery pairing decisions revolve around duty cycle: high-power motors need larger packs, which in turn invite advanced thermal controls. Such cross-component optimization underscores the integrated nature of the e-bike motor market.
By Sales Channel: OEM First, Aftermarket Next
Factory-fit installations represented 64.05% of the market in 2025, reflecting brand strategies to build purpose-designed frames around compact mid-drive housings. Warranty bundling and telemetry-driven service plans enhance OEM stickiness. The aftermarket, while smaller, is projected for a 9.18% CAGR as consumers retrofit legacy frames. Conversion-kit suppliers introduce quick-mount torque arms and smartphone-calibrated controllers to simplify do-it-yourself projects.
Aftermarket traction is most substantial in developing markets where disposable incomes lag but repair culture thrives. Kits priced below USD 350 democratize electrification, though they often lack advanced safeguards in OEM units. Regulators may soon impose tighter safety checks, nudging kit vendors toward certified battery–motor bundles, effectively professionalizing the conversion niche within the e-bike motor market.
Geography Analysis
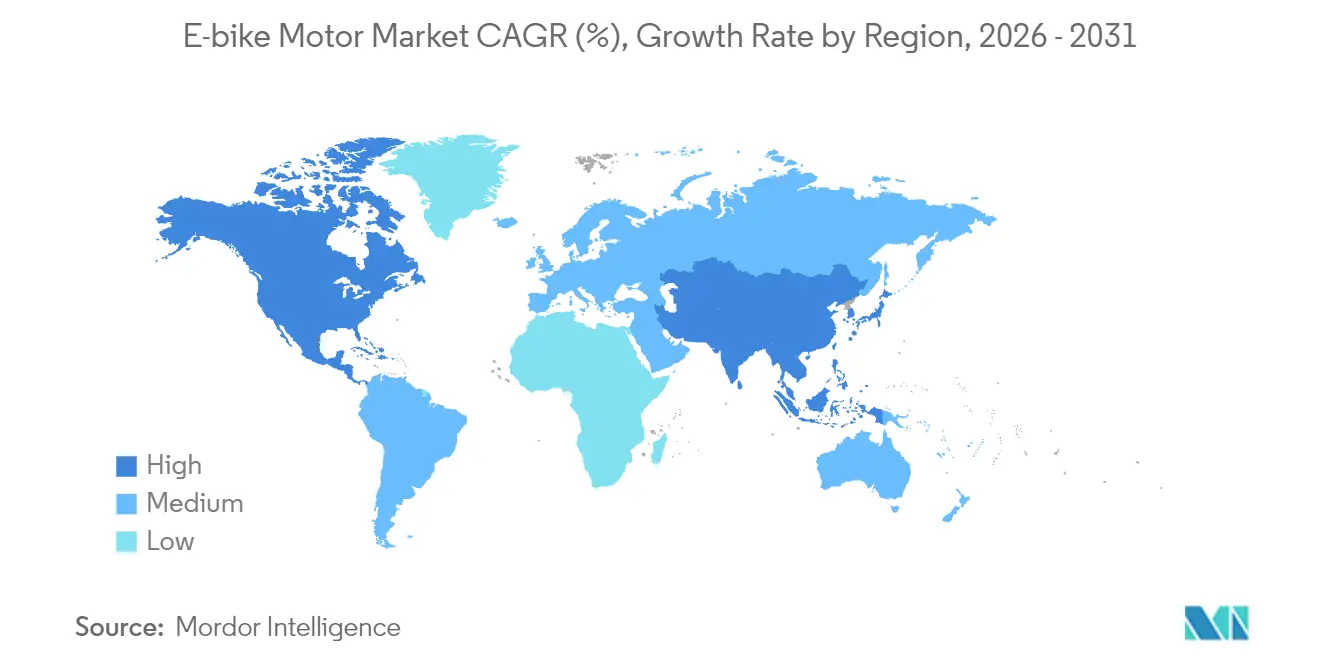
Asia-Pacific dominated with 78.05% share in 2025 due to China’s end-to-end supply chain that spans rare-earth mining to final assembly. Chinese electric two-wheeler exports exceeded CNY 40 billion (USD 5.5 billion) in 2024, underscoring regional capacity. Japan contributes premium drivetrain engineering, and India emerges as a fast-growing assembly node via joint ventures such as Musashi Seimitsu’s partnership for integrated powertrains. Regional incentives—reduced VAT and urban congestion levies—bolster domestic ownership and export competitiveness, solidifying Asia-Pacific as the cornerstone of the e-bike motor market.
North America exhibits the fastest 9.14% CAGR through 2031 as consumer preferences tilt toward high-power, throttle-enabled models. Federal stimulus for domestic manufacturing and state-level rebates spur capacity additions like eBliss Global’s New York plant. Regulatory heterogeneity across states creates niches for adaptable firmware and modular controller designs. Corporate fleet conversions and expanding trail access further diversify demand profiles, enhancing regional significance to the e-bike motor market.
Europe presents a mature but innovation-rich arena. Although unit sales tapered in 2024 amid macro headwinds, the continent remains technology-leading due to rigorous EN 15194 certification requirements. German leasing programs expand across the bloc, funneling steady orders for high-spec drive systems. Supply-chain localization efforts, notably battery-cell plants in Hungary and drive-unit factories in Poland, aim to offset Asian dependencies. As policymakers debate speed-cap harmonization, European OEMs refine motor efficiency within 250 W boundaries, reinforcing their premium brand cachet in the global e-bike motor market.

Regulatory Landscape
Safety and performance requirements are tightening across key production and demand centers, which is shifting expectations for motor electronics, power caps, and anti-tamper features. In China, GB 17761-2024 (issued December 2024, effective from September 1, 2025) updates electric bicycle safety technical requirements, while MIIT issued JB/T 10888-2025 in May 2025 to standardize technical specifications for e-bike electric motors, raising the compliance bar for the world’s largest manufacturing base.
In the United States, the Consumer Product Safety Commission advanced federal rulemaking in June 2026 by publishing a proposed safety standard for lithium-ion batteries and micromobility products, using UL 2849/UL 2271/UL 2272 as the basis with additional requirements such as tamper-resistant battery enclosures and enhanced electrical protection features. Beyond Europe, alignment with EN 15194 is expanding: the New South Wales government adopted EN 15194 in March 2026, with a full legal compliance transition by March 2029, reinforcing EN 15194 as a practical anchor for global product planning and homologation.
Value Chain Analysis
The value chain runs from upstream materials and components (copper windings, laminations, NdFeB magnets, bearings, sensors, power semiconductors, and PCBAs) to motor design, controller and firmware development, assembly, and test, before feeding into e-bike OEM integration and distribution through OEM factory-fit and aftermarket channels. System suppliers such as Bosch, Shimano, Yamaha, Bafang, and Ananda increasingly bundle motors with batteries, displays, and app connectivity. This pulls more of the electronics and software stack into the motor supplier’s scope and ties aftersales service networks more closely to diagnostics and firmware.
Manufacturing and supply risk centers on magnet sourcing and electronics lead times, while quality and yield depend on the extent of automation in winding, assembly, and inspection. Export-control and licensing frictions for FeNdB permanent magnets add procurement complexity, prompting suppliers to diversify sourcing and regionalize assembly closer to demand centers. At the same time, production footprints and processes are moving toward more vertically integrated electronics (including in-house controller assembly capability) and higher automation in coil winding and inspection to stabilize output consistency and reduce labor dependence.
Competitive Landscape
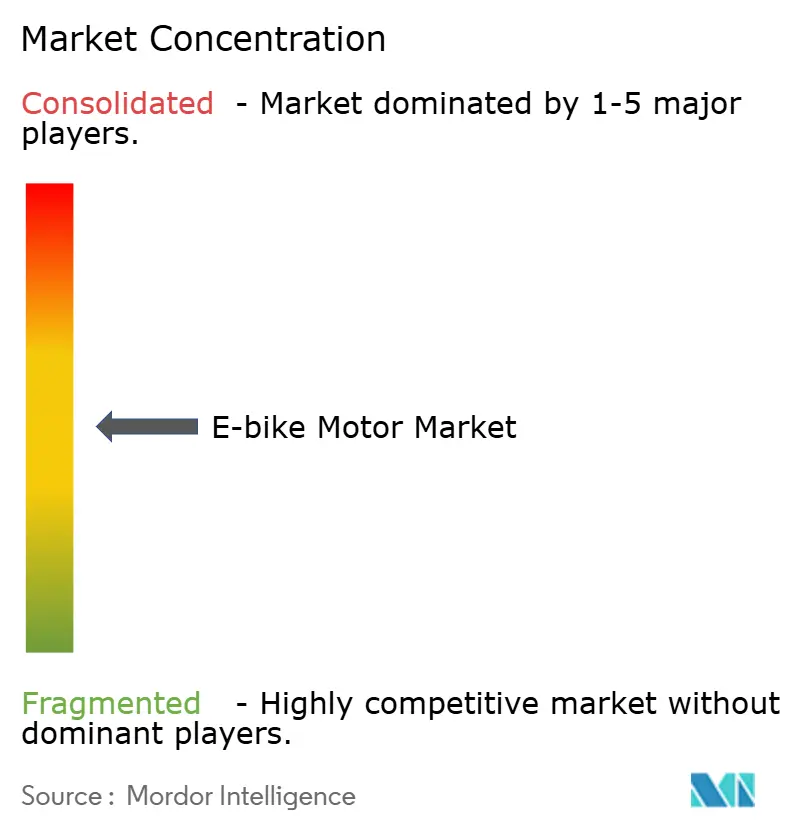
The e-bike motor market features moderate concentration; Bosch, Shimano, Yamaha, Bafang, and Brose dominate through vertically integrated systems that bundle hardware with telematics. Yamaha’s acquisition of Brose’s drive unit arm intensifies competitive pressure by fusing Brose’s European OEM ties with Yamaha’s manufacturing reach. Bosch continues to strengthen ecosystem lock-in via over-the-air features, AI range predictors, and theft-tracking services, deepening customer lifetime value.
Automotive suppliers such as ZF and SEG Automotive enter with scale advantages in power electronics and drivetrain calibration, challenging incumbents on cost and reliability. DJI’s Avinox launch signals entry by consumer-electronics firms leveraging sensor know-how and UX design. These new contenders push incumbents to accelerate firmware roadmaps and upgrade post-purchase digital services. Meanwhile, mid-drive start-ups court niche segments—cargo logistics and high-end e-MTB—offering bespoke torque profiles and automatic gearboxes, further fragmenting the e-bike motor market.
Strategic partnerships permeate the landscape. Bosch aligns with Shimano and TRP for cross-brand eShift solutions, enhancing compatibility and expanding addressable OEM pools. ZF licenses motor IP to frame makers under private-label deals, while Bafang partners with Tier-1 bearing suppliers to improve durability. Consolidation is likely to continue as software becomes the chief differentiator and capital requirements rise, suggesting the e-bike motor market heads toward an oligopolistic equilibrium.
E-bike Motor Industry Leaders
Robert Bosch GmbH
Yamaha Motor Co., Ltd
Shimano Inc
Bafang Electric (Suzhou) Co., Ltd.
Mahle GmbH
- *Disclaimer: Major Players sorted in no particular order

Market Opportunities and Future Outlook
Portfolio expansion into urban hub motors and software-defined upgrades is creating whitespace for suppliers that can deliver compliant, cost-efficient drive units at scale while meeting tightening safety requirements. Bosch eBike Systems launched its first hub-motor product line (Hub Line) in June 2026, signaling how leading mid-drive incumbents are adding hub platforms to serve high-volume urban and fleet use cases without dropping integrated ecosystems.
Manufacturing decentralization outside China is also becoming a practical lever for cost, tariff, and lead-time management, alongside growing regional demand centers. Yadea inaugurated a USD 100 million smart factory in Bac Ninh, Vietnam in March 2026, and EMotorad announced a manufacturing facility in Kuppam, Andhra Pradesh in July 2026, pointing to capacity build-out in Southeast Asia and India that can support localized e-bike production and related motor sourcing. On the compliance side, the June 2026 CPSC proposed rule on lithium-ion batteries and micromobility products raises the business case for motor suppliers that can pair drive units with safety-engineered electrical architectures, including battery enclosure robustness, protection circuitry, and validated test regimes, to reduce OEM risk and speed channel acceptance.
Recent Industry Developments
- June 2026: Bosch eBike Systems launched its first hub motor product line, Hub Line, expanding beyond its established mid-drive portfolio. The release targets the high-volume urban commuter segment where packaging, noise, and serviceability influence OEM selection. It also strengthens Bosch’s system approach by giving bike brands an additional drive architecture within the same ecosystem.
- September 2025: Yamaha introduced the PW-LINK system, a platform built around interchangeable drive units, batteries, and displays using its CAN-OPEN EDS approach. The modular system design supports OEMs that want to standardize electronics and connectivity while offering multiple performance tiers across city, trekking, and e-MTB models. This move raises switching costs by tying hardware choices to a broader Yamaha software and component stack.
- June 2024: Shimano unveiled the EP5 and E5100 drive units, extending its lineup with class-targeted motors rated at 60 Nm and 50 Nm torque respectively. The introductions broadened Shimano’s addressable base across everyday urban and trekking categories while maintaining compatibility with its service and connectivity tools. It reinforced competitive pressure on other suppliers to refresh mid-tier offerings with clearer segment positioning.


Research Methodology Framework and Report Scope
Market Definition and Coverage
This market is defined as the revenue generated from motors used to propel electric bicycles. It includes units sold through original equipment fitment and units driven by replacement or retrofit demand, across major regions.
Scope exclusions: We exclude the full e-bike vehicle value, batteries, chargers, controllers sold as standalone electronics, and non-e-bike light electric vehicles such as e-scooters and motorcycles.
Segmentation Overview
- By Motor Type
- Hub Motor
- Mid-drive Motor
- By E-Bike Type
- Urban / City
- E-Mountain / EMTB
- E-Cargo
- By Power Rating
- Below 250 W
- 250 - 500 W
- Above 500 W
- By Sales Channel
- OEM / Factory-fit
- Aftermarket / Retrofit
- By Geography
- North America
- United States
- Canada
- Rest of North America
- South America
- Brazil
- Argentina
- Rest of South America
- Europe
- Germany
- United Kingdom
- France
- Italy
- Spain
- Netherlands
- Russia
- Rest of Europe
- Asia-Pacific
- China
- Japan
- India
- South Korea
- Australia
- Rest of Asia-Pacific
- Middle-East and Africa
- United Arab Emirates
- Saudi Arabia
- Turkey
- Egypt
- South Africa
- Rest of Middle-East and Africa
- North America
Data Sources, Market Sizing, and Validation
Desk Research
To structure the model, we first gathered public signals that explain where e-bike demand and motor supply are moving. Common sources include transport and road safety agencies, customs and trade statistics portals, and energy and emissions policy publications. These help interpret adoption drivers and regulatory limits, including the 250W class rule used in some markets.
We also reviewed technical and safety references, such as standards body publications and patent databases, to understand how hub and mid-drive designs are evolving and which features are becoming mainstream. Company annual reports, investor presentations, and reputable press coverage were used to cross-check product mix and channel emphasis, OEM versus aftermarket, and to track capacity additions. Where needed, we complemented this with approved paid subscriptions for company financials and intelligence, news and financials, patent lookups, and shipment-level import and export checks. These desk research sources are illustrative only, and many other public and secondary references were also used for data collection, validation, and research clarification.
Primary Interviews and Surveys
Primary interviews and surveys were used to pressure-test the desk assumptions that typically move the total, including motor ASP ranges, the share of mid-drive versus hub by bike category, and how much aftermarket demand shows up in each region. We spoke with a mix of component suppliers, assemblers, distributors, and e-bike OEM-side stakeholders, then re-checked the logic with retailers and fleet-focused buyers where cargo and utility bikes matter.
Because this is a global market, inputs were balanced across APAC, EMEA, and the Americas, so regional mix, regulation, and product preferences were not over-generalized.
Distribution of primary research fieldwork respondents
| Company type | Respondent position | Region |
|---|---|---|
| Top tier: 37% | CXOs: 17% | APAC: 43% |
| Mid tier: 42% | Functional/Unit leaders: 24% | EMEA: 37% |
| Smaller Players: 21% | Managers: 59% | Americas: 20% |
Market-Sizing & Forecasting
The market size is built using top-down and bottom-up model logic. We reconstruct e-bike production and sales indicators by region, then translate that into motor demand using fitment rates and typical motor configurations by bike type (urban, e-mountain, and cargo). To keep totals realistic, we corroborate them with selective bottom-up checks, including sampled motor ASP by power band (below 250W, 250 to 500W, and above 500W) and channel split approximations for OEM versus aftermarket.
Key inputs tracked and updated in the model include e-bike unit volumes by region, penetration of mid-drive versus hub motors by category, average motor pricing by wattage and torque positioning, the share of retrofit and replacement purchases, and the shift in demand toward cargo bikes in last-mile use. When a country-level series was missing, we fill gaps using regional proxies and policy and income comparables, then validate implied motor volumes against trade flows and interview feedback.
For forecasting, scenario analysis is used so the outlook reflects how incentives, urban mobility rules, and supply constraints can change the slope across regions. Assumptions for each driver are adjusted after primary discussions, and a small set of cases is kept so the forecast stays explainable and repeatable.
Data Validation & Update Cycle
Before finalizing, we triangulate market totals using independent signals that should move in the same direction, such as e-bike unit growth, motor mix shifts, and observed pricing ranges in major regions. Variance checks are run at multiple levels, including region, channel, and power class, and outliers are reviewed again so one noisy input does not distort the final value.
Analyst review happens in steps, first on the structure and assumptions, then on the numbers and consistency across sections. If a major variance appears against updated trade data, policy changes, or a sharp pricing move, we re-contact respondents to confirm what changed and how long it may last. Reports refresh annually, and material events trigger interim updates, followed by a final pre-delivery pass so clients receive the latest view.
Mordor Intelligence's E Bike Motor Market Size Versus Other Published Estimates
Published market values for e-bike motors often differ because the scope is not consistent, and because pricing and channel assumptions are handled differently. The most common differences come from whether the estimate includes full drive units and bundled electronics, how OEM versus aftermarket is treated, and which power classes are assumed to dominate each region.
Some published figures lean toward a broader definition that blends motor revenue with adjacent drivetrain or drive unit content. For the Mordor Intelligence estimate, the total is limited to motor value across OEM and aftermarket channels, and it is sized using e-bike type mix and power rating bands so the demand pool stays tied to real fitment patterns.
Benchmark comparison
| Source | Market Size | Gaps in Research Methodology |
|---|---|---|
| Mordor Intelligence | USD 4.61 B (2026) | |
| Trade Journal A | USD 7.18 B (2024) | This figure is presented as a drive unit view in public commentary, which can fold in gearbox and integrated electronics content, and it is also anchored to an earlier year where mix and pricing can look different. |
| Industry Publisher B | USD 6.80 B (2025) | The estimate appears to use a broader revenue pool and a faster growth setup that can overstate premium motor penetration, with limited transparency on how OEM versus retrofit volumes are separated. |
The spread in the table mostly comes from how narrowly the product counted is defined and how channel and mix assumptions are built into pricing. By keeping the sizing tied to e-bike volumes, motor fitment by category, and realistic ASP ranges by power band, the resulting number stays traceable to inputs that can be checked and updated each year.


Key Questions Answered in the Report
How big is the E-bike Motor Market?
The e-bike motor market size stands at USD 4.61 billion in 2026 and is forecast to reach USD 6.39 billion by 2031, translating into a 6.72% CAGR.
Which motor type is gaining share the fastest?
Mid-drive systems are projected to grow at an 8.36% CAGR through 2031.
Why are rare-earth magnets a risk factor?
China controls 85% of processing capacity, exposing manufacturers to price spikes and supply disruptions
Which region is expanding the quickest?
North America shows the highest regional CAGR at 9.14% due to demand for high-power, throttle-enabled models.
Page last updated on:


 Your data is secure and never sold or shared.


