
E-Bike Battery Pack Market Size and Share
Market Overview
| Study Period | 2020 - 2031 |
|---|---|
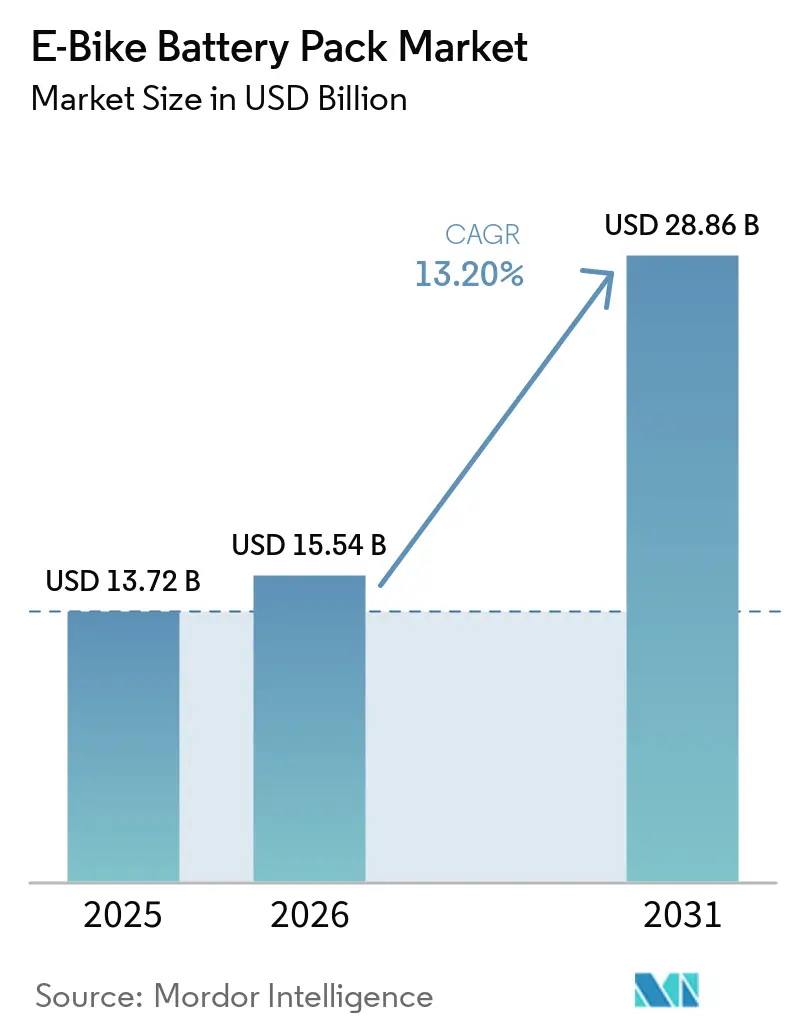
| Market Size (2026) | USD 15.54 Billion |
| Market Size (2031) | USD 28.86 Billion |
| Growth Rate (2026 - 2031) | 13.20 % |
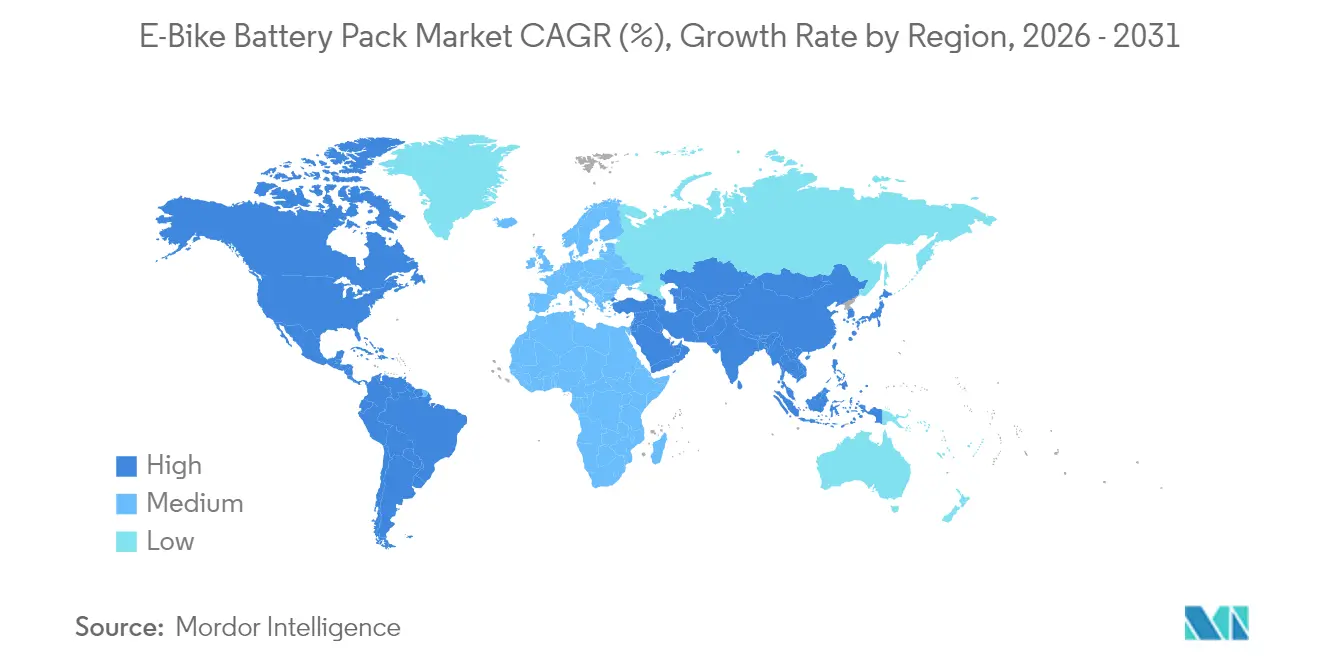
| Fastest Growing Market | South America |
| Largest Market | Asia Pacific |
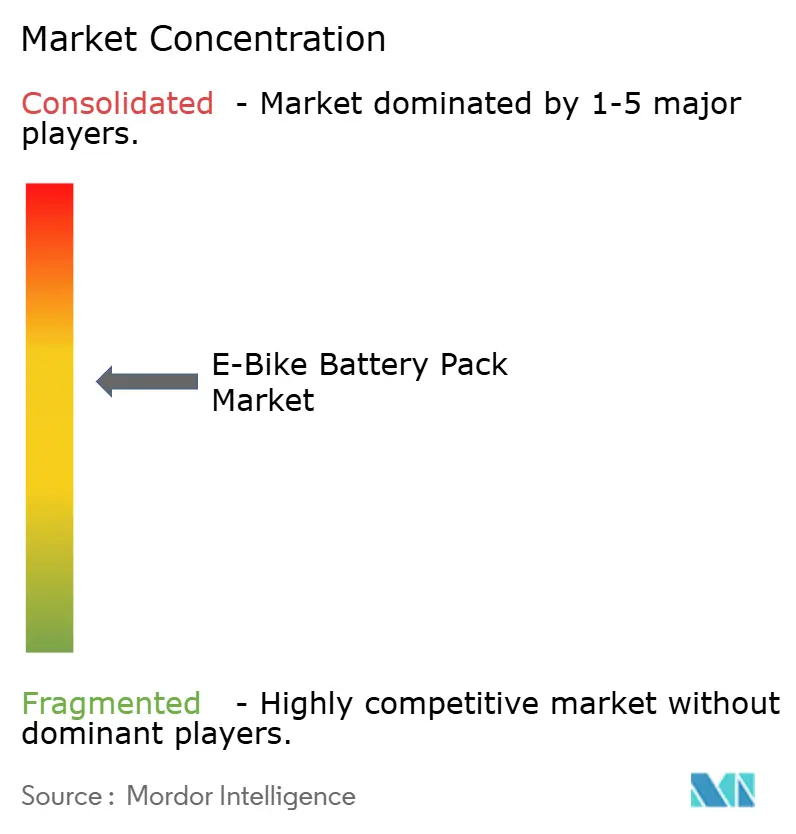
| Market Concentration | Medium |
Major Players *Disclaimer: Major Players sorted in no particular order Image © Mordor Intelligence. Reuse requires attribution under CC BY 4.0. | |
E-Bike Battery Pack Market Analysis by Mordor Intelligence
The e-bike battery pack market size in 2026 is estimated at USD 15.54 billion, growing from 2025 value of USD 13.72 billion with 2031 projections showing USD 28.86 billion, growing at 13.2% CAGR over 2026-2031. Rising urban population density, falling lithium-ion cell costs, and supportive purchase incentives in more than 40 countries together widen the addressable customer base. Sodium-ion pilot lines scheduled for large-scale output from 2025 onward add a low-cost chemistry pathway that could broaden access in price-sensitive regions. Commercial fleet electrification further accelerates demand by favoring high-cycle-life packs over pure energy density gains. At the same time, supply-chain domination by China introduces geopolitical risk, and tightening urban fire-safety rules impose new certification hurdles.
Key Report Takeaways
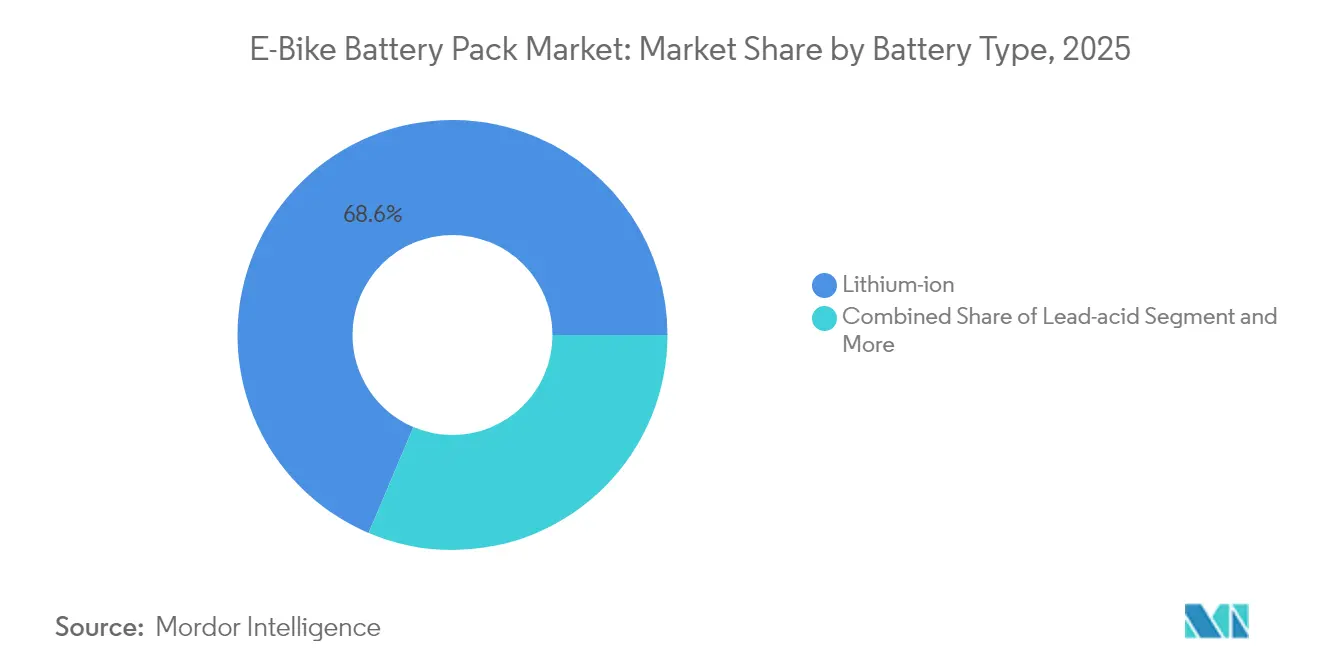
- By battery type, lithium-ion commanded 68.62% of e-bike battery market share in 2025, and is projected to register the fastest 14.87% CAGR through 2031.
- By battery pack position, down-tube solutions led with 70.45% revenue share in 2025; rear-carrier packs are forecast to grow at a 14.05% CAGR to 2031.
- By voltage class, less than/equal to 36 V systems accounted for 52.64% of the e-bike battery market size in 2025, whereas above 48 V systems are advancing at 15.12% CAGR through 2031.
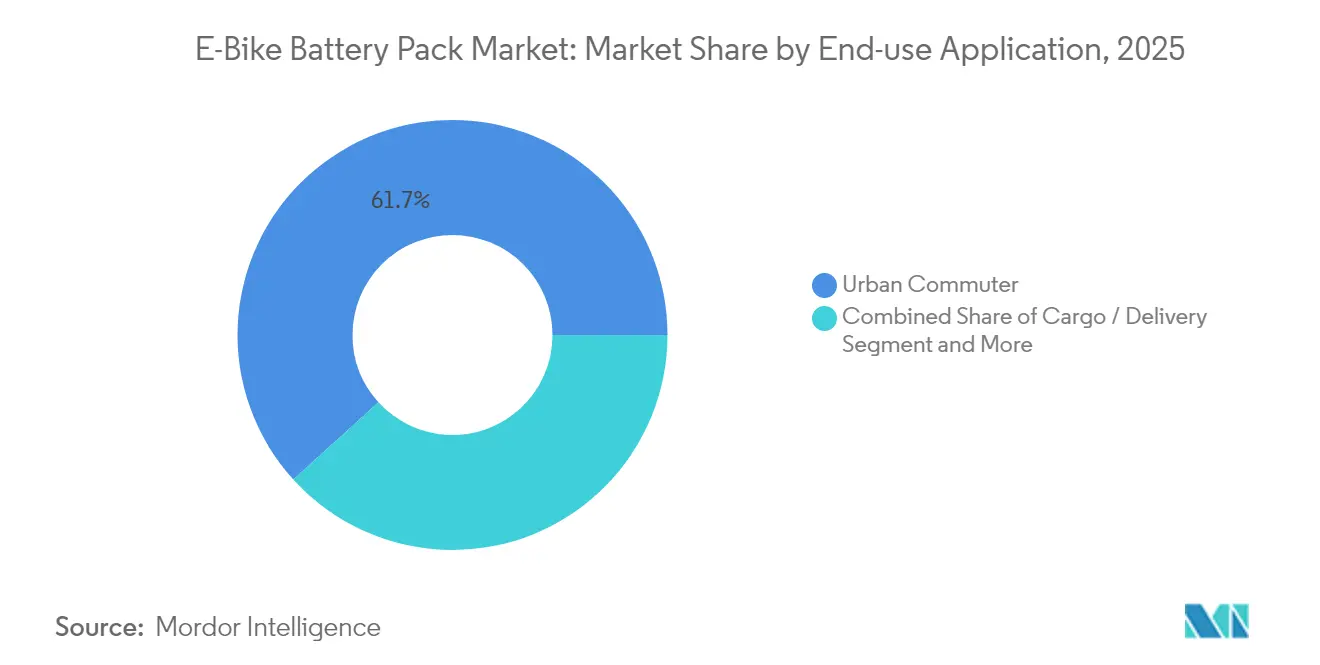
- By end-use application, urban commuter bikes held 61.73% share of the e-bike battery market size in 2025 and cargo/delivery bikes are progressing at a 15.74% CAGR through 2031.
- By distribution channel, OEM-integrated batteries represented 72.58% revenue share in 2025; aftermarket replacements record the highest 14.42% CAGR to 2031.
- By geography, Asia-Pacific retained 56.60% of the e-bike battery market share in 2025, while South America exhibits the strongest 16.55% regional CAGR to 2031.
Note: Market size and forecast figures in this report are generated using Mordor Intelligence’s proprietary estimation framework, updated with the latest available data and insights as of 2026.
Market Trends and Insights
Drivers Impact Analysis of E-Bike Battery Pack Market*
| Driver | (~)% Impact on CAGR Forecast | Geographic Relevance | Impact Timeline |
|---|---|---|---|
| Cost Down Trend in Li-ion | +2.2% | Global, strongest in Asia-Pacific and Europe | Short term (≤ 2 years) |
| Urban Delivery Fuels High-Cycle Packs | +1.8% | North America and EU core; growing in Asia-Pacific | Medium term (2-4 years) |
| Government Purchase Incentives | +1.5% | Europe and North America lead; emerging South America | Medium term (2-4 years) |
| Battery as a Service Models | +1.3% | Asia-Pacific core; pilots in Europe and North America | Long term (≥ 4 years) |
| Fast-Charge Cylindrical Formats | +0.9% | Global; early premium adoption | Short term (≤ 2 years) |
| Sodium-Ion Low-Cost Entry Bikes | +0.7% | China-centric; expanding globally | Long term (≥ 4 years) |
| Source: Mordor Intelligence | |||


Cost-Down Trend in Li-ion Cells
Lithium-ion pack prices fell 20% in 2024, reaching USD 115 per kWh at the pack level, while cell costs also slid. These declines stem from gigafactory scale economies, optimized NMC and LFP cathode chemistries, and streamlined logistics between cathode producers and pack assemblers. Lower pack prices let brands offer extended-range models without raising retail tags, drawing cost-sensitive buyers into the e-bike battery market. Vertical integration strategies from cell to module adopted by major Asian suppliers stabilize margins despite raw-material volatility. Western manufacturers instead differentiate via UL 2849 certifications and longer warranties, reflecting diverging competitive postures. Raw-material spikes or fresh tariffs could slow the deflationary curve, yet the structural cost advantage of larger plants remains intact.
Urban-Last-Mile Delivery Boom Fuels High-Cycle Packs
Commercial operators now demand packs that withstand more than 1,000 cycles each year, far exceeding the 50-100 cycles typical for leisure riders. UPS has deployed over 10,000 low-emission vehicles, including e-bikes worldwide, to cut downtown delivery emissions, pushing suppliers toward LFP chemistry valued for its cycle life [1]“UPS expands global e-bike fleet,” UPS, ups.com. Food-delivery apps subsidize e-bike purchases for couriers, generating aggregated volumes that justify fit-for-purpose battery lines. High-cycle duty elevates the role of battery-management software capable of optimally throttling charge rates and monitoring cell temperatures. The e-bike battery market thus segments into consumer-range packs and commercial-grade solutions, each carrying distinct value propositions. Advanced telemetry further lowers lifetime cost per kilometer for fleet managers by predicting swap or service windows.
Government Purchase Incentives in More Than 40 Countries
France’s EUR 4,000 (~USD 4,696) grant for cargo e-bikes and Germany’s company-bike leasing tax benefits, combine to trim effective purchase prices [2]“Cargo-bike purchase subsidy,” French Ministry for Ecological Transition, gouv.fr. Forty-plus national programs share a policy logic that views e-bikes as congestion-relief tools, not discretionary gadgets. Many schemes earmark larger battery capacities for cargo or adaptive bikes, indirectly lifting watt-hour demand even when unit sales plateau. Funding continuity depends on annual budgets, so suppliers diversify go-to-market plans rather than anchor forecasts to subsidies alone. Early adopters in South America emulate European models, signaling policy diffusion that could unlock fresh volume corridors across Bogotá, São Paulo, and Santiago.
Battery-as-a-Service (BaaS) Models for Shared Fleets
Hero MotoCorp’s VIDA program decouples vehicle and battery ownership, charging riders a subscription that includes guaranteed swaps and technology upgrades. The model lowers upfront expense, improves residual values, and builds annuity revenue for providers. Integrating grid-interactive platforms such as Nuvve’s helps operators earn ancillary income by exporting power during peak demand, potentially offsetting subscription fees. BaaS demands dense swap infrastructure and accurate state-of-health analytics to meet consumer convenience benchmarks. Successful pilots in Asia broaden investor appetite for similar offerings in Europe’s shared mobility fleets. Over time, BaaS could lift the e-bike battery market by shortening replacement cycles, thereby raising cumulative cell demand.
Restraints Impact Analysis of E-Bike Battery Pack Market*
| Restraint | (~)% Impact on CAGR Forecast | Geographic Relevance | Impact Timeline |
|---|---|---|---|
| Small-Pack Premium vs EV | -1.8% | Global; highest in cost-sensitive regions | Medium term (2-4 years) |
| Fire-Safety and Insurance Restrictions | -1.2% | North America & EU urban centers; rising APAC | Short term (≤ 2 years) |
| China-Centric Cell Supply Risk | -0.9% | Global chains; largest impact on West | Medium term (2-4 years) |
| Warranty Gap Limits Cost Parity | -0.7% | Global; acute in commercial fleets | Long term (≥ 4 years) |
| Source: Mordor Intelligence | |||
Small-Pack USD/kWh Premium vs. EV (Above 40%)
E-bike packs cost more than 40% per kWh above auto-grade batteries because each design must fit unique frame geometries and meet small-scale certification hurdles. Fixed costs for BMS hardware, enclosure tooling, and UN 38.3 transport testing weigh heavier when spread across modest watt-hour volumes. Suppliers respond with modular platforms that share cells and electronics across multiple models, yet the dilution effect remains limited. While the premium strains entry-level affordability, premium commuters absorb it in favor of lighter weight. Convergence with automotive cylindrical formats could narrow the gap, but only if e-bike frame makers align mounting standards and achieve higher lot sizes.
Fire-Safety and Insurance Restrictions in Dense Cities
A rise in lithium-ion incidents led New York City to require UL 2849 certification for any e-bike sold after September 2023 and prompted Transport for London to ban uncertified devices from the underground network [3]“Lithium-ion battery incident statistical report,” New York City Fire Department, nyc.gov. Property insurers follow suit, imposing storage surcharges that lift total ownership costs. Pack builders now integrate thermal-runaway barriers, shutdown separators, and cell-level fusing, which incrementally raise bill-of-materials expense. Smaller brands lacking in-house testing capabilities risk market exit, accelerating consolidation. Nonetheless, stringent rules also elevate consumer trust and could unlock pent-up demand once certification coverage becomes universal.
*Our forecasts treat driver/restraint impacts as directional, not additive. The impact forecasts reflect baseline growth, mix effects, and variable interactions.
E-Bike Battery Pack Market Segment Analysis
By Battery Type:
Cost Leadership Meets Chemistry DiversificationLithium-ion technology held 68.62% of e-bike battery market share in 2025. The segment is projected to grow at a 14.87% CAGR, supported by falling NMC and LFP costs that reinforce the overall e-bike battery market. Entry-level manufacturers keep lead-acid alive for its ultra-low sticker price, yet weight and cycle-life penalties confine its role to niche rural geographies. Sodium-ion’s 2025 commercial release illustrates how lower-density chemistries can unlock fresh consumer layers without government subsidies. Over the forecast period, lithium-ion will remain the anchor of the e-bike battery industry, but cost-driven segments shift toward sodium-ion once pack volumes cross economic break-even thresholds.
Competitive dynamics differ by chemistry. CATL’s TECTRANS lifetime-extension coating promises durability for LFP packs, a decisive advantage in high-cycle fleets. On the other hand, Yadea leverages sodium-ion’s cold-weather resilience to broaden sales in northern China, Russia, and Scandinavia. Premium brands chase NMC811 cathodes for extended range, but commercial fleets increasingly adopt LFP to minimize replacement downtime. The coexistence of multiple chemistries supports a layered supply ecosystem, mitigating single-technology dependence risk within the e-bike battery market.


By Battery Pack Position Type:
Accessibility Versus IntegrationDown-tube packs commanded 70.45% of 2025 revenue, favored for balanced weight distribution and sleek aesthetics that mirror conventional bike silhouettes. Rear-carrier modules are set to expand 14.05% annually as cargo and family bikes require higher capacities that cannot fit within slender down tubes. Manufacturers of commercial delivery bikes choose rack-top positioning to enable quick swaps without dismantling frame covers, a feature that directly lowers courier downtime. Integrated in-frame cavities attract premium urban commuters who value theft resistance and weather sealing, even if servicing becomes more labor-intensive.
Regulatory changes that mandate battery removability for apartment storage complicate full integration strategies. Bosch’s digital Battery Lock seeks to square the circle by allowing user-controlled unlock via a phone app when removal is required for indoor charging. Platform designers now offer modular rails that accept both down-tube and rear-carrier packs, granting OEMs flexibility to serve multiple customer personas while ordering common cells. The debate will ultimately center on maintenance convenience versus visual appeal, keeping both approaches relevant inside the e-bike battery market.
By Voltage Class:
Performance Scaling Within Regulatory LimitsSystems rated less than/equal to 36 V held 52.64% of 2025 sales because many jurisdictions cap assisted-speed classes at this voltage, allowing riders to avoid motorcycle licensing rules. Yet configurations above 48 V will post the fastest 15.12% CAGR as performance-oriented consumers demand stronger hill-climb torque and cargo operators seek greater payload capability. Intermediate 37-48 V systems split the difference, especially in regions where 45 km/h speed-pedelec categories sit in regulatory gray zones. Samsung SDI’s forthcoming 46-series cylindrical cells increase volumetric energy, enabling builders to hit 55 Nm torque targets without enlarging pack footprints.
Voltage unfamiliarity among bike shops and emergency responders remains a barrier, prompting OEMs to integrate clearer labeling and automatic discharge circuitry for maintenance safety. Over the forecast window, harmonization of UL and EN standards is expected to streamline compliance across voltage tiers, smoothing cross-border sales for global brands. As a result, a tiered structure will persist, but upward migration in performance segments will lift average pack watt-hours, amplifying the overall e-bike battery market size.
By End-Use Application:
Commercial Demand Redefines SpecificationsUrban commuters absorbed 61.73% of market revenue in 2025, reflecting household adoption for work journeys under 10 km. Logistics firms, however, turn cargo and delivery bikes into the prime growth engine at 15.74% CAGR, driving innovation beyond pure range metrics. UPS’s 10,000 fleet confirms that pack durability and rapid-charge capability trump ultra-high density in daily operations. Food-delivery platforms follow suit by co-financing bikes that guarantee 1,200 charge cycles, catalyzing demand for LFP and forthcoming sodium-ion chemistries less sensitive to deep discharges.
Mountain and trekking bikes retain a loyal enthusiast base, but they contribute smaller absolute volumes owing to higher entry costs and a preference for seasonal usage. Folding bikes gain momentum in megacities where apartment storage restrictions limit full-size frames. This widening array of use cases forces cell suppliers to broaden product catalogs, ensuring that the e-bike battery industry meets differentiated cycle-life, power, and weight targets without straining manufacturing economics.
By Distribution Channel:
OEM Control Meets Aftermarket FlexibilityOEM-fitted batteries made up 72.58% of 2025 shipments as brands pursued end-to-end quality assurance and integrated service offerings. Aftermarket replacements are growing 14.42% annually, fueled by capacity upgrades once original packs degrade and by DIY retrofits of legacy pedal bicycles. Standardized rail systems such as EnergyBus facilitate safe cross-brand compatibility, but leading OEMs restrict BMS firmware to prevent unauthorized packs from pairing with their controllers. Independent pack assemblers counter by offering price advantages and higher watt-hours, appealing to budget-minded consumers even at the expense of warranty loss.
The channel competition sharpens as right-to-repair legislation in the EU and certain U.S. states gives consumers more freedom to source batteries outside brand networks. Yet insurers and fleet managers often specify UL-certified OEM packs to reduce liability exposure, preserving the OEM channel’s dominance in commercial segments. Hybrid approaches emerge where manufacturers sell upgrade kits through authorized dealers, blending control with customer choice while sustaining recurring revenue within the e-bike battery market.
Geography Analysis
APAC and Europe E-Bike Battery Pack Market
Asia-Pacific held 56.60% of global 2025 revenue, with China exporting electric motorcycles and e-bikes exceeded 40 billion yuan (USD 5.5 billion) that year. Korea and Japan contribute advanced cell R&D that trickles into premium European brands, while India’s e-two-wheeler unit sales in FY 2025 underscore latent demand for electric two-wheeler battery solutions in value-driven segments. Despite its dominance, the region’s dependency on domestic lithium processing invites tariff risk, pushing some suppliers to establish satellite assembly in Vietnam and Hungary for tariff-neutral shipping into the West.
South America E-Bike Battery Pack Market
South America will clock a 16.55% CAGR through 2031. Bogotá’s CicloRUTA expansion, São Paulo’s low-interest e-bike loans, and Brazilian tax rebates create fertile ground for both commuter and cargo models. Supply-chain gaps—chiefly in certified service centers and battery recycling—could temper adoption, prompting governments to court foreign direct investment in localized pack assembly. Regional growth accelerates once sodium-ion packs cut initial vehicle prices and mitigate range loss under tropical temperatures.
Europe and North America E-Bike Battery Pack Market
Europe and North America represent relatively mature arenas yet still promise mid-single-digit growth as policy measures intensify. France’s cargo-bike grants and Germany’s company-bike leasing encourage larger battery formats, prolonging replacement cycles yet raising aggregate watt-hour demand. The EU Battery Regulation will mandate digital passports by 2027, adding administrative overhead that larger suppliers can absorb more easily. In the United States, a federal tax credit plus California’s voucher stack together to drive suburban uptake beyond core urban centers. Fire-safety rules tightening in New York and San Francisco may momentarily slow momentum, but improved certification compliance is expected to restore growth by 2026.

Regulatory Landscape
Safety and sustainability compliance is tightening across major demand centers, moving e-bike battery packs from voluntary standards to enforceable requirements. In the United States, the Consumer Product Safety Commission (CPSC) published a Notice of Proposed Rulemaking in June 2026 to establish mandatory safety requirements for lithium-ion batteries used in micromobility products, referencing modified UL 2849/UL 2271/UL 2272 frameworks. Several large cities and transit operators already restrict uncertified devices, which raises the value of system-level certification covering batteries, chargers, and electrical systems.
In Europe, Regulation (EU) 2023/1542 classifies e-bike batteries as Light Means of Transport (LMT) batteries and introduces phased labeling and documentation obligations. Required on-pack labels take effect from August 2026, and battery passport requirements commence from 2027 for specified categories. This regulatory stack also builds on harmonized product standards (EN 15194 and battery-safety standard EN 50604-1), increasing third-party testing intensity and pushing OEMs and pack assemblers toward standardized traceability, clearer labeling, and more robust battery-management and thermal-safety designs to keep access to the EU and North American markets.
Value Chain Analysis
The e-bike battery pack value chain runs from raw materials (lithium, nickel, manganese, and iron phosphate) through precursor and cathode/anode production, cell manufacturing (NMC/LFP and emerging sodium-ion), and module and pack assembly (BMS, enclosures, interconnects, and thermal barriers). It then extends to certification and logistics, including UN 38.3 transport testing and UL/EN safety compliance, before reaching downstream channels such as OEM integration and aftermarket replacement via dealers and service networks. The highest value-add is increasingly tied to upstream moves and software differentiation, as pack builders rely on safety-certified architectures, including UL 2849 system-level compliance in the United States, and on smart BMS diagnostics for fleet use and warranty management.
Supplier strategies are also shifting earlier into the design cycle. In June 2025, Molicel and Darfon Energy partnered to integrate high-energy-density INR 21700 cells into Darfon e-bike battery packs, reflecting tighter cell-to-pack co-development aimed at meeting performance and form-factor constraints. Trade and compliance friction is influencing flow paths as well: in August 2025, Riese and Muller paused US shipments citing tariff uncertainty, reinforcing the importance of multi-region assembly, warehousing, and certification-ready service ecosystems for OEMs and pack suppliers.
Competitive Landscape
Competition is moderately fragmented. Samsung SDI has accelerated production of 46-series fast-charge cylindrical cells specifically for micro-mobility, leveraging automotive scale for cost leadership. CATL’s commercial sodium-ion roll-out targets value bikes and utility fleets, diversifying away from lithium dependence and buffering against LFP price swings. Bosch eBike Systems integrates 21700 cells into its PowerTube line, coupling hardware with sophisticated software that enhances dealer-level diagnostics.
Strategic moves extend beyond chemistry. Yamaha acquired Brose’s e-bike drive unit in 2025 to bundle motors, controllers, and batteries under one roof, signaling vertical integration as a route to margin defense. Panasonic and LG Energy Solution explore cell-leasing partnerships with European shared-bike operators, aspiring to steady second-life value streams. Start-ups such as Anod pivot to hybrid super-capacitors that promise ultra-fast charging, albeit with energy-density trade-offs. Incumbents answer by investing in solid-state R&D, hedging against a long-term leap in performance standards.
Midsize players in Europe and North America carve out niches in UL 2849-certified premium packs where customers pay for enhanced safety and longer warranty coverage. However, escalating certification costs and warranty liabilities pressure thin operating margins, raising the prospect of consolidation. Overall, brands capable of married hardware-software portfolios and diversified chemistry pipelines are best positioned to navigate evolving regional rules and user requirements within the e-bike battery industry.
E-Bike Battery Pack Industry Leaders
Samsung SDI Co., Ltd.
Panasonic Industry
Shimano Inc.
BMZ GmbH
LG Energy Solution, Ltd.
- *Disclaimer: Major Players sorted in no particular order
E-Bike Battery Pack Market Companies Covered in this Report
- Samsung SDI Co., Ltd.
- Panasonic Industry
- Shimano Inc.
- BMZ GmbH
- LG Energy Solution, Ltd.
- CATL
- Bafang Electric (Suzhou) Co., Ltd.
- Bosch eBike Systems
- Mahle GmbH
- Kingbo Power Technology Co., Ltd.
- Yoku Energy
- ENERdan GmbH
- Giant Manufacturing Co., Ltd.
- Accell Group

Market Opportunities and Future Outlook
Compliance-driven upgrades create a replacement and redesign opportunity for certified packs and full electrical-system safety, especially in dense cities where uncertified devices face restrictions. New York Citys UL 2849 requirement (effective for e-bikes sold after September 2023) and the CPSC June 2026 proposed federal rulemaking shift demand toward packs with verifiable test coverage, stronger thermal protection, and traceable components. This tends to favor suppliers able to industrialize third-party testing, documentation, and dealer-facing diagnostics.
Lifecycle documentation and labeling requirements under the EU Batteries Regulation (EU) 2023/1542 also open space for battery identity, tracking, and digital compliance tooling, alongside services that support OEMs and assemblers in meeting phased obligations such as LMT labeling from August 2026 and battery passports beginning in 2027 for specified categories. Commercial and shared-mobility operators add further pull through higher-throughput pack ecosystems, with the market already segmenting toward high-cycle cargo and delivery packs (often LFP-leaning for durability) and toward swap-enabled infrastructure where uptime and maintenance predictability can be monetized. Against this backdrop, demand is building for standardized pack platforms (cells, BMS, rails, and connectors), certified aftermarket options aligned with right-to-repair pressure, and localized assembly footprints that reduce tariff and lead-time exposure while keeping compliance documentation consistent across regions.
Recent Industry Developments in E-Bike Battery Pack Market
- June 2026: The US Consumer Product Safety Commission (CPSC) published a Notice of Proposed Rulemaking to establish mandatory safety requirements for lithium-ion batteries used in micromobility products, including e-bikes, based on modified UL 2849/UL 2271/UL 2272 approaches. The proposal formalizes a pathway from voluntary certification to enforceable federal requirements, raising the compliance bar for battery packs, chargers, and integrated electrical systems. Pack makers with established test programs and documentation workflows gain an advantage as OEMs seek lower regulatory and liability risk.
- September 2025: GeB (General Electronic Battery) and EcoCycle announced a supply partnership for e-bike battery packs, supported by GeBs upgraded smart manufacturing facility in Shenzhen. The move underscores continued scaling of China-based pack production while highlighting OEM preference for qualified, repeatable manufacturing lines to support warranty and safety demands. It also strengthens supplier positioning for high-volume fleet and OEM channels where consistent pack quality and traceability are critical.
- December 2024: The United Kingdom issued statutory guidance requiring businesses that manufacture or distribute lithium-ion e-bike batteries to integrate enhanced safety mechanisms addressing fire-hazard risks. The guidance increased scrutiny of pack design choices such as protective electronics, cell-level safeguards, and safe charging practices, influencing sourcing decisions by brands and distributors. It also accelerated the shift toward third-party-tested products as retailers and insurers tighten acceptance criteria.


E-Bike Battery Pack Market Report Scope and Research Methodology
Market Definition and Coverage
For this study, the market covers rechargeable battery packs sold for electric bicycles, including packs bundled with new e-bikes and replacement packs sold through the aftermarket. Revenue is counted at the battery pack level and tracked across the main geographies where e-bike demand and supply are active.
Scope exclusions: Batteries used for e-motorcycles, e-scooters, and other light electric vehicles that are not sold and used as e-bikes are excluded.
Segments Covered in This Report
- By Battery Type
- Lithium-ion
- NMC
- LFP
- Lead-acid
- Other Chemistries (Ni-MH, Na-ion)
- Lithium-ion
- By Battery Pack Position Type
- Rear Carrier
- Down Tube
- In-Frame / Integrated
- By Voltage Class
- Less than/equals 36 V
- 37-48 V
- Above 48 V
- By End-use Application
- Urban Commuter
- Cargo / Delivery
- Mountain / Trekking
- Folding / Micro-mobility
- By Distribution Channel
- OEM-fitted
- Aftermarket Replacement
- By Geography
- North America
- United States
- Canada
- Mexico
- South America
- Brazil
- Argentina
- Rest of South America
- Europe
- United Kingdom
- Germany
- France
- Italy
- Rest of Europe
- Asia-Pacific
- China
- India
- Japan
- South Korea
- Rest of Asia-Pacific
- Middle East and Africa
- Saudi Arabia
- United Arab Emirates
- South Africa
- Egypt
- Rest of Middle East and Africa
- North America
Data Sources, Market Sizing, and Validation
Desk Research
Desk research starts with a clear view of e-bike demand and the battery pack choices that come with it. We referenced public sources such as UN Comtrade trade statistics for lithium-ion batteries and components, IEA batteries and EV related statistics where applicable, and national transport or mobility agencies that publish cycling and micro-mobility indicators.
To keep the supply side grounded, we also reviewed sources such as International Electrotechnical Commission (IEC) safety standards summaries, US and EU recall databases for battery safety incidents, and peer reviewed journals that discuss energy density, cycle life, and thermal safety trends. These inputs are paired with company filings, investor presentations, and reputed press coverage to understand capacity additions, chemistry shifts, and pricing direction. For company financials, patent lookups, and shipment-level trade checks, we used a limited set of paid database subscriptions where needed. The sources listed above are illustrative, and we also referred to other public and subscription sources for data collection, validation, and research clarification.
Primary Interviews and Surveys
Primary work focused on validating what pack makers and e-bike assemblers are shipping, and how pricing is changing as cell formats and chemistries shift. We spoke with a mix of battery pack suppliers, e-bike OEM teams, distributors, and service and repair channels, then used their feedback to close gaps in utilization, average pack size, and replacement rates across regions. Because demand is not uniform, we ensured views from APAC, EMEA, and the Americas were captured so assumptions match the buying and regulatory environment in each area.
Distribution of primary research fieldwork respondents
| Company type | Respondent position | Region |
|---|---|---|
| Top tier: 37% | CXOs: 16% | APAC: 48% |
| Mid tier: 46% | Functional/Unit leaders: 41% | EMEA: 31% |
| Smaller Players: 17% | Managers: 43% | Americas: 21% |
Market-Sizing & Forecasting
Sizing starts with a top-down build where regional e-bike demand is translated into battery pack demand using average pack capacity, chemistry mix, and typical replacement behavior for commuter and utility usage. Once that demand pool is built, revenue is derived by applying region-specific average selling prices that reflect chemistry shifts, pack integration level, and safety certification costs.
To keep the model realistic, we corroborate totals with selective bottom-up approximations, such as rolling up a sample of pack supplier revenues, checking pack shipment ranges discussed in filings and credible press, and using channel checks on replacement pack pricing. Key inputs that influence the model include average pack voltage and capacity trends (kWh per bike), lithium-ion versus lead-acid mix changes, e-bike unit sales growth by region, replacement rate timing, and the degree of integrated in-frame packs versus external packs, which affects pricing.
For forecasting, scenario analysis is used so the outlook reflects the range of adoption speeds across regions, followed by a smoothing step so year-to-year pricing and mix shifts do not jump unrealistically. Assumptions are adjusted only when primary feedback and observed public indicators move in the same direction, and any data gaps in supplier roll-ups are handled by using conservative share ranges and then reconciling back to the demand-led totals.
Data Validation & Update Cycle
Validation is done through repeated checks across independent angles so one noisy input does not drive the outcome. We compare the implied pack capacity demand against e-bike shipment direction, check whether price paths align with known cell cost movement and safety-driven cost adders, and then investigate any large variances by region or chemistry.
Before sign-off, another analyst reviews the key assumptions, the math flow, and the consistency of units. Any anomalies trigger a re-check of sources and, when needed, follow-up conversations with interviewees. Reports are refreshed annually, and interim updates are made when material events occur, such as policy incentives, safety regulation changes, or large capacity announcements. Right before delivery, a fresh review pass is completed so clients receive the most current and internally consistent view.
Mordor Intelligence's E Bike Battery Pack Market Estimate Compared With Other Published Estimates
Published market sizes for e-bike battery packs can vary a lot, even when similar years are used, because the scope boundary is not consistent and pricing logic differs by region. Differences also come from whether a source counts only battery packs sold for e-bikes versus including adjacent light electric vehicle batteries, and whether aftermarket replacement demand is treated as a full market line item.
By tracking pack-level kWh demand and refreshing ASPs through regional channel checks, Mordor Intelligence keeps the total anchored to e-bike-only battery packs and separates OEM-fitted demand from replacement demand using explicit replacement-rate assumptions.
Benchmark comparison
| Source | Market Size | Gaps in Research Methodology |
|---|---|---|
| Mordor Intelligence | USD 15.54 B (2026) | |
| Trade Publisher A | USD 19.77 B (2024) | Uses an earlier year and appears to apply a wider definition that can blend in batteries for non-e-bike light electric vehicles, which increases totals when product boundaries are not cleanly separated. |
| Industry Portal B | USD 6.65 B (2025) | Captures a narrower revenue pool and may apply conservative average pack prices or omit some OEM-fitted pack value, which keeps the market size lower even when unit growth is strong. |
The spread in values is mainly explained by scope cut, year alignment, and how pricing and replacement demand are treated in the math. With demand signals translated into pack kWh and then priced using transparent, repeatable steps, the market size stays traceable across regions and over time.


Key Questions Answered in the Report
What is the forecast value of the global e-bike battery market in 2031?
The e-bike battery market is projected to reach USD 28.86 billion by 2031, registering a 13.2% CAGR from 2026.
Which chemistry holds the largest share in e-bike batteries today?
Lithium-ion commands 68.62% of 2025 sales due to its superior energy density and mature supply chain.
Why are cargo e-bikes driving battery innovation?
Cargo and delivery bikes need packs that withstand more than 1,000 annual cycles and accept fast charging, pushing suppliers toward long-life chemistries such as LFP.
Which region is the fastest-growing market for e-bike batteries?
South America leads in growth with a 16.55% CAGR through 2031, supported by urban congestion policies and emerging incentive schemes.
Page last updated on:


 Your data is secure and never sold or shared.


