
Dynamic Application Security Testing Market Size and Share
Market Overview
| Study Period | 2020 - 2031 |
|---|---|
| Market Size (2026) | USD 4.18 Billion |
| Market Size (2031) | USD 8.63 Billion |
| Growth Rate (2026 - 2031) | 15.59 % |
| Fastest Growing Market | Asia Pacific |
| Largest Market | North America |
| Market Concentration | Medium |
Major Players *Disclaimer: Major Players sorted in no particular order Image © Mordor Intelligence. Reuse requires attribution under CC BY 4.0. | |
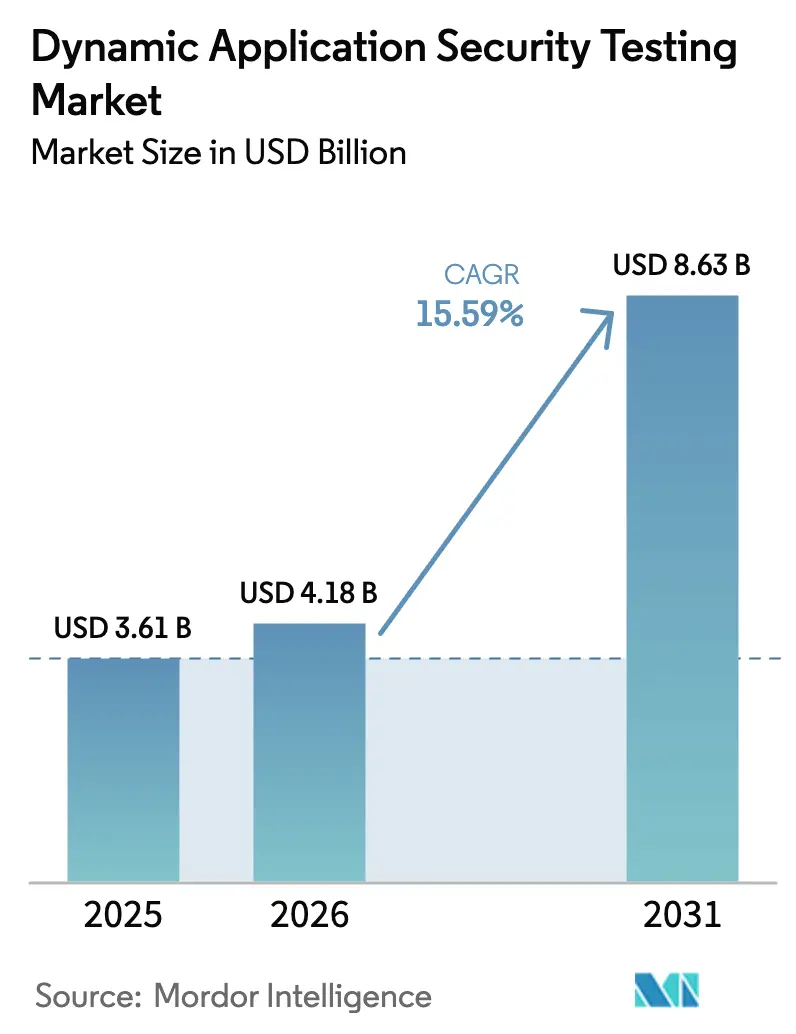
Dynamic Application Security Testing Market Analysis by Mordor Intelligence
The dynamic application security testing market size is projected to be USD 3.61 billion in 2025, USD 4.18 billion in 2026, and reach USD 8.63 billion by 2031, growing at a CAGR of 15.59% from 2026 to 2031. Escalating API-centric attack volumes, regulatory mandates that insist on runtime validation, and rapidly falling exploit-creation costs together accelerate demand for dynamic testing that can exercise live applications instead of reviewing static code. Vendors are embedding artificial-intelligence engines that generate boundary-condition test cases, while buyers increasingly favor platforms that integrate with continuous integration pipelines so that every build triggers a scan. Cloud-native delivery dominates because scanners must follow containerized workloads that redeploy dozens of times per day. Competitive pressure pivots on false-positive reduction, proven API coverage, and support for modern protocols such as GraphQL and gRPC, all of which influence procurement decisions for large enterprises and small businesses alike.
Key Report Takeaways
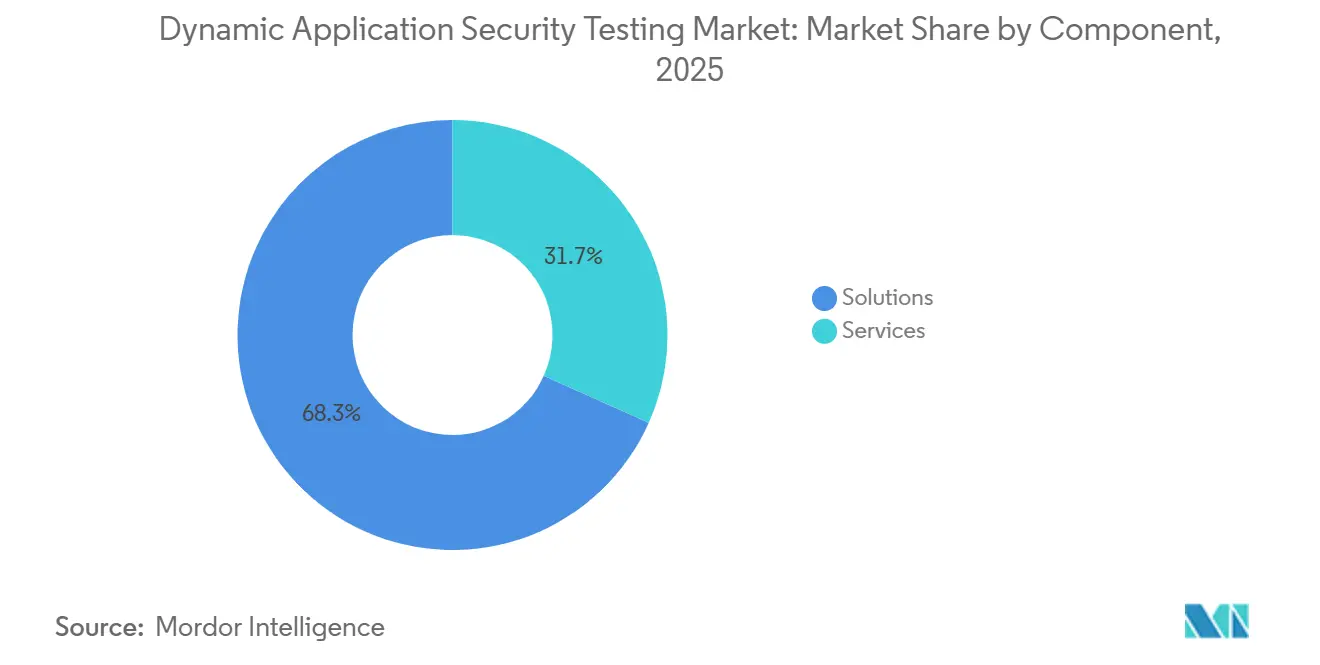
- By component, solutions held a 68.30% share of the dynamic application security testing market in 2025, whereas services are advancing at a 15.62% CAGR through 2031.
- By deployment mode, cloud-based platforms accounted for 73.50% of the dynamic application security testing market size in 2025 and are projected to expand at a 15.76% CAGR through 2031.
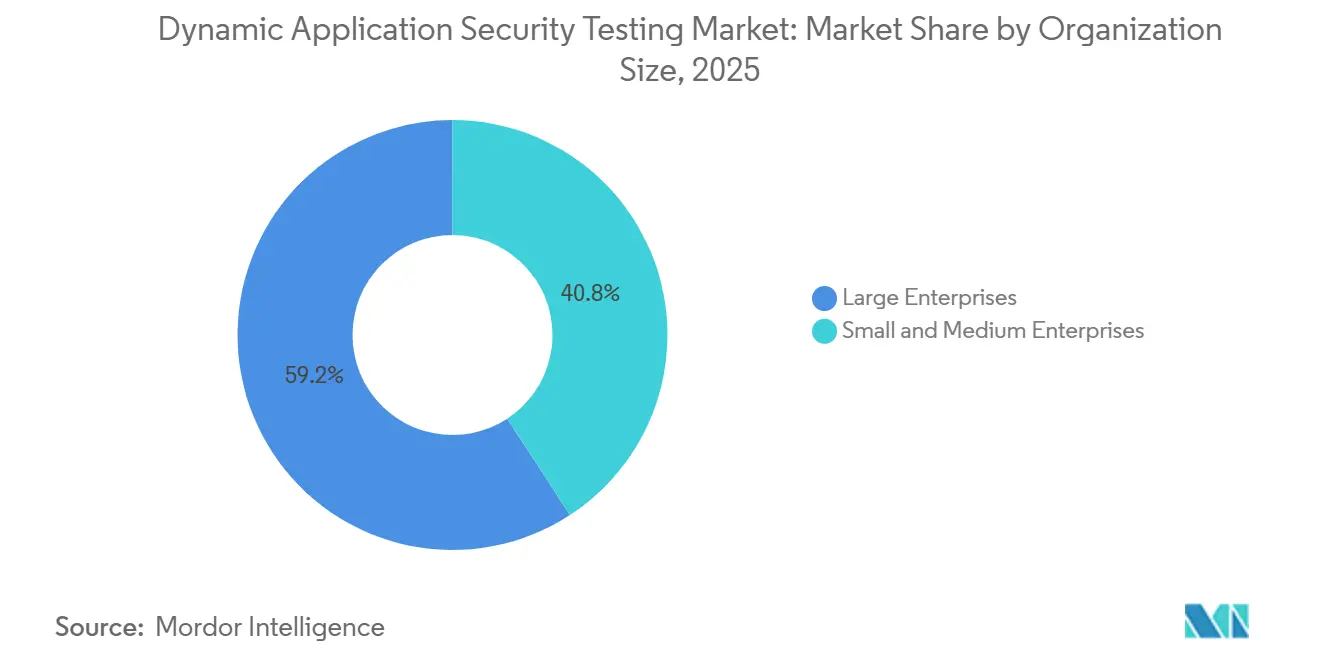
- By organization size, large enterprises captured 59.20% of the dynamic application security testing market share in 2025, while small and medium enterprises are growing at a 16.99% CAGR.
- By end-user vertical, BFSI commanded 24.20% of 2025 revenue, yet retail and e-commerce is the fastest riser at an 18.65% CAGR to 2031.
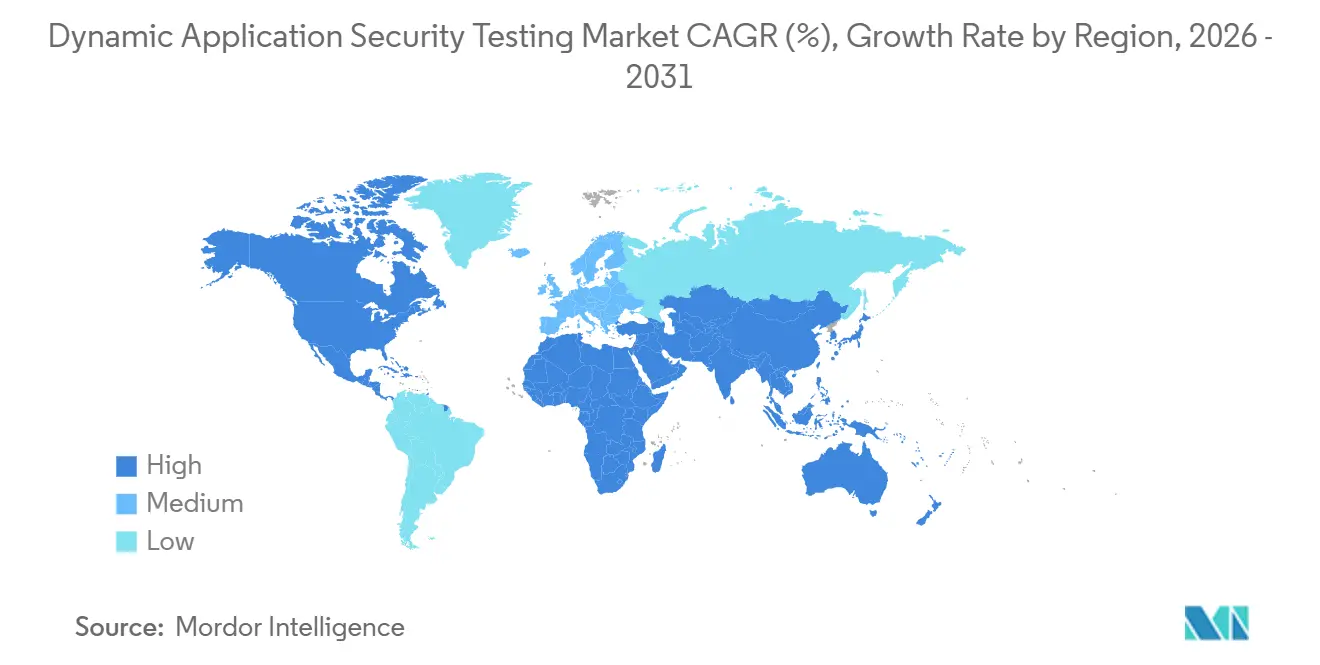
- By geography, North America led with 42.80% share in 2025, whereas Asia-Pacific is forecast to grow at a 17.10% CAGR, the highest regional pace.
Note: Market size and forecast figures in this report are generated using Mordor Intelligence’s proprietary estimation framework, updated with the latest available data and insights as of January 2026.
Market Trends and Insights
Drivers Impact Analysis of Dynamic Application Security Testing Market*
| Driver | (~) % Impact on CAGR Forecast | Geographic Relevance | Impact Timeline |
|---|---|---|---|
| Rising Volume of API-Centric Attacks | +3.5% | Global, acute in North America and Europe | Short term (≤ 2 years) |
| Shift-Left DevSecOps Adoption | +3.0% | Global, led by North America and Europe | Medium term (2-4 years) |
| Mandatory SBOM and Supply-Chain Rules | +2.5% | North America and Europe, spillover to Asia-Pacific | Medium term (2-4 years) |
| AI-Enabled Exploit Automation | +2.2% | Global, R and D hubs in North America and Asia-Pacific | Long term (≥ 4 years) |
| Low-Code/No-Code Proliferation | +1.8% | Global, strong in mature citizen-developer markets | Medium term (2-4 years) |
| Pay-Per-Scan Pricing Disrupting TCO | +1.5% | Global, strongest in Asia-Pacific and South America | Short term (≤ 2 years) |
| Source: Mordor Intelligence | |||
Rising Volume of API-Centric Attacks
API endpoints generated 48% of all web-application attacks in 2024, equal to 150 billion events that Akamai traced across its global network.[1] Wallarm cataloged 1,602 unique API vulnerabilities in Q3 2025, a 20% sequential rise, dominated by broken object-level authorization and excessive data exposure flaws. The shift to microservices means a modern commerce application now surfaces 200-500 APIs, magnifying the runtime surface that only the dynamic application security testing market can probe effectively. Traceable AI reported that 57% of organizations suffered an API breach in the prior year, yet just 34% deployed API-specific defenses.[2] Regulatory pressure compounds the urgency, as PSD2 and open-banking rules enforce third-party access that must be validated for authorization integrity.
Shift-Left DevSecOps Adoption
GitLab’s 2024 survey showed 58% of developers already run dynamic tests during development pipelines, up from 41% two years earlier. Despite this progress, only one-third include dedicated API scans, largely because authentication credentials and ephemeral test environments complicate automation. Datadog found that 15% of live services still contained vulnerabilities cataloged in CISA’s Known Exploited list, reinforcing the need for earlier discovery. Incremental scanners that test changed endpoints in five-minute cycles now align with sub-10-minute build targets, encouraging broader adoption.
Mandatory SBOM and Supply-Chain Disclosure Rules
CISA expanded SBOM minimum elements in August 2025 to include provenance, license, and vulnerability status, but also stated that disclosed components must undergo runtime validation.[3] The EU Cyber Resilience Act imposes EUR 15 million or 2.5% turnover penalties for non-conformance, pushing manufacturers to prove exploitability rather than merely list components. Medical devices face similar proof requirements under FDA guidance issued in 2024. Each mandate elevates the dynamic application security testing market because runtime probing confirms whether a vulnerable library is reachable in production.
AI-Enabled Exploit Automation
Research on LLM agents showcased their ability to autonomously exploit up to 51% of tested CVEs, achieving this feat at costs under USD 4 and significantly reducing manual effort by two orders of magnitude. This advancement highlights the growing efficiency of automated systems in cybersecurity. In 2024, Datadog noted a substantial reduction in the median time-to-exploit, which dropped to just seven days. This shift is primarily attributed to the adoption of automated payload generation, which has streamlined the exploitation process. Vendors are now actively integrating generative models capable of creating test cases directly from API schemas, enhancing their ability to identify vulnerabilities. At the same time, attackers are leveraging similar agents to exploit weaknesses, igniting an arms race in cybersecurity. This ongoing competition is driving a continuous and heightened demand for more intelligent and advanced dynamic scanning solutions to stay ahead of emerging threats.
Restraints Impact Analysis of Dynamic Application Security Testing Market*
| Restraint | (~) % Impact on CAGR Forecast | Geographic Relevance | Impact Timeline |
|---|---|---|---|
| Signal-to-Noise (False-Positive) Fatigue | -2.0% | Global, especially North America and Europe | Short term (≤ 2 years) |
| Scarcity of AppSec Skill-Sets | -1.8% | Global, most severe in North America, Europe, and Asia-Pacific | Long term (≥ 4 years) |
| Limited Runtime and Business-Logic Coverage | -1.2% | Global, high in complex microservices deployments | Medium term (2-4 years) |
| Fragmented Standards across Jurisdictions | -0.9% | Multinationals operating in multiple regulatory regions | Medium term (2-4 years) |
| Source: Mordor Intelligence | |||
Signal-to-Noise (False-Positive) Fatigue
Security teams face a significant challenge in managing the overwhelming volume of alerts generated by their systems, with 70-90% of these alerts being false positives. This high rate of irrelevant alerts forces teams to spend considerable time and resources triaging thousands of notifications just to identify the critical 10-30% that genuinely require attention. Over time, developers tend to disregard alerts due to the persistent noise, which ultimately compromises the achievement of essential security objectives. To address this issue, instrumented proof-based scanning solutions offered by vendors like Invicti have proven effective in reducing irrelevant findings by up to 60%. This improvement not only enhances efficiency but also allows security teams to focus on actionable insights. As a result, buyers are increasingly emphasizing precision as a critical requirement, often listing it as a mandatory feature in their requests for proposals.
Scarcity of AppSec Skill-Sets
In 2024, ISC2 identified a significant global cybersecurity talent shortfall of 4.8 million professionals, with a particularly pronounced scarcity in dynamic testing expertise. This gap underscores the growing demand for specialized skills in the cybersecurity market. The average time required to fill these critical roles now exceeds six months, creating substantial challenges for organizations seeking to secure their systems. Additionally, salary premiums for these roles have surged to 40%, making it increasingly difficult for many small enterprises to attract and retain such talent. However, advancements in technology have provided alternative solutions. Firms can now leverage managed services and security-as-code APIs, which simplify the process of conducting advanced testing. These tools enable organizations to access critical testing outcomes without the need to hire and onboard these rare and highly sought-after specialists, thereby addressing some of the challenges posed by the talent gap.
*Our forecasts treat driver/restraint impacts as directional, not additive. The impact forecasts reflect baseline growth, mix effects, and variable interactions.
Dynamic Application Security Testing Market Segment Analysis
By Component:
Services Scale Faster Than SoftwareSolutions generated 68.30% of 2025 revenue, showing that enterprises still license full-featured platforms to cover broad asset inventories. Yet the services slice is growing at 15.62% CAGR, faster than the overall dynamic application security testing market. Providers integrate scanners with CI/CD systems, tune authentication flows, and interpret findings for business units. Global consultancies, including Accenture, expanded application-security headcount through 2025 to meet this demand.
Services also appeal to organizations that struggle with false positives; a managed team validates exploitability before escalating, trimming alert queues. As a result, the dynamic application security testing market size attached to services is projected to expand steadily through 2031. Vendors respond by bundling onboarding, custom policy creation, and regular health checks inside subscription tiers, aligning economic incentives with customer outcomes.
By Deployment Mode:
Cloud-Based Delivery DominatesIn 2025, spending on cloud-hosted scanners accounted for 73.50%, and they continue to outpace on-premise solutions, growing at a rate of 15.76% CAGR. Cloud engines possess the capability to discover and test containerized microservices and serverless functions, which are redeployed dozens of times daily, in near real-time. This ability to handle frequent redeployments efficiently is a key factor driving the adoption of cloud-hosted solutions. The extension of Amazon Inspector to Lambda and container workloads further highlights the growing preference of buyers for fully managed offerings, as these solutions reduce operational overhead and enhance scalability.
In industries with stringent regulations, on-premise deployment remains a critical requirement due to data sovereignty policies that limit external processing. These policies ensure sensitive data remains within controlled environments, making on-premise solutions indispensable for compliance. As a result, hybrid architectures are emerging as a practical solution: the scan engine operates in the vendor's cloud, but credentials and other sensitive data are securely stored on the customer's hardware. This setup ensures compliance requirements are met without compromising the breadth of security coverage. Such a mixed model underscores the adaptability and flexibility required in the dynamic application security testing market, enabling it to cater to both cloud-centric developers seeking innovation and risk-averse incumbents prioritizing regulatory compliance and data security.
By Organization Size:
SMEs Narrow the Adoption GapIn 2025, large enterprises commanded a dominant 59.20% share of the revenue, driven by their expansive application portfolios and stringent audit mandates. These organizations manage extensive application estates, which require robust security measures to comply with regulatory standards and ensure operational efficiency. In contrast, SMEs are rapidly gaining ground, boasting a robust 16.99% CAGR, thanks to the shift from hefty upfront licenses to usage-based pricing models. This pricing approach significantly reduces the financial burden on smaller organizations, enabling them to adopt advanced security solutions. A case in point is StackHawk, which offers a free tier for open-source projects and charges per-scan for commercial workloads, catering to budget-conscious teams and fostering wider adoption among SMEs.
While SMEs grapple with expertise limitations, managed dynamic scanning services have emerged as a practical and cost-effective solution. These services address the skill gaps in smaller organizations by providing specialized expertise and continuous monitoring. Indian outsourcing firms, leveraging regional security operation centers, provide continuous testing services at competitive rates, bolstering their foothold in emerging markets. These firms enable SMEs to access high-quality security testing without the need for significant in-house resources. As a result, SMEs' share in the dynamic application security testing market is poised for a steady ascent in the coming years, driven by increasing adoption of managed services and the growing need for robust security measures in a rapidly evolving digital landscape.
By End-User Vertical:
Retail and E-Commerce Accelerate Post-BreachThanks to its open-banking exposure and hefty regulatory fines, the BFSI sector held a commanding 24.20% share of the 2025 market value. This dominance highlights the sector's critical role in driving the adoption of advanced security measures. Yet, in the wake of the Ticketmaster and Santander breaches, which compromised 560 million records, retail and e-commerce expenditures have been on a robust ascent, boasting an 18.65% CAGR. These incidents have underscored the vulnerabilities in data security, prompting businesses to prioritize investments in protective measures. With PCI DSS 4.0 now mandating continuous runtime validation for systems handling cardholder data, the necessity for dynamic testing has never been clearer. This regulatory shift emphasizes the importance of proactive security strategies to mitigate risks and ensure compliance.
Guided by FDA device-security directives, the healthcare sector is ramping up its security measures to address emerging threats. The sector's increasing reliance on connected devices has made robust security protocols indispensable. Simultaneously, the energy, utilities, and manufacturing sectors are turning to dynamic testing to fortify their industrial IoT interfaces. These industries face unique challenges due to the critical nature of their operations, making the adoption of advanced security solutions a priority. The pattern is consistent across all sectors: the combination of live, externally-facing APIs and the potential for financial and reputational harm fuels ongoing investments in the dynamic application security testing market. This sustained investment reflects the growing awareness of the need for comprehensive security frameworks to protect sensitive data and maintain operational integrity.
Geography Analysis
North America Dynamic Application Security Testing Market
North America led with 42.80% of 2025 revenue because Executive Order 14028 forces federal contractors to demonstrate runtime vulnerability validation. Adoption depth is highest, but teams also experience the greatest alert fatigue, spurring premium demand for proof-based scanning and AI triage. Canada’s Critical Cyber Systems Protection Act, enacted in 2024, widened mandatory testing to provincially regulated utilities, adding incremental demand.
Europe Dynamic Application Security Testing Market
Europe contributed roughly 29% of spending in 2025, propelled by the progressive rollout of NIS2, DORA, and the Cyber Resilience Act. German and French financial institutions extend scans to every third-party API, aligning with 24-hour incident-report deadlines. Post-Brexit divergence obliges United Kingdom firms that serve EU clients to follow both regulation sets, inflating test volume and complexity.
APAC Dynamic Application Security Testing Market
Asia-Pacific is the fastest growing region at a 17.10% CAGR. China’s Multi-Level Protection Scheme 2.0 now mandates dynamic assessments for Level 3 systems or higher, covering most enterprise applications. India’s Digital Personal Data Protection Act enforces fines up to INR 2.5 billion (USD 30 million) for breaches, encouraging exporters to certify security posture to global customers. Japan, South Korea, Australia, and New Zealand together make sizeable contributions where breach-notification laws tighten annually.
Regulatory Landscape
In the United States, Executive Order 14028 (May 2021) anchors federal software supply chain requirements and pushes agencies and vendors toward documented secure development and test practices that demonstrate exploitable risk in running applications. NIST guidance, including the Secure Software Development Framework (SSDF, SP 800-218) and supply chain security integration in DevSecOps pipelines (SP 800-204D), reinforces routine vulnerability identification and response as part of CI/CD workflows, supporting automated dynamic testing alongside other AppSec controls.
In Europe, the Cyber Resilience Act (Regulation (EU) 2024/2847) entered into force on 10 December 2024 and formalizes security by design obligations across the product lifecycle, with a stronger emphasis on continuous verification rather than point-in-time assessment. The Act also introduces reporting duties for actively exploited vulnerabilities and severe incidents starting 11 September 2026, adding urgency for manufacturers and software producers to operationalize runtime validation and evidence capture through tooling such as DAST within broader secure development and vulnerability handling programs.
Competitive Landscape
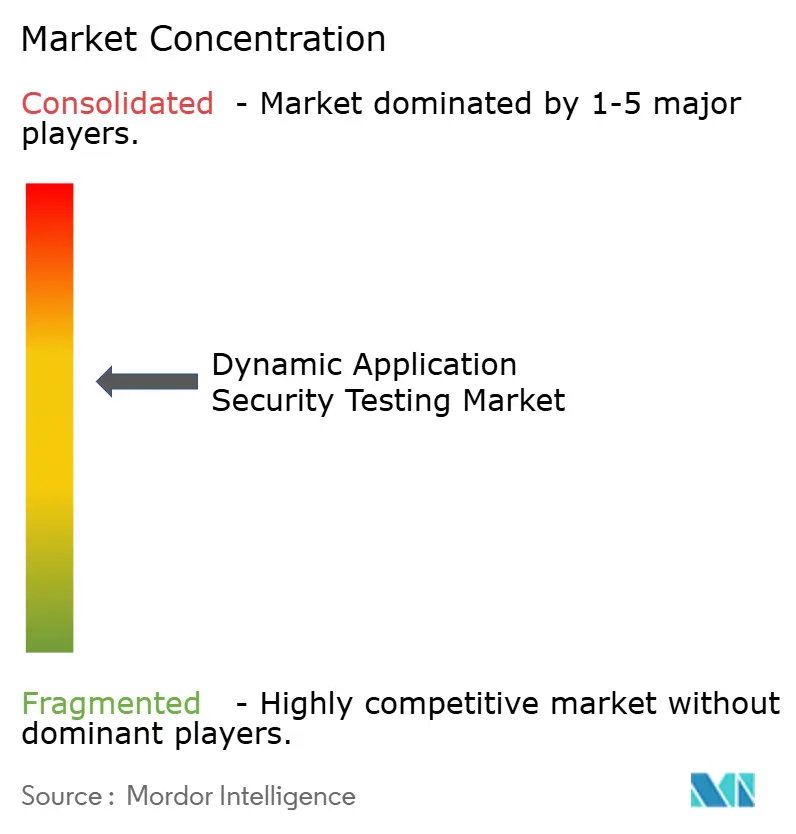
The dynamic application security testing market remains moderately fragmented; the top ten suppliers control about 45-50% of revenue. Incumbents such as Invicti Security, PortSwigger, and Qualys compete on breadth, layering API, compliance, and proof-based engines into unified dashboards. New entrants, including Bright Security and Probely, focus on developer experience by integrating directly with GitLab or GitHub workflows.
AI-assisted triage and test-case generation dominate patent filings, underscoring vendor recognition that false-positive fatigue jeopardizes renewals more than raw detection rates. Invicti’s acquisition of API Fortress in January 2026 signals consolidation aimed at protocol depth, while PortSwigger’s automated multi-factor authentication handling released in December 2025 exemplifies niche capability leap-frogging.
White-space persists in business-logic flaw detection and in reliably scanning protocols such as GraphQL, gRPC, and WebSocket. Providers that blend generative AI with behavioral instrumentation to close these gaps are positioned to capture future share as the dynamic application security testing market matures.
Dynamic Application Security Testing Industry Leaders
-
IBM Corporation
-
Synopsys Inc.
-
Veracode Inc.
-
Checkmarx Ltd.
-
OpenText Corporation (Fortify)
- *Disclaimer: Major Players sorted in no particular order
Dynamic Application Security Testing Market Companies Covered in this Report
- IBM Corporation
- Synopsys Inc.
- Veracode Inc.
- Checkmarx Ltd.
- OpenText Corporation (Fortify)
- Rapid7 Inc.
- Qualys Inc.
- Invicti Security Ltd.
- Contrast Security Inc.
- HCLTech Ltd. (AppScan)
- GitLab Inc.
- Snyk Ltd.
- Tenable Holdings Inc.
- PortSwigger Ltd. (Burp Suite)
- Indusface Pvt Ltd.
- NowSecure Inc.
- Appknox Pte Ltd.
- CyCognito Inc.
- WhiteHat Security Inc. (NTT)
- Cobalt Labs Inc.
Read Analysis of Dynamic Application Security Testing Companies
Market Opportunities and Future Outlook
Vendor consolidation and platform convergence are creating whitespace for unified workflows that connect runtime findings to developer facing remediation, which directly addresses false-positive fatigue and fragmented toolchains. Buyers are standardizing on broader application security platforms that embed DAST alongside posture management and policy orchestration, as reflected in Invicti expanding beyond scanning through its Kondukto acquisition (August 2025) and continuing to emphasize proof-based validation across portfolio integrations. This shift improves the case for providers that can connect DAST outputs to consistent governance artifacts for audit readiness across SBOM, secure development frameworks, and vulnerability reporting processes.
API-centric runtime testing is also a clear opportunity as modern applications expose large endpoint inventories and widen protocol diversity (GraphQL, gRPC, WebSocket), which raises demand for deeper authenticated coverage in CI/CD and ephemeral environments. Radware acquiring Pynt (January 2026) to strengthen full lifecycle API security and Snyk launching Snyk API and Web (April 2025) to productize DAST within its platform signal continued investment in API focused scanning and integrated developer experience. At the same time, enterprise roadmaps are incorporating AI oriented application behaviors and agentic workflows, increasing the value of DAST offerings that can validate runtime misuse paths, test case generation, and policy controls in production-like conditions without adding operational overhead.
Recent Industry Developments in Dynamic Application Security Testing Market
- July 2026: OpenText announced Fortify Agentic Analyzer as a multi-agent, multi-phase analysis capability across the Fortify portfolio, available for Fortify on Demand, on-premises, and private cloud deployments. The release expands AI-assisted analysis within AppSec suites and supports enterprise rollouts by aligning with existing Fortify licensing and deployment preferences.
- June 2026: Veracode rolled out DAST platform enhancements, including directory restriction controls and improved scheduling, plus ISM endpoint updates. The updates strengthen governance for large-scale scanning programs and tighten control of scan scope in CI/CD and enterprise environments.
- December 2025: PortSwigger released Burp Suite Enterprise 2025.4 with automated multi-factor authentication workflow handling. This capability reduces friction for authenticated scanning at scale and advances coverage for apps protected by modern identity controls.
Dynamic Application Security Testing Market Report Scope and Research Methodology
Market Definition and Coverage
This market covers revenue earned from dynamic application security testing (DAST) tools and related services that test running applications from the outside, across web apps, mobile apps, and exposed APIs. It includes commercial solutions plus implementation, support, and managed testing services across major industry users and regions.
Scope exclusions: We exclude pure static code testing, software composition analysis, general penetration testing that is not delivered as a DAST product or service, and endpoint or network security tools.
Segments Covered in This Report
- By Component
- Solutions
- Services
- By Deployment Mode
- Cloud-Based
- On-Premise
- By Organisation Size
- Large Enterprises
- Small and Medium Enterprises
- By End-User Vertical
- BFSI
- Healthcare
- IT and Telecom
- Industrial and Defence
- Retail and E-Commerce
- Energy and Utilities
- Manufacturing
- Other End-User Vertical
- By Geography
- North America
- United States
- Canada
- Mexico
- South America
- Brazil
- Argentina
- Rest of South America
- Europe
- Germany
- United Kingdom
- France
- Italy
- Spain
- Rest of Europe
- Asia Pacific
- China
- Japan
- South Korea
- India
- Australia
- New Zealand
- Rest of Asia-Pacific
- Middle East and Africa
- Middle East
- United Arab Emirates
- Saudi Arabia
- Turkey
- Rest of Middle East
- Africa
- South Africa
- Nigeria
- Kenya
- Rest of Africa
- Middle East
- North America
Data Sources, Market Sizing, and Validation
Desk Research
Desk research was used to set the market boundaries, build the first demand map, and identify the main adoption signals that influence DAST spend. We referenced public sources such as NIST guidance, CISA advisories, MITRE CWE lists, OWASP Top 10 and API Security Top 10, and breach statistics published by agencies and major regulators to understand how runtime testing is being prioritized.
To translate that context into sizing inputs, we also used company annual reports, security product brochures, and investor presentations to frame product scope and typical packaging (tool licenses, subscriptions, and service bundles). Analysts also used paid subscriptions for company financials and news, plus patent databases to track where scanning and automation features are trending. The sources listed here are illustrative, and additional public and private references were used for data collection, validation, and clarification.
Primary Interviews and Surveys
Primary work centered on interviews and structured surveys with application security leaders, DevSecOps owners, security testing managers, and service providers who run scans for clients. We used these conversations to confirm what buyers actually count as DAST, how usage shifts with CI pipelines, and what pricing is paid when testing expands from web apps into API surfaces.
Distribution of primary research fieldwork respondents
| Company type | Respondent position | Region |
|---|---|---|
| Top tier: 39% | CXOs: 14% | APAC: 46% |
| Mid tier: 46% | Functional/Unit leaders: 33% | EMEA: 32% |
| Smaller Players: 15% | Managers: 53% | Americas: 22% |
Market-Sizing & Forecasting
Sizing started with a top-down build where application security and security testing spend pools were reconstructed by region, then filtered using DAST adoption and budget-share splits validated by interviews. To make the totals practical, we corroborated results with selective bottom-up checks using sampled price points and typical seat, application, or scan-volume based packaging, followed by channel checks on how often services are bundled with tools.
Key inputs in the model included, as examples, growth in API exposure and related vulnerability patterns, the shift to cloud-based deployment for testing tools, CI or DevSecOps pipeline rollout intensity, regulated-industry compliance pressure, and the mix of enterprise size because buyer maturity affects the service-to-software split. Where vendor revenue disclosure is incomplete, gaps were handled using peer-based ranges and cross-checking against deployment footprints and customer counts discussed in primary calls. Forecasts were prepared using scenario analysis tied to a small set of driver variables, then adjusted using expert consensus on pricing progression and service attach rates.
Data Validation & Update Cycle
Validation was done through repeated cross-checks between model outputs and independent signals, such as reported security testing budgets, public vulnerability trends, and regional cloud adoption indicators. When a data point created an unusual jump in a country, vertical, or deployment split, we revisited the assumption and re-contacted respondents to confirm whether the shift was real or timing-related.
Before sign-off, a second analyst reviews calculations, unit logic, and currency conversions, and then the full dataset is checked for variance against adjacent markets in application security. Reports are refreshed annually, and interim updates are made when major events materially change demand drivers. Right before delivery, a final review pass is completed so clients receive the latest updated view.
Mordor Intelligence's Dynamic Application Security Testing Market Size Versus Other Published Estimates
Published market sizes for DAST often vary because the product boundary is not interpreted the same way, and the pricing unit can differ across buyers. Some studies lean more on vendor messaging, while others start from IT security spend pools, which then pushes totals apart.
Pure penetration testing projects and general red-team services are a common add-in, and those can inflate the DAST number even when the work is not tied to a DAST platform subscription. Those add-ons sit outside Mordor Intelligence's scope, which keeps the model tied to DAST tools and the related services that directly support runtime scanning of applications and APIs, and the estimate is then checked against deployment patterns, service attach rates, and region-level adoption signals.
Benchmark comparison
| Source | Market Size | Gaps in Research Methodology |
|---|---|---|
| Mordor Intelligence | USD 4.18 B (2026) | |
| Trade Journal A | USD 2.56 B (2023) | Uses an earlier base year and a shorter forecast window, and the scope description is high level, so cloud versus on-prem mix and services attach assumptions may not be fully normalized across regions. |
| Regional Consultancy B | USD 1.80 B (2024) | Starts from a narrower spend pool and may treat enterprise usage in large regulated verticals as partial adoption, which can undercount bundled services and higher utilization in mature DevSecOps programs. |
The spread across published values is mainly explained by what gets counted as DAST versus adjacent security services, plus differences in base year timing and how pricing is scaled as scanning expands to APIs. By keeping the inputs tied to adoption, packaging, and attach-rate checks that can be repeated each year, the resulting market size stays easier to trace back to clear demand drivers.
Key Questions Answered in the Report
How fast is spending on dynamic application security testing expected to grow through 2031?
Industry revenue is projected to climb at a 15.59% CAGR between 2026 and 2031, rising from USD 4.18 billion in 2026 to USD 8.63 billion by 2031.
Which deployment approach attracts the most investment today?
Cloud-based scanners already account for 73.50% of 2025 spending because they can track containerized and serverless endpoints that redeploy frequently.
Why are retailers ramping up dynamic testing budgets?
Breaches that exposed 560 million records in 2024 highlighted API authentication gaps, prompting retail and e-commerce firms to boost outlays at an 18.65% CAGR.
What creates the biggest hurdle to wider adoption inside small companies?
A shortage of application-security expertise and historically high license costs slow uptake, though usage-based pricing and managed-service options are closing the gap.