
Dublin Data Center Market Size and Share
Market Overview
| Study Period | 2020 - 2031 |
|---|---|
| Forecast Data Period | 2026 - 2031 |
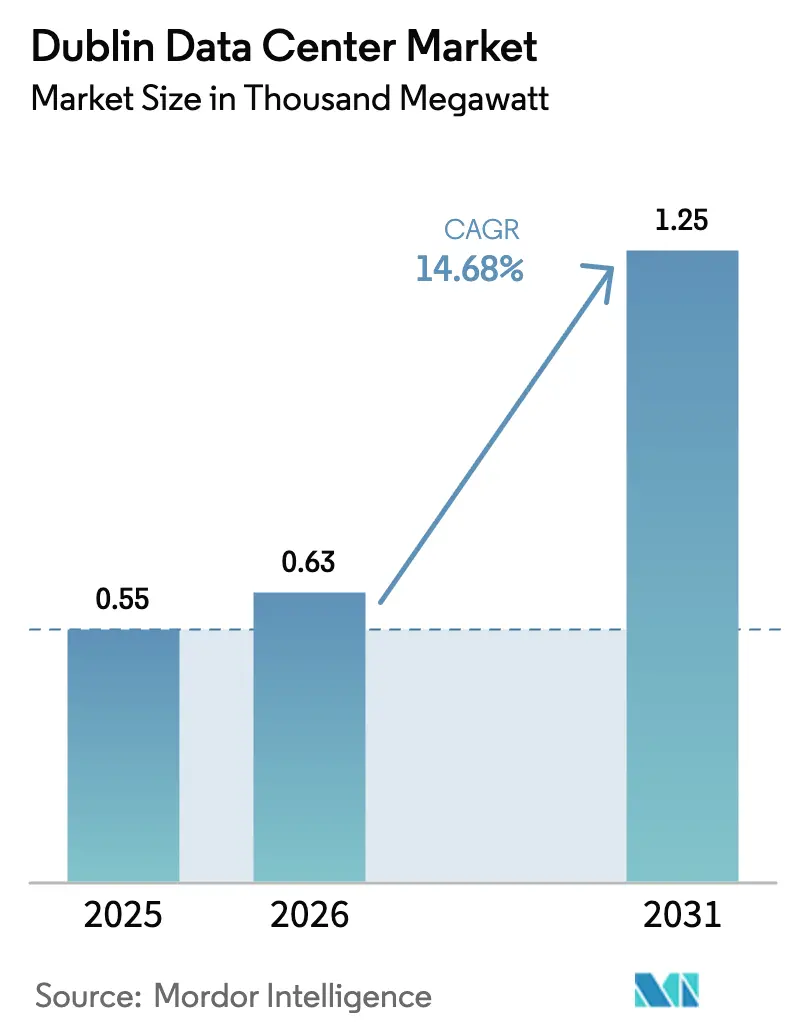
| Base Year Market Size (2025) | 0.55 Thousand megawatt |
| Market Volume (2026) | 0.63 Thousand megawatt |
| Market Volume (2031) | 1.25 Thousand megawatt |
| Growth Rate (2026 - 2031) | 14.68% CAGR |
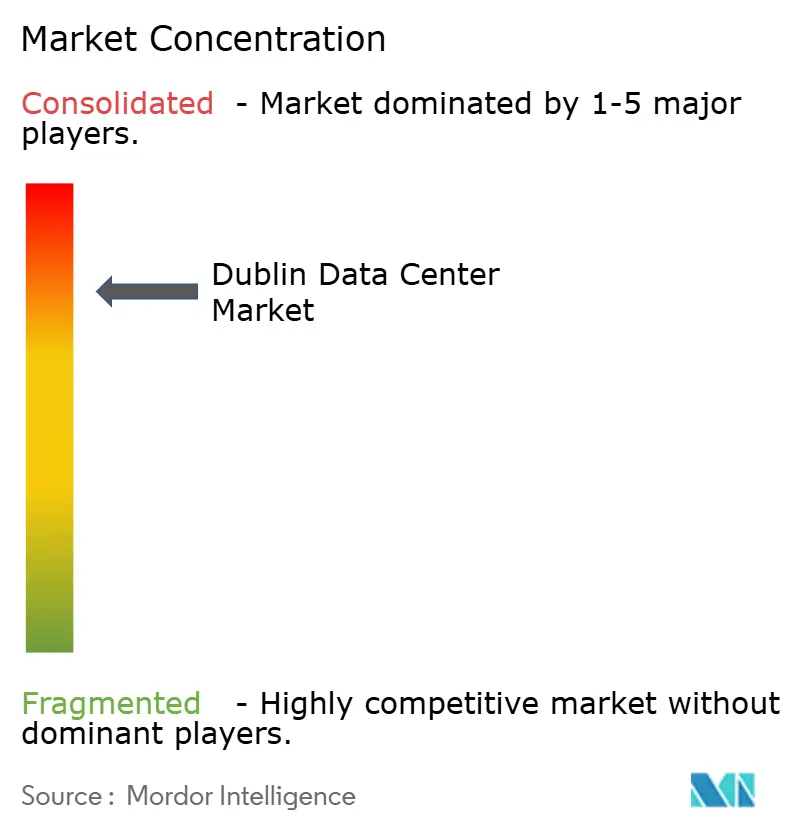
| Market Concentration | High |
Major Players *Disclaimer: Major Players sorted in no particular order Image © Mordor Intelligence. Reuse requires attribution under CC BY 4.0. | |
Dublin Data Center Market Analysis by Mordor Intelligence
Dublin data center market size in 2026 is estimated at 0.63 thousand MW, growing from 2025 value of 0.55 thousand MW with 2031 projections showing 1.25 thousand MW, growing at 14.68% CAGR over 2026-2031. Consistent tax incentives, dense submarine-cable landings, and Ireland’s naturally cool climate underpin sustained demand from hyperscale cloud platforms, artificial-intelligence (AI) clusters, and latency-sensitive enterprises. Recent grid-connection limits have tilted market power toward incumbents that already hold capacity rights, spurring investment in on-site generation, liquid-cooling retrofits, and waste-heat recovery systems that improve power usage effectiveness (PUE). Meanwhile, data-sovereignty mandates such as the EU Data Boundary initiative channel continental workloads into Irish facilities, driving premium pricing for compliance-ready space. Intensifying competition among AWS, Microsoft, Google, and Meta is prompting record capital-raising by wholesale colocation operators and provoking a wave of mergers and asset swaps as newcomers race to secure land, talent, and remaining grid allotments.
Key Report Takeaways
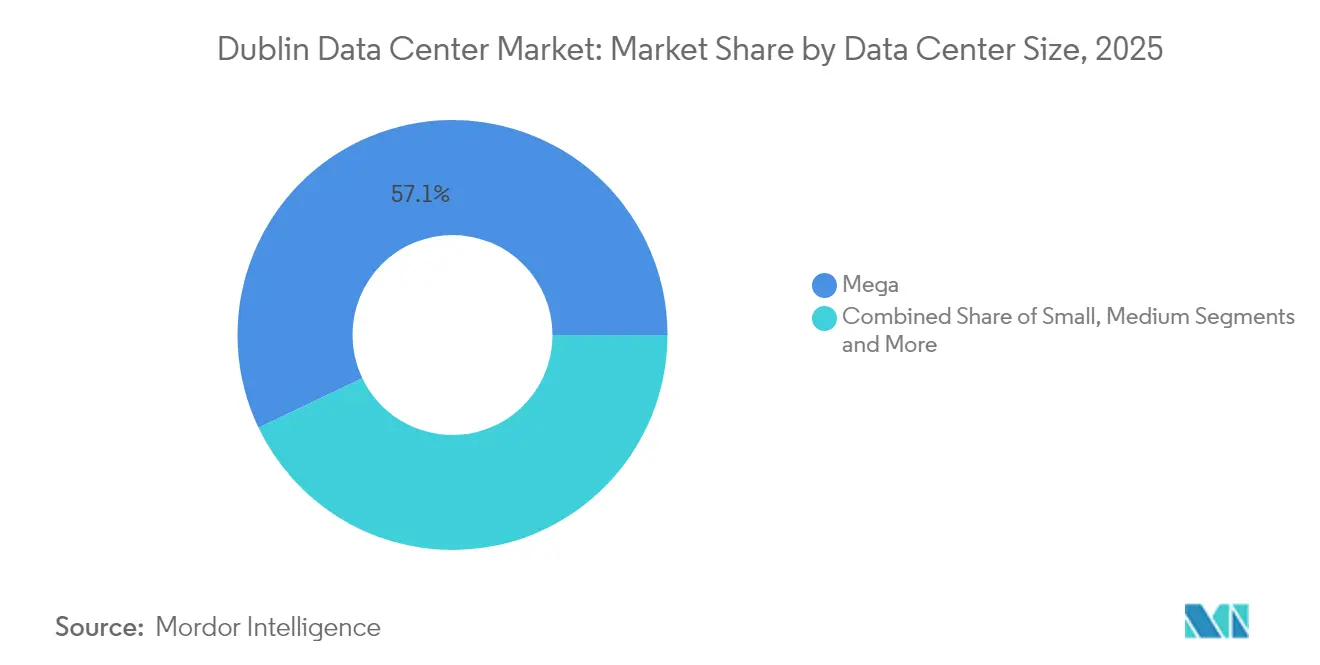
- By data-center size, mega facilities led with 57.10% of Dublin data center market share in 2025; massive campuses are forecast to expand at a 16.55% CAGR through 2031.
- By tier classification, Tier 3 sites accounted for 64.10% of the Dublin data center market size in 2025, while Tier 4 is projected to advance at a 15.90% CAGR through 2031.
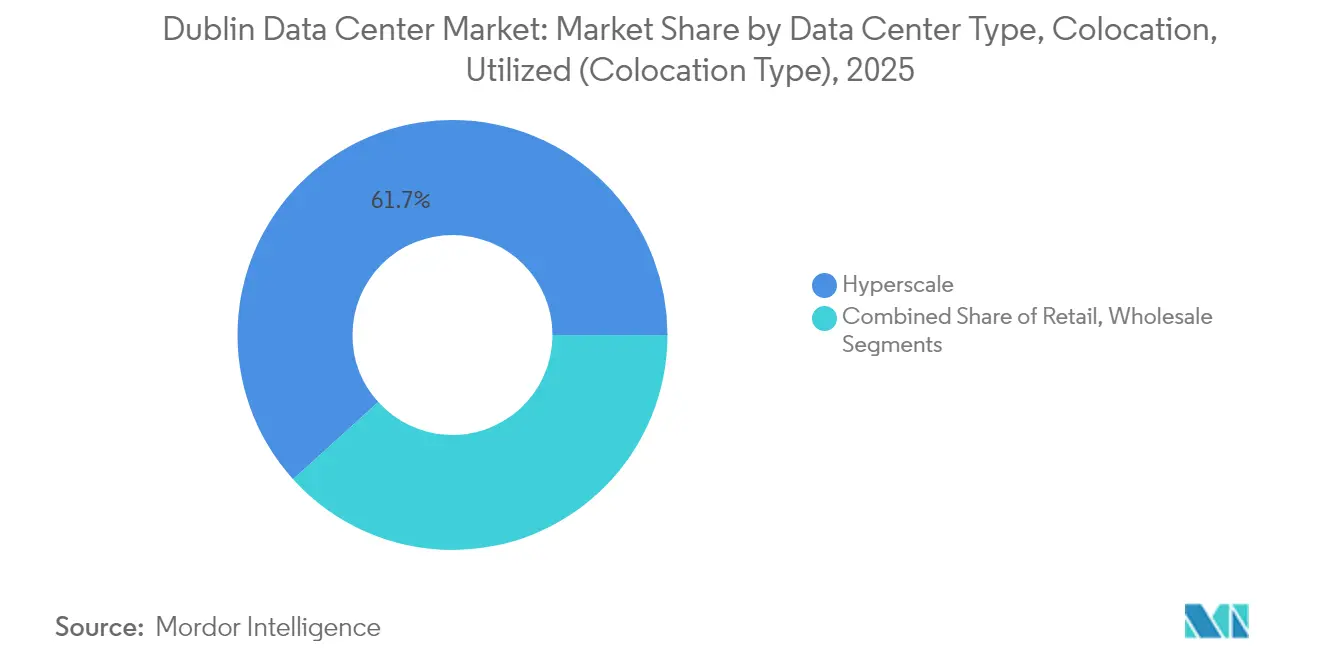
- By colocation model, the hyperscale segment captured 61.70% of the Dublin data center market size in 2025 and is growing at 15.20% through 2031.
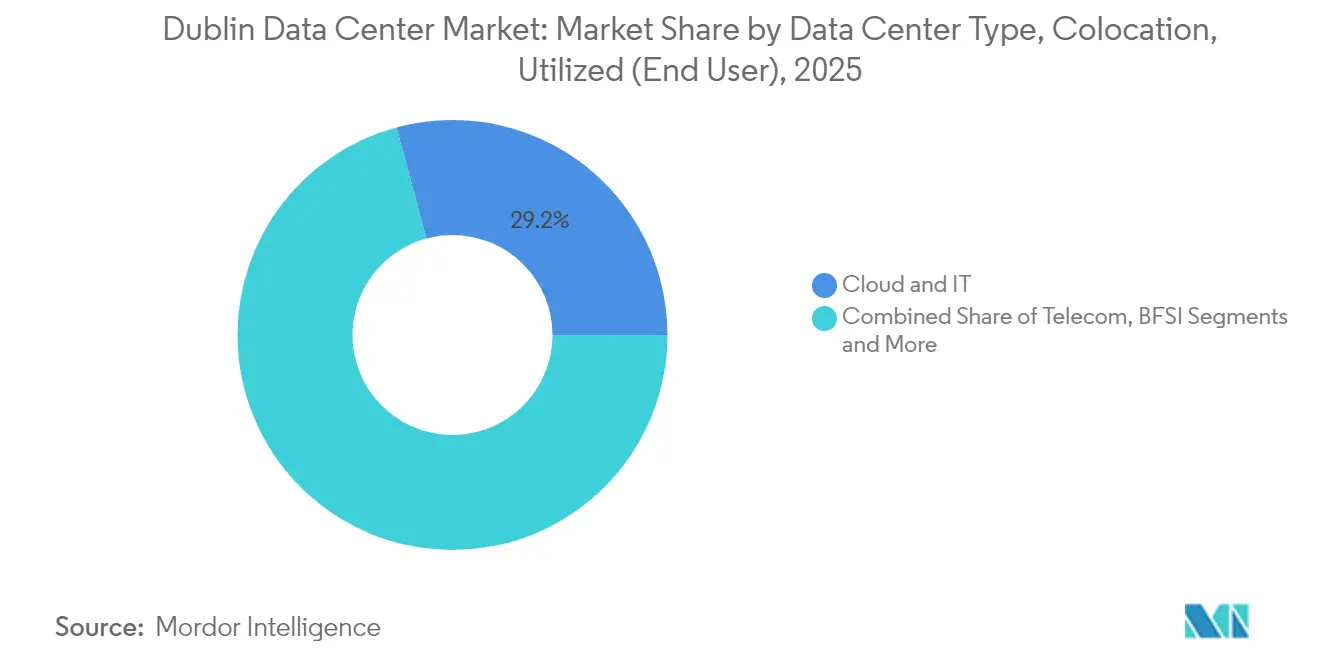
- By end user, cloud and IT services represented 29.20% of demand in 2025 and are tracking a 16.90% CAGR to 2031.
Note: Market size and forecast figures in this report are generated using Mordor Intelligence’s proprietary estimation framework, updated with the latest available data and insights as of 2026.
Dublin Data Center Market Trends and Insights
Drivers Impact Analysis*
| Driver | (~) % Impact on CAGR Forecast | Geographic Relevance | Impact Timeline |
|---|---|---|---|
| Hyperscale cloud expansion by US tech majors | +4.2% | Dublin metro; spillover to Cork and Galway | Medium term (2-4 years) |
| Strategic FLAPD network-latency advantage | +2.8% | Global; benefits N. America–Europe routes | Long term (≥ 4 years) |
| Favourable Irish tax and EU data sovereignty regime | +3.1% | EU-wide; concentrated in Dublin | Long term (≥ 4 years) |
| New submarine-cable landings boost bandwidth | +1.9% | National; initial gains in Dublin, Cork, Galway | Medium term (2-4 years) |
| Grid-decarbonisation commitments lure green tenants | +2.3% | National; renewable-energy zones | Long term (≥ 4 years) |
| AI clusters driving high-density liquid-cooling demand | +3.7% | Global; concentrated in hyperscale hubs | Short term (≤ 2 years) |
| Source: Mordor Intelligence | |||
Hyperscale Cloud Expansion by US Tech Majors
Amazon’s USD 150 billion global data-center program reserves significant power blocks in Dublin, while Microsoft’s USD 500 million campus extension underscores confidence despite a grid-connection freeze.[1]Bloomberg News, “Amazon’s USD 150 Billion Expansion,” bloomberg.com Google’s newly filed EUR 200 million (USD 234.54 million) application signals commitment even after a separate site was denied for sustainability gaps. These investments amplify network effects that attract multi-cloud enterprise migrations, deepen supplier ecosystems, and elevate baseline design specifications such as 400 V power distribution and liquid-cooling loops. Irish component manufacturers, notably Danann Air, now export customized air-handling units worldwide, illustrating how local supply chains scale alongside hyperscaler footprints.
Strategic FLAPD Network Latency Advantage
Situated on the Frankfurt-London-Amsterdam-Paris-Dublin spine, the city leverages the Hibernia Express cable’s 59.5 ms New York-to-London round trip—six milliseconds faster than rivals—to entice algorithmic-trading, gaming, and AI-inference workloads. AEConnect’s 5,536 km transatlantic span delivers five-nines availability and 100 Gb/s wavelengths that feed Dublin’s interconnection campuses. Looking ahead, the EUR 1.1 billion (USD 1.29 billIon) Far North Fiber route via the Arctic Circle will anchor Galway into Asian networks, extending the nation’s reach beyond legacy UK pivot points.[2]Marine Ireland, “Far North Fiber Route Announcement,” marine.ie
Favourable Irish Tax and EU-Data-Sovereignty Regime
A 12.5% corporate tax rate combines with GDPR-aligned processing rules to draw US platforms seeking seamless EU market access. Microsoft’s February 2025 activation of its EU Data Boundary makes Dublin the default locus for European tenant data, turning compliance into a moat against less-certified peers.[3]Microsoft Blogs, “EU Data Boundary Completion,” blogs.microsoft.com Brexit uncertainty accelerates transfers from UK to Irish sites, while forthcoming AI-Act obligations position Dublin operators as turnkey partners for governance-intensive sectors.
New Submarine-Cable Landings Boost Bandwidth
The IRIS link between Galway and Iceland adds route diversity that lowers latency and hedges against UK landfall outages. Ireland’s first direct mainland-Europe cable, bypassing British territory, further secures continental trading paths, and legacy assets such as Virgin Media’s Sirius South continue to supply redundant capacity.
Restraints Impact Analysis*
| Restraint | (~) % Impact on CAGR Forecast | Geographic Relevance | Impact Timeline |
|---|---|---|---|
| Grid-connection moratorium and power-availability limits | -3.8% | Dublin metro; secondary in Cork and Galway | Medium term (2-4 years) |
| Rising electricity costs from EU carbon pricing | -1.9% | EU-wide; acute for high-consumption sites | Long term (≥ 4 years) |
| Community opposition over water-consumption spikes | -1.2% | Local; Dublin suburbs and rural zones | Short term (≤ 2 years) |
| Specialised-talent shortage in Irish DC operations | -2.1% | National; acute in Dublin and Cork | Medium term (2-4 years) |
| Source: Mordor Intelligence | |||
Grid-Connection Moratorium and Power-Availability Limits
EirGrid’s 2028 freeze on new metropolitan hookups forces operators either to self-generate or to site builds in lesser-loaded counties. Vantage’s 52 MW Dublin campus now runs hydrotreated-vegetable-oil (HVO) generators that satisfy power-purchase-agreement (PPA) carbon thresholds and circumvent queue delays. The policy entrenches incumbents, inflates land valuations, and shifts expansion capital toward Galway, Offaly, and Cork.
Rising Electricity Costs from EU Carbon Pricing
EU-ETS allowances push wholesale Irish rates toward EUR 60/MWh, magnifying cost exposure for legacy diesel spin-ups and making fixed-price renewable PPAs vital for margin defense. Operators are accelerating battery-energy storage and hydrogen-ready turbines, while AI-driven power-management software shaves peaks that coincide with maximum carbon-intensity hours.
*Our forecasts treat driver/restraint impacts as directional, not additive. The impact forecasts reflect baseline growth, mix effects, and variable interactions.
Segment Analysis
By Data Center Size: Mega Facilities Drive Hyperscale Consolidation
Mega campuses controlled 57.10% of Dublin data center market share in 2025. The Dublin data center market size for massive sites is projected to compound at 16.55% through 2031 as AI GPUs and liquid tanks raise per-rack densities. Incumbents exploit economies in substation build-outs, security, and talent pools that are hard for smaller designs to replicate.
Large and medium footprints retain vital roles for regulated industries and disaster-recovery nodes, yet growth tilts unmistakably toward installations exceeding 50 MW blocks. Edge-tier micro-sites emerge near Cork and Athlone to trim latency for fintech and 5G core slicing, but their aggregate megawatts remain modest relative to hyperscale clusters.


By Tier Type: Tier 3 Dominance Faces Tier 4 Disruption
Tier 3 remained the default with 64.10% of the Dublin data center market size in 2025, translating to roughly 353 MW at 1.6 PUE averages. As machine-learning pipelines migrate from research to mission-critical inference, Tier 4’s error-budget premiums become justifiable, moving its segment CAGR to 15.90%.
Operators retrofit secondary feeds, 2N+1 switchgear, and concurrently maintainable cooling loops that shrink fail-over intervals to microseconds. The tier schema itself may evolve: hybrid power designs now integrate curtailed wind, behind-the-meter batteries, and grid-interactive response that standard Uptime classifications fail to capture.
By Colocation Type: Hyperscale Segment Sustains Growth Leadership
The hyperscale colocation slice held 61.70% of Dublin data center market share in 2025. Multi-tenant wholesale suites give cloud providers turnkey scalability with lower stranded-capacity risk than self-builds.
Retail cages still court fintech start-ups and SaaS vendors, while interconnection-dense carrier hotels remain essential for peering and neutral-cloud exchanges. Take-or-pay power blocks embedded in recent hyperscale contracts protect facility cash-flows, helping operators raise low-cost debt such as Vantage’s record USD 13 billion round in January 2025.
By End User: Cloud and IT Dominance Reflects Digital Transformation
Cloud and IT firms consumed 29.20% of 2025 and will rise at 16.90% CAGR, underpinning the Dublin data center market’s expansion curve. Telecom groups leverage the same campuses for 5G core functions, while media CDNs pre-position high-bitrate libraries, reinforcing East-coast US to EU content flows.
Financial-services tenants seek Dublin’s sub-60 ms New York hops for pricing engines, and the public sector is consolidating legacy server rooms into “cloud-first” zones that must meet sovereign-hosted criteria. Because these user profiles value certified uptime and interconnection density over raw square footage, the city’s existing elastic ecosystem remains hard for challenger sites to replicate.
Geography Analysis
Ireland’s only Tier 1 metropolitan hub clusters along west Dublin’s fiber spine, where high-count conduits ride ESB Telecoms’ power easements to terrestrial landing stations . That corridor hosts 21% of national electricity draw, compelling EirGrid to cap incremental capacity until 2028. Despite the freeze, the Dublin data center market continues to aggregate European AI inference loads due to the city’s unique convergence of low-latency transatlantic paths and EU jurisdiction.
Cork is emerging as a secondary pole; new IRIS and Sirius South cables land there, and municipal authorities offer expedited permitting if operators integrate tidal-energy PPAs. Galway’s developing fiber rings, funded partly by the Far North Fiber consortium, are courting latency-sensitive science collaborations with Boston and Montreal. Rural Offaly and Longford advertise wind-co-location zones with sub-5 c/km grid-connection costs, enticing operators willing to pioneer remote operational models with autonomous-robot maintenance.
Regulatory Landscape
Ireland regulates large data center electricity access primarily through the Commission for Regulation of Utilities (CRU) and grid operators, with EirGrid handling at the transmission level. In December 2025, the CRU published its Large Energy Users Connection Policy (CRU/2025236), which replaced the earlier moratorium framework and tightened system-support obligations for new large loads, with Greater Dublin categorized as fully constrained for new large data center connections. Under the policy and its implementation, new connection offers in constrained regions are conditioned on demonstrable system need and the ability to support grid stability.
EirGrid operationalized the CRU direction through its Data Centre Connection Offer Process and Policy (DCCOPP3) published in May 2026. The policy requires facilities with Maximum Import Capacity (MIC) of 10 MVA or more to procure dispatchable onsite or proximate generation or storage, broadly matched to MIC (subject to de-rating factors), and to source at least 80% of annual electricity demand from new Irish renewable generation, with an allowed glide path of up to six years. In July 2026, EirGrid advanced Grid Code and operational measures including fault ride-through and demand curtailment procedures to limit the impact of sudden demand loss, formalizing tighter operating conditions for large demand customers. These changes directly shape data center design choices in Dublin toward self-generation, storage, and grid-interactive operations.
Competitive Landscape
Digital Realty operates nine local facilities totaling 485,000 sq ft and hosts more than 170 clients spanning pharma, fintech, and social-media workloads. AWS, Google, Meta, and Microsoft each run dedicated hyperscale campuses yet also lease wholesale suites when launch schedules outpace owned construction. This dual role blurs traditional supplier–customer lines and raises bar-entry requirements for newer firms. Vantage’s greenfield build brings 52 MW plus HVO-backed generation and district-heating export, illustrating how sustainability narratives now differentiate bids.
Supporting-chain specialists—from Vertiv’s cold-plate patents to John Sisk’s modular-shed techniques—are embedding themselves in project design charrettes to shave months off commissioning times and to navigate overlapping planning, water-use, and power conditions. Competitive intensity therefore migrates beyond mere megawatt delivery toward holistic compliance, ESG scoring, and speed-to-GPU-ready-rack outcomes.
Dublin Data Center Industry Leaders
Amazon Web Services
Microsoft Corporation
Google LLC
Meta Platforms Inc.
Digital Realty Trust Inc. (Interxion)
- *Disclaimer: Major Players sorted in no particular order

Market Opportunities and Future Outlook
The post-2025 connection-policy reset creates clearer whitespace for solutions that directly meet CRU and EirGrid obligations, namely dispatchable onsite or proximate generation and storage sized to Maximum Import Capacity thresholds, plus contracted supply from new Irish renewable generation to satisfy the 80% annual demand requirement within the permitted glide path. This reframes opportunity away from grid-only powered builds and toward integrated energy-and-data-center delivery models, including behind-the-meter generation, battery systems, and renewable projects structured to be demonstrably additional. The impact is most visible for hyperscale and wholesale colocation operators competing for scarce Dublin-area connection pathways.
Greater Dublin constraints also support development and leasing opportunities outside the most congested nodes, aligning with the broader national shift toward secondary locations such as Galway, Offaly, and Cork while keeping Dublin as the primary interconnection and latency anchor. Separately, the Irish Government workstream on Private Wires legislation, targeted for 2026, supports a pathway for private electricity infrastructure that can connect large loads more directly with proximate renewable parks, reinforcing demand for sites that combine land, planning readiness, and energy access. Within Dublin, operator investments that improve compliance and community acceptance, such as waste-heat recovery and water-efficient cooling, remain commercially relevant, including AWS highlighting district-heating reuse from its Tallaght facility and a market-wide pivot toward sustainability-linked design and permitting narratives.
Recent Industry Developments
- July 2026: Amazon Web Services planning approvals by An Coimisiún Pleanála for three data centers at Cruiserath Road, Dublin (Buildings E, F, G) totaling 73MW. The expansion adds incremental Dublin hyperscale capacity and supports AWS's footprint despite ongoing grid and permitting pressures.
- July 2026: Microsoft Corporation applied to the Environmental Protection Agency for a license to operate a 170MW gas-fired power plant at its Grange Castle campus. Onsite generation helps support large-scale Dublin data center demand and reflects a continued move toward private generation under grid constraints for AI-focused capacity.
- July 2026: Microsoft Corporation filed applications with the Irish Maritime Area Regulatory Authority for subsea cable systems (Tuskar, SOBR1, SOBR2) connecting Ireland to the UK. Subsea connectivity expansion for the Dublin data-center ecosystem supports resilience and capacity for cross-border data flows amid supply-chain diversification.


Research Methodology Framework and Report Scope
Market Definition and Coverage
This market covers data center capacity in Dublin, measured as installed and planned IT load (MW) across facilities serving cloud, colocation, and enterprise workloads, including expansions and new builds within the county and the wider metro footprint.
Scope exclusions: It excludes non-data-center telecom network assets, end-user IT hardware spend, and electricity generation projects unless they are directly tied to data center site readiness.
Segmentation Overview
- By Data Center Size
- Small
- Medium
- Large
- Massive
- Mega
- By Tier Type
- Tier 1 and 2
- Tier 3
- Tier 4
- By Data Center Type
- Cloud Service Providers (CSPs)
- Enterprise, Modular and Edge
- Colocation
- Utilized
- Colocation Type
- Retail
- Wholesale
- Hyperscale
- End User
- Cloud and IT
- Telecom
- Media and Entertainment
- Government
- BFSI
- Manufacturing
- E-Commerce
- Other End User
- Colocation Type
- Non-Utilized
- Utilized
Data Sources, Market Sizing, and Validation
Desk Research
Desk work starts with building a clean view of Dublin supply, demand signals, and constraints, so later assumptions have a real anchor. We typically review planning application registers, grid connection policy notes, and resource adequacy publications from Irish energy bodies (for example EirGrid and the Commission for Regulation of Utilities), since power availability and connection rules shape what can actually be delivered.
To size and sanity check the pipeline, we also use public sources such as national energy statistics (for example from SEAI), customs or trade releases for electrical equipment where relevant, peer reviewed papers on data center efficiency, and local authority updates on zoning and development. Company annual reports, investor decks, and reputable press are used to validate build timelines and capacity additions, and then a paid subscription for company financials, news, and patent lookups is used selectively to close gaps. These examples are not exhaustive, and many other public and paid sources were also referred to for data collection, validation, and clarification.
Primary Interviews and Surveys
Primary work is used to pressure test the desk model, especially around what capacity is truly deliverable versus only announced. We speak with operators, contractors, utility-facing advisors, and enterprise buyers so that assumptions on commissioning dates, absorption pace, and technical density line up with day-to-day realities across key European demand corridors that feed Dublin.
Inputs from these discussions help us correct for timing slips, phased fit-outs, and grid related constraints, and then we bring the updated assumptions back into the model for a final pass.
Distribution of primary research fieldwork respondents
| Company type | Respondent position | Region |
|---|---|---|
| Top tier: 26% | CXOs: 17% | APAC: 38% |
| Mid tier: 57% | Functional/Unit leaders: 26% | EMEA: 36% |
| Smaller Players: 17% | Managers: 57% | Americas: 26% |
Market-Sizing & Forecasting
Sizing is built using top-down and bottom-up checks, but the core logic is capacity led because this is a location constrained market. We reconstruct the demand pool from active and planned IT load additions in Dublin, and then map this to realistic commissioning timelines based on planning status, grid connection readiness, and typical construction lead times.
Key inputs include IT load (MW) by site, share of capacity under construction versus approved, expected phasing of fit-outs, average rack density shifts driven by higher power racks, and power availability signals such as Maximum Import Capacity discussions and connection policy milestones. Pricing is not treated as the primary driver in the total because the headline output is capacity, although it is used in checks when public colocation rate cues are available.
For the forecast, scenario analysis is used so that slower and faster delivery paths can be reflected when grid policy or permitting conditions change. Bottom-up validation is done through selective roll-ups of known campuses and expansions and through channel checks on typical MW blocks delivered per year, with gaps handled by using conservative utilization and phasing assumptions until better evidence is obtained.
Data Validation & Update Cycle
Model outputs are cross-checked against independent signals such as published grid demand outlooks, project pipeline tallies, and construction activity indicators, and then inconsistencies are flagged for a second review. When a variance is large, we re-check the underlying driver first, which is usually the commissioning date, the MW counted for a phase, or a change in connection readiness.
Before sign-off, another analyst reviews the logic, units, and assumptions so calculation errors and double counting risks are reduced. Reports are refreshed annually, and interim updates are made when there are material events such as large approvals, cancellations, or major policy changes. Right before delivery, we do a quick final pass so clients receive the most current view possible.
Mordor Intelligence's Dublin Data Center Market Size Compared Against Other Published Estimates
Published market numbers for Dublin data centers can look far apart because authors do not always measure the same thing, even if the title sounds similar. Some quotes focus on operational IT load only, some mix operational with pipeline, and others switch the unit to revenue, which makes comparisons feel confusing.
A second driver is how grid readiness is treated, since this market has a real constraint on new connections and it directly affects what can be commissioned on time. Some estimates also report Ireland wide totals or only third-party colocation revenue, and then the Dublin view is implied rather than modeled from site level capacity and delivery timing.
Benchmark comparison
| Source | Market Size | Gaps in Research Methodology |
|---|---|---|
| Mordor Intelligence | USD 0.55 T (2025) | |
| Trade Journal A | USD 0.74 T (2024) | Uses an operational active power load figure and can blend in broader metro interpretations, so it is closer to a point-in-time capacity snapshot than a base-year market sizing with pipeline timing. |
| Industry Report B | USD 0.58 T (2024) | Focuses on colocation revenue at a country level, and Dublin exposure is often inferred from facility counts and share assumptions instead of being built from Dublin-specific IT load additions. |
The table points to a scope and unit mismatch more than a true disagreement on direction. Some published figures are framed as operational load or colocation revenue, then the number is carried into a Dublin narrative. For Mordor Intelligence, the count is limited to Dublin capacity in MW terms for the stated base year, with commissioning and phasing assumptions checked through grid and project readiness discussions, which keeps the total traceable to deliverable IT load additions.


Key Questions Answered in the Report
What is the current Dublin data center market size?
The Dublin data center market size is 0.63 thousand MW in 2026 and is tracking toward 1.25 thousand MW by 2031.
How fast is the Dublin data center market growing?
Capacity is expanding at a 14.68% CAGR through 2031, driven by hyperscale cloud demand, AI workloads, and low-latency connectivity.
Why did EirGrid impose a grid-connection moratorium?
EirGrid paused new metropolitan hookups until 2028 to protect system reliability, prioritizing projects with on-site generation or proven grid support.
Which colocation segment leads in Dublin?
Hyperscale colocation leads with 61.70% share and continues to expand at 15.20% CAGR as cloud providers seek rapid, large-scale deployments.
Page last updated on:






