
Drug Screening Market Size and Share
Market Overview
| Study Period | 2020 - 2031 |
|---|---|
| Market Size (2026) | USD 9.86 Billion |
| Market Size (2031) | USD 20.86 Billion |
| Growth Rate (2026 - 2031) | 16.16 % |
| Fastest Growing Market | Asia-Pacific |
| Largest Market | North America |
| Market Concentration | Medium |
Major Players *Disclaimer: Major Players sorted in no particular order Image © Mordor Intelligence. Reuse requires attribution under CC BY 4.0. | |
Drug Screening Market Analysis by Mordor Intelligence
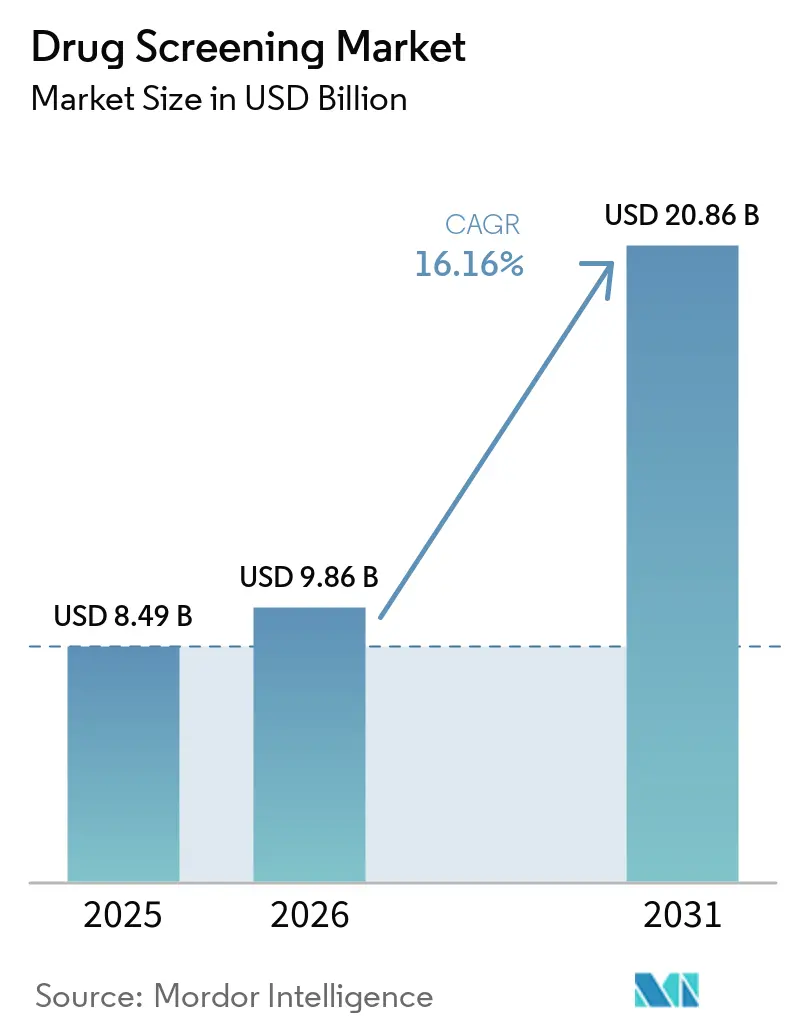
The drug screening market size was valued at USD 8.49 billion in 2025 and estimated to grow from USD 9.86 billion in 2026 to reach USD 20.86 billion by 2031, at a CAGR of 16.16% during the forecast period (2026-2031). The ascent reflects stricter workplace compliance mandates, wider integration into clinical care, and rapid technological improvements that shorten turnaround times while detecting a broader range of substances. Employers in safety-sensitive sectors are expanding oral-fluid and point-of-care testing after regulatory bodies approved alternative specimens, while healthcare systems embed routine toxicology panels within pain-management protocols. Consolidation among major laboratories continues, yet nimble innovators are penetrating the market through niche rapid-test devices and AI-enabled automation that lower cost per test. North America remains the largest regional contributor, whereas Asia-Pacific delivers the fastest incremental revenue due to expanding healthcare coverage and new road-safety policies.
Key Report Takeaways
- By product & service, consumables captured 33.72% of drug screening market share in 2025, and rapid testing devices are forecast to expand at an 18.07% CAGR through 2031.
- By technology, chromatography and mass spectrometry commanded 44.77% share of the drug screening market size in 2025, while immunoassay methods are projected to grow at 19.27% CAGR to 2031.
- By sample type, urine testing accounted for 48.61% of the drug screening market size in 2025; oral fluid is advancing at a 16.85% CAGR during 2026-2031.
- By testing setting, workplace programs represented 34.58% revenue share in 2025 and drug treatment facilities are rising at a 19.04% CAGR to 2031.
- By end-user, drug testing laboratories commanded 45.74% share of the market size in 2025, whereas Home & OTC record the fastest growth at 20.96% CAGR.
- By geography, North America generated 40.88% of global revenue in 2025, whereas Asia-Pacific is set to post a 19.61% CAGR from 2026 to 2031.
Note: Market size and forecast figures in this report are generated using Mordor Intelligence’s proprietary estimation framework, updated with the latest available data and insights as of 2026.
Market Trends and Insights
Drivers Impact Analysis of Drug Screening Market*
| Driver | (~) % Impact on CAGR Forecast | Geographic Relevance | Impact Timeline |
|---|---|---|---|
| Escalating Workplace Compliance Requirements | +4.2% | Global, with highest impact in North America and Europe | Short term (≤ 2 years) |
| Rising Global Prevalence of Substance Abuse | +3.8% | Global, with concentration in North America | Medium term (2-4 years) |
| Expansion of Point-of-Care & Rapid Testing Technologies Enhancing Accessibility | +2.8% | Global, with early adoption in developed markets | Medium term (2-4 years) |
| Integration in Opioid Stewardship | +2.5% | North America, with spillover to Europe | Medium term (2-4 years) |
| Advancements in Laboratory Automation | +2.1% | Global, with early adoption in developed markets | Long term (≥4 years) |
| Strengthening Road-Traffic Safety Programs | +1.9% | Global, with highest impact in Europe and North America | Medium term (2-4 years) |
| Source: Mordor Intelligence | |||


Escalating Workplace Compliance Requirements Across Safety-Sensitive Industries
Regulators have preserved a 50% random-testing rate for commercial motor-vehicle drivers and formally recognized oral-fluid specimens as an alternative to urine, energizing employer demand for diverse test panels[1]Drug Testing Supplies, “Understanding the DOT Drug Testing Changes 2025,” drugtestingsupplies.com. Legalization of recreational and medical cannabis in numerous states is prompting firms to recalibrate zero-tolerance policies while still safeguarding safety objectives. Positive marijuana findings are rising in routine workplace panels, challenging HR teams to differentiate recent impairment from residual metabolites. Federal statutes such as the Fair Credit Reporting Act and Title VII continue to shape pre-employment protocols, creating a patchwork of compliance obligations. Collectively, these dynamics intensify employer reliance on comprehensive screening platforms that integrate legal adjudication and digital result reporting.
Rising Global Prevalence of Substance Abuse and Overdose Mortality
The UN reported a 20% rise in drug use over the last decade, heavily burdening healthcare systems. Governments and payers are responding by mandating risk-stratified toxicology testing within addiction-treatment pathways. The surge in substance misuse also elevates employer healthcare costs and absenteeism, reinforcing corporate interest in routine testing. Consequently, demand for multi-panel kits capable of detecting emerging synthetics is swelling across clinical, workplace, and forensic settings.
Expansion of Point-of-Care and Rapid Testing Technologies Enhancing Accessibility
Rapid test devices deliver results in minutes, suiting roadside screening and post-incident investigations. Adoption accelerates as sensitivity and specificity approach laboratory benchmarks while costs fall through microfluidic design innovations. The Department of Transportation’s oral-fluid approval removed a structural barrier to field deployment, spurring procurement among logistics operators and law-enforcement agencies. Manufacturers are embedding Bluetooth-enabled readers that transmit encrypted data to cloud dashboards, enabling immediate compliance audits. This portability democratizes testing access for small firms and remote clinics, broadening the drug screening market footprint.
Integration in Opioid Stewardship and Pain-Management Protocols
Payers stipulate toxicology verification before authorizing long-term opioid therapy, and clinical guidelines recommend periodic monitoring tailored to patient risk levels[2]Blue Cross Blue Shield of Michigan, “Medical Policy – Drug Testing in Pain Management and Substance Use Disorder Treatment,” bcbsm.com. Healthcare providers therefore order presumptive immunoassays followed by definitive mass-spectrometry confirmation to distinguish therapeutic adherence from diversion. Quest Diagnostics has expanded panels to include novel adulterants, supporting clinicians as misuse patterns shift toward synthetic analogs. The clinical demand sustains high-complexity laboratories while pushing point-of-care innovators to enhance breadth of detectable opioids.
Restraints Impact Analysis of Drug Screening Market*
| Restraint | (~) % Impact on CAGR Forecast | Geographic Relevance | Impact Timeline |
|---|---|---|---|
| Data-Privacy and Employee-Rights Regulations | -2.8% | North America and Europe primarily | Short term (≤ 2 years) |
| High Capital and Operational Costs of Confirmatory LC-MS/MS Platforms | -2.1% | Global, with highest impact in emerging markets and smaller facilities | Medium term (2-4 years) |
| Reliability Concerns | -1.6% | Global | Medium term (2-4 years) |
| Limited Toxicology Infrastructure | -0.9% | Asia-Pacific, Middle East, Africa, and parts of Latin America | Long term (≥4 years) |
| Source: Mordor Intelligence | |||
Data-Privacy and Employee-Rights Regulations Limiting Random Testing
The proposal to reschedule marijuana from Schedule I to Schedule III signals softer federal posture, encouraging employees to challenge blanket testing policies. Overlapping statutes, such as the Americans with Disabilities Act and Fair Credit Reporting Act, require explicit consent and strict data handling, raising administrative burden. Companies increasingly shift to risk-based programs to avoid litigation, trimming test volumes and tempering near-term growth in the drug screening market.
High Capital and Operational Costs of Confirmatory LC-MS/MS Platforms
Definitive testing via liquid chromatography–tandem mass spectrometry demands six-figure equipment investments, trained analysts, and ongoing reagent expenses, barriers that deter smaller labs in emerging economies. Outsourcing helps but extends turnaround times, reducing utility in time-critical contexts. Although automation is lowering per-sample cost, the upfront expenditure still constrains adoption and caps expansion of the drug screening market size in price-sensitive regions.
*Our forecasts treat driver/restraint impacts as directional, not additive. The impact forecasts reflect baseline growth, mix effects, and variable interactions.
Drug Screening Market Segment Analysis
By Product & Service:
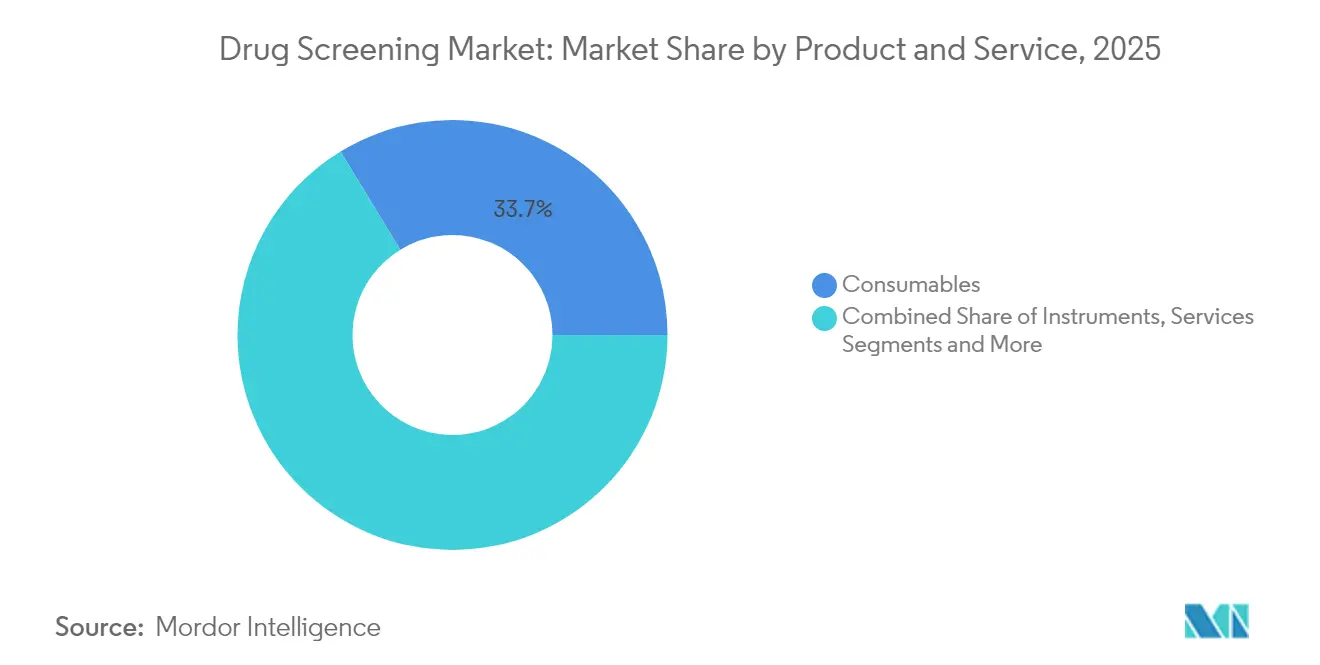
Consumables Retain Primacy as Rapid Devices SurgeConsumables generated 33.72% of 2025 revenue, underlining their indispensable role in every assay and ensuring recurring income for suppliers. The segment is buoyed by steady replenishment cycles across hospital labs, workplace clinics, and forensic units. Heightened testing frequency within opioid-monitoring protocols guarantees stable demand for immunoassay reagents and calibrators. Rapid testing devices, though smaller today, are projected to record an 18.07% CAGR, reshaping the drug screening market with near-instant oral-fluid, saliva, and breath formats that circumvent laboratory delays. The drug screening market size for rapid devices could climb notably as DOT endorsements spur fleet operators to deploy field analyzers on a large scale. Instrument vendors concentrate on modular analyzers with AI-driven maintenance alerts, allowing mid-tier labs to scale capacity without adding skilled labor. Service bundles that merge kit supply, cloud result portals, and medical review are also emerging, deepening client stickiness.
The strategic pivot to hybrid product-service ecosystems is sharpening competitive differentiation. Labcorp's Global Trial Connect enhancement digitizes requisitions and automates chain-of-custody, reducing paper by 70% and speeding resolution of lab queries. Such integrated offerings elevate customer experience and reinforce supplier lock-in. Start-ups specializing in designer-drug panels are grabbing share in sub-segments like harm-reduction clinics, indicating that product breadth paired with digital convenience will dictate future gains in the drug screening market.


By Technology:
Mass Spectrometry Dominates Yet Immunoassay AcceleratesChromatography coupled with high-resolution mass spectrometry captured 44.77% of 2025 revenues, maintaining its status for definitive confirmation. The capability to quantify trace levels of nitazenes and xylazine safeguards clinical decisions and forensic conclusions, anchoring its leadership in the drug screening market. SCIEX QTOF instruments deliver high-throughput acquisition without sacrificing mass accuracy, enabling labs to confirm positives from large screening programs. However, immunoassay platforms now grow at 19.27% CAGR, leveraging improved antibodies and microfluidics to deliver lab-quality performance at the point of care. bioMérieux's acquisition of SpinChip for EUR 111 million (USD 126.9 million) adds an ultra-rapid cartridge format to its portfolio, delivering 10-minute results vital for emergency departments.
Breath analyzers are gaining acceptance in roadside enforcement due to non-invasive sampling and real-time detection within impairment windows, and graphene-based biosensors promise to enhance anabolic-steroid screening sensitivity. The drug screening market share of mass spectrometry may gradually taper as decentralized settings opt for faster immunoassays; nonetheless, confirmatory demand ensures enduring relevance for high-complexity labs. The interplay between accuracy requirements and operational constraints will keep both modalities financially attractive.
By Sample Type:
Urine Prevalence Meets Oral-Fluid MomentumUrine maintained a 48.61% share in 2025 due to well-established cutoff standards and an unrivaled historical database that aids interpretation. Extensive validation across hundreds of drugs sustains its use in compliance, pain management, and insurance underwriting. Yet oral-fluid samples now register the strongest CAGR at 16.85%, reflecting their aptitude for detecting recent use and simplifying observed collection. DOT’s 2023 rulemaking positions oral-fluid as co-equal with urine, and once certification of reference labs concludes, adoption will accelerate, lifting the drug screening market size for oral-fluid assays. Hair testing remains niche; its 90-day detection window is attractive, yet guideline delays and dual-specimen requirements limit scale. Emerging dried-blood-spot techniques appeal to anti-doping agencies given sub-0.4 ng/mL detection limits for anabolic steroids, but further clinical validation is needed for workplace use.
Overall, specimen diversification aids test providers in tailoring protocols to precise risk profiles. Employers may blend oral-fluid for post-incident checks with urine for pre-employment, while clinicians combine urine and blood spotting for complex therapeutic monitoring. Such hybrid strategies expand unit volumes across multiple specimen categories, reinforcing revenue resilience within the drug screening market.
By Testing Setting:
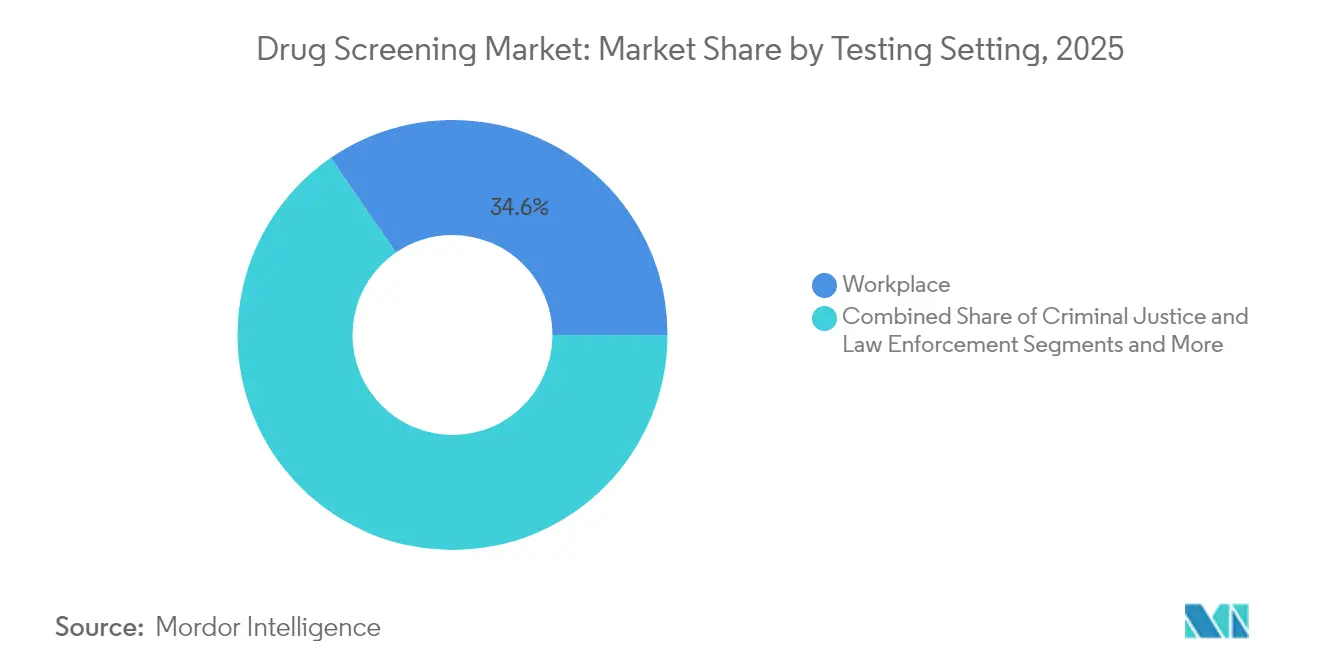
Workplace Screening Dominates as Rehabilitation Gains PaceWorkplace programs produced 34.58% of 2025 revenue, propelled by mandatory screening in transportation, aviation, and petrochemicals. SAMHSA guidance stipulates structured chains-of-custody and medical-review oversight, sustaining demand for bundled lab and advisory services. Despite maturity, employers are upgrading programs to incorporate expanded opioid panels and synthetic cannabinoids, preventing attrition in unit volume. Drug treatment and rehabilitation facilities exhibit the highest segment CAGR of 19.04% as governments allocate larger budgets to behavioral-health expansion and integrate toxicology monitoring to assess patient progress. The in vitro testing segment dominates the toxicology drug screening market, commanding approximately 56% of the total market share in 2024.
Law-enforcement and criminal-justice settings remain material given rising parole-monitoring caseloads and court-mandated sobriety testing. Pain-management clinics increasingly leverage definitive testing to validate adherence, estimating dosage adjustments and mitigating diversion risks. Each setting imposes distinct turnaround and reporting requirements, compelling suppliers to customize logistics, panel configurations, and data-integration pathways, which in turn strengthens segmentation within the drug screening market.
By End User:
Laboratories Lead While Home Testing Climbs FastDedicated toxicology laboratories hold 45.74% revenue share in 2025, buttressed by economies of scale, multi-discipline expertise, and advanced automation that ensure high sensitivity across thousands of daily samples. Charles River’s high-resolution bioanalytical mass-spectrometry services illustrate laboratory leadership in complex molecule quantification for pharma trials. The home and over-the-counter (OTC) channel, however, is expanding at a 20.96% CAGR due to growing consumer focus on privacy, telehealth partnerships, and e-commerce availability of self-collection kits. Retail pharmacies stock saliva and urine kits that activate laboratory confirmation if initial results are positive, merging convenience with clinical rigor.
Hospitals and outpatient clinics maintain steady share by embedding toxicology in emergency and chronic-care workflows. Government agencies, sports bodies, and educational institutions form a fragmented yet rising pool that commissions specialized panels for designer drugs or performance-enhancing agents. As digital connectivity improves, even small entities access sophisticated panels through mail-in kits, evidencing broad democratization in the drug screening market.
Geography Analysis
North America Drug Screening Market
North America dominated with 40.88% revenue in 2025, reflecting stringent federal mandates, extensive insurance reimbursement, and high employer adoption. Fentanyl and norfentanyl joined federal panels in July 2025, compelling public employers to upgrade assays and sustain growth in the drug screening market. Leading laboratories deploy robotics and AI-enabled informatics, reinforcing regional cost and quality leadership.
APAC, EMEA and South America Drug Screening Market
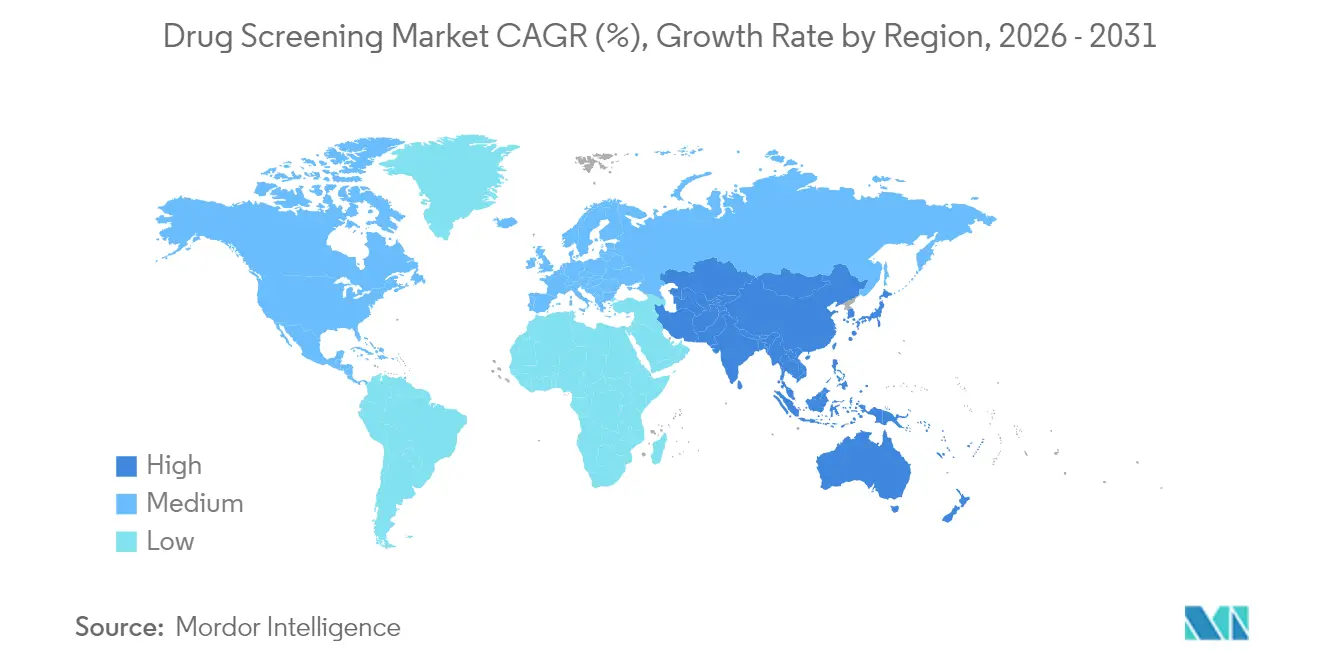
Asia-Pacific represents the fastest expansion, forecast at a 19.61% CAGR for 2026-2031. China’s 2025-2027 regulatory roadmap simplifies registration procedures, accelerating new test launches and attracting investment. Nations such as South Korea and Singapore nurture biotech clusters, while Indonesia and Vietnam scale domestic manufacturing, each scenario widening access to point-of-care kits and lab services. Growing road-safety campaigns and employer policies converge to enlarge specimen volumes. As a result, Asia-Pacific’s contribution to the drug screening market size will likely surpass Europe during the forecast window. Europe maintains significant share through rigorously enforced worker-safety directives and roadside impairment programs. Intelligent Bio Solutions’ alliance with IVY Diagnostics targets the region’s USD 3.6 billion opportunity with oral-fluid solutions that align with roadside initiatives. Middle East and Africa markets show emerging potential amid hospital-build programs and multinational workforce regulation in GCC economies. South America, led by Brazil, benefits from expanding public-health funding and corporate awareness campaigns, yet infrastructure gaps temper near-term growth. Geographic heterogeneity obliges suppliers to tune pricing, specimen preferences, and regulatory dossiers for each jurisdiction, but it also insulates the global drug screening market against localized downturns.

Regulatory Landscape
In the United States, workplace and transportation drug testing is anchored by the HHS Mandatory Guidelines for Federal Workplace Drug Testing Programs (Urine and Oral Fluid). The authorized analyte panels and cutoffs were reaffirmed in the Federal Register on March 13, 2026, with the earlier effective date maintained (July 7, 2025). DOT compliance under 49 CFR Part 40 continued to evolve in 2026, with a final rule published May 11, 2026 (effective June 10, 2026) updating procedures and requiring directly observed urine collections in specified situations when oral fluid testing cannot be conducted. The rule reinforces operational requirements for collection sites, laboratories, and employer programs.
On the medical device side, FDA quality and oversight frameworks influence drug screening instrument and consumable manufacturers supplying clinical settings. The Quality Management System Regulation (QMSR) took effect on February 2, 2026, aligning more closely with ISO 13485:2016. Separately, FDA opened a policy discussion on May 1, 2026 via a Federal Register notice seeking comment on removing 510(k) clearance requirements for devices used in federally regulated drug testing programs. If adopted, this could change the pathway for certain workplace-forensic use technologies, while leaving clinical IVD expectations under FDA device regulation intact.
Competitive Landscape
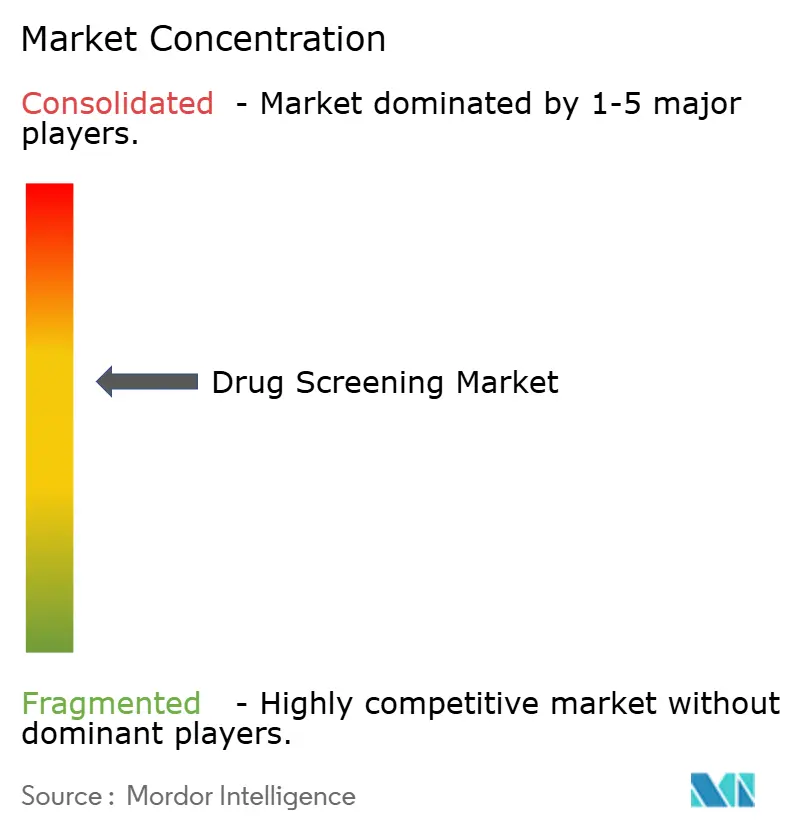
The drug screening market exhibits moderate concentration: LabCorp, Quest Diagnostics, and Abbott Laboratories jointly account for a sizeable share through comprehensive panels, national logistics, and payer contracts. Strategic M&A continues; bioMérieux’s SpinChip deal enriches point-of-care offerings, revealing an appetite for niche technologies that complement existing menus. Partnerships, exemplified by Intelligent Bio Solutions and IVY Diagnostics, advance regional penetration without heavy capital expenditure.
Technology remains a key differentiator. SCIEX advances high-resolution mass-spectrometry platforms that detect ultra-low concentrations, appealing to forensic and professional sports customers. In parallel, start-ups build handheld immunoassay analyzers calibrated for synthetic cannabinoids, a gap in legacy lab menus. Digital integration is equally pivotal; LabCorp’s Trial Connect streamlines chain-of-custody and real-time tracking, heightening customer retention. Moderate barriers to entry, caused by accreditation requirements and complex logistics, deter commoditization, yet the influx of agile device makers ensures vibrant competition across sub-segments of the drug screening market.
Drug Screening Industry Leaders
Quest Diagnostics
Abbott Laboratories
Thermo Fisher Scientific, Inc.
Siemens Healthineers
LabCorp (Laboratory Corporation of America Holdings)
- *Disclaimer: Major Players sorted in no particular order
Drug Screening Market Companies Covered in this Report
- LabCorp
- Quest Diagnostics
- Abbott Laboratories
- Thermo Fisher Scientific
- Roche
- Siemens Healthineers
- Orasure Technologies
- Dragerwerk
- Shimadzu
- Alfa Scientific Designs
- LifeLoc Technologies
- Premier Biotech Inc.
- Beckman Coulter Diagnostics
- Psychemedics
- Omega Laboratories
- Intoximeters
- Cordant Health Solutions
- Bio-Rad Laboratories
- Danaher
- Agilent Technologies

Market Opportunities and Future Outlook
Program expansion and specimen diversification in regulated workplace testing are creating room for turnkey oral-fluid solutions and compliance-focused collection logistics. The DOT final rule effective June 10, 2026 underscores that operational continuity still depends on oral fluid testing availability, while also reinforcing procedural rigor, including directly observed urine collections in specified circumstances. This combination tends to favor providers that bundle collection execution, chain-of-custody digitization, and rapid presumptive testing with definitive confirmation routing. HHS reaffirmed in March 2026 that federal workplace panels and cutoffs remain unchanged, supporting ongoing demand for validated multi-analyte menus across urine and oral fluid rather than frequent reconfiguration.
Decentralized and non-invasive screening continues to draw investment and deployment in larger employer settings, extending addressable testing beyond traditional lab-centric workflows. In January 2026, Intelligent Bio Solutions initiated additional clinical studies to support a 510(k) submission for codeine detection. In February 2026, it partnered with Bouygues UK to roll out fingerprint-based drug screening within construction operations, reflecting employer demand for faster, in-house testing models. On the technology roadmap, Lifeloc Technologies commissioned a cleanroom and completed production mold tooling in June 2026 for its SpinDetect drug analyzer, indicating continued capacity build for point-of-care instrumentation targeting faster turnaround and broader field deployment.
Recent Industry Developments in Drug Screening Market
- July 2026: Quest Diagnostics published its 2026 Drug Testing Index, citing that 19.1% of the general US workforce tested positive in hair specimens collected during 2025. The dataset underscores the role of alternative specimens in long-window detection and informs employer and laboratory decisions on specimen mix and panel configuration.
- June 2026: Thermo Fisher Scientific unveiled the Orbitrap Excedion mass spectrometer platform at ASMS 2026, positioning it for regulated bioanalysis and QA/QC workflows. The release supports the upgrade cycle for definitive confirmation capabilities used in clinical, forensic, and high-throughput testing laboratories.
- April 2026: Intelligent Bio Solutions initiated a validation study for its Intelligent Fingerprinting Drug Screening System, targeting analysis time under three minutes for roadside and workplace use cases. Faster time-to-result supports broader point-of-care deployment where operational decisions depend on immediate screening outcomes.


Drug Screening Market Report Scope and Research Methodology
Market Definition and Coverage
For this study, the drug screening market covers products and services used to detect prescription or illicit substances in human samples, across workplace, clinical, forensic, and home testing settings, with revenue reported at the market level.
Scope exclusions: We exclude pharmaceutical toxicology assays used in R&D and elite sport anti-doping programs because their workflows, buyers, and regulations are tracked differently.
Segments Covered in This Report
- By Product & Service
- Consumables
- Instruments
- Rapid Testing Devices
- Services
- By Technology
- Immunoassay
- Chromatography & Mass-Spectrometry
- Breath Analysers
- Others
- By Sample Type
- Urine
- Oral Fluid
- Hair
- Other Samples
- By Testing Setting
- Workplace
- Criminal Justice & Law Enforcement
- Pain Management & Opioid Monitoring
- Drug Treatment & Rehabilitation
- By End User
- Drug Testing Laboratories
- Hospitals & Clinics
- Home & OTC
- Others
- Geography
- North America
- United States
- Canada
- Mexico
- Europe
- Germany
- United Kingdom
- France
- Italy
- Spain
- Rest of Europe
- Asia-Pacific
- China
- Japan
- India
- South Korea
- Australia
- Rest of Asia-Pacific
- Middle East and Africa
- GCC
- South Africa
- Rest of Middle East and Africa
- South America
- Brazil
- Argentina
- Rest of South America
- North America
Data Sources, Market Sizing, and Validation
Desk Research
Desk research helps us anchor the model to real demand signals and to the way testing is regulated and reported. We reviewed public health and policy materials that explain where testing occurs and how programs scale, along with statistics on substance use patterns and testing requirements. Typical sources included agencies and public datasets such as CDC, SAMHSA, and NIDA, plus guidance from OSHA and similar national workplace safety bodies.
To connect demand to spend, we also used manufacturer and laboratory disclosures such as annual reports, investor presentations, and product documentation. These sources clarify menu pricing logic and technology shifts (for example, oral-fluid adoption versus urine testing). Peer reviewed publications and association resources were used to sense-check cutoffs, confirmatory rates, and common lab workflows. We referenced paid subscriptions for company financials and intelligence, patent databases, and shipment-level import and export data selectively to cross-check product activity and category direction. These desk sources are not exhaustive, and many other public and paid references were used for data collection, validation, and clarification.
Primary Interviews and Surveys
Primary interviews and surveys were used to validate how testing volumes, pricing, and confirmatory practices vary by setting, and where demand is shifting (for example, point-of-care versus central lab). We spoke with a mix of test manufacturers, distributors, third-party labs, hospital and clinic stakeholders, and workplace program administrators, and used their feedback to tighten assumptions by region and end-use.
Distribution of primary research fieldwork respondents
| Company type | Respondent position | Region |
|---|---|---|
| Top tier: 27% | CXOs: 12% | APAC: 40% |
| Mid tier: 58% | Functional/Unit leaders: 36% | EMEA: 33% |
| Smaller Players: 15% | Managers: 52% | Americas: 27% |
Market-Sizing & Forecasting
Market sizing was built using a top-down and bottom-up approach, where the top-down side starts from the addressable testing pool by setting and then converts it into spending using realistic price and mix assumptions. In practice, we reconstructed demand by linking indicators such as workforce testing coverage, clinical and emergency testing intensity, forensic testing activity, and the split between screening and confirmatory activity. We then applied average selling price logic by test type and sample type.
To keep the totals grounded, we ran selective bottom-up checks using supplier and channel signals, sampled menus from labs and point-of-care providers, and a volume times ASP view for a subset of high-adoption countries. Those checks were then used to adjust the top-down outputs. Key model inputs included the share of rapid tests versus lab-based methods, shifts toward oral-fluid testing, test panel breadth and retest frequency, the confirmatory rate following a presumptive positive, and regional reimbursement or employer compliance behavior. Where bottom-up inputs were incomplete, gaps were handled by using conservative adoption ranges that were validated in interviews, followed by sensitivity checks on the variables that move revenue the most.
For forecasting, scenario analysis was used because demand is influenced by policy enforcement, budget cycles, and technology substitution that do not move in a straight line each year. Growth paths were set by region after aligning interview feedback with observable signals such as policy changes, automation uptake, and sample-type shifts. The model was then reconciled to keep mix and pricing movements consistent over time.
Data Validation & Update Cycle
Validation is done by checking whether model outputs align with independent signals, such as how much testing is required under typical workplace programs, how clinical testing volumes are discussed by providers, and how technology mix is shifting in labs. When large variances show up, assumptions are revisited and then re-tested with additional follow-ups, especially for pricing, confirmatory behavior, and country-level adoption.
Before sign-off, the model goes through multiple analyst reviews with clear variance thresholds and anomaly checks on growth, mix, and implied price movements. Reports are refreshed annually, with interim updates when material events occur, and a final review pass is completed close to publication so clients receive the latest updated view.
Mordor Intelligence's Drug Screening Market Sizing Compared With Other Published Estimates
Published market sizes for drug screening can look far apart because teams often count different revenue buckets, use different timing for currency conversion, and apply different pricing logic for rapid tests versus lab testing. We also see gaps when one estimate emphasizes product shipments while another mixes in services, or when the base year is not aligned to the same demand signals.
A refresh-led difference is common in this market because list prices, confirmatory practices, and sample-type mix can change quickly, and those shifts move revenue even if total tests grow steadily. By locking FX timing to the stated year, re-checking average selling prices against current lab menu patterns, and re-contacting sources when implied growth breaks typical testing program behavior, Mordor Intelligence keeps the estimate tied to what buyers are paying in the period being measured.
Benchmark comparison
| Source | Market Size | Gaps in Research Methodology |
|---|---|---|
| Mordor Intelligence | USD 9.86 B (2026) | |
| Global Consultancy A | USD 9.10 B (2024) | Uses an earlier-year snapshot and applies list-price style ASPs across products, which can understate the effect of services revenue and later mix shifts toward newer sample types. |
| Trade Journal B | USD 13.80 B (2024) | Leans toward shipment-led counting and broad panel assumptions, and the service component is not consistently separated, which can inflate revenue when confirmatory and repeat-testing rates are generalized. |
The table shows that timing and what gets counted as revenue (products only, services only, or both) are the main reasons for the spread. Our approach stays repeatable because each step ties back to clear testing settings, mix assumptions, and practical price checks, and then it is validated through targeted follow-ups when the implied revenue per test looks unrealistic.


Key Questions Answered in the Report
What is the current size of the drug screening market?
The drug screening market is valued at USD 9.86 billion in 2026 and is forecast to grow to USD 20.86 billion by 2031.
Which region leads global revenues?
North America leads with 40.88% share in 2025 due to stringent federal regulations and high employer adoption.
What segment is growing fastest?
Rapid testing devices show the highest growth, advancing at an 18.07% CAGR between 2026 and 2031.
How is oral-fluid testing influencing market dynamics?
DOT approval of oral-fluid specimens boosts adoption in workplaces and roadside programs, accelerating segment CAGR to 16.85%.
What technologies dominate definitive confirmation?
Chromatography coupled with high-resolution mass spectrometry remains the gold standard, holding 44.77% revenue share in 2025.
How do privacy regulations impact workplace testing?
Expanding employee-rights laws and marijuana reclassification compel employers to adopt more targeted, risk-based testing strategies, slightly moderating test volumes.
Page last updated on:


 Your data is secure and never sold or shared.


