
Drug Discovery Informatics Market Size and Share
Market Overview
| Study Period | 2020 - 2031 |
|---|---|
| Market Size (2026) | USD 3.27 Billion |
| Market Size (2031) | USD 5.25 Billion |
| Growth Rate (2026 - 2031) | 9.97 % |
| Fastest Growing Market | Asia Pacific |
| Largest Market | North America |
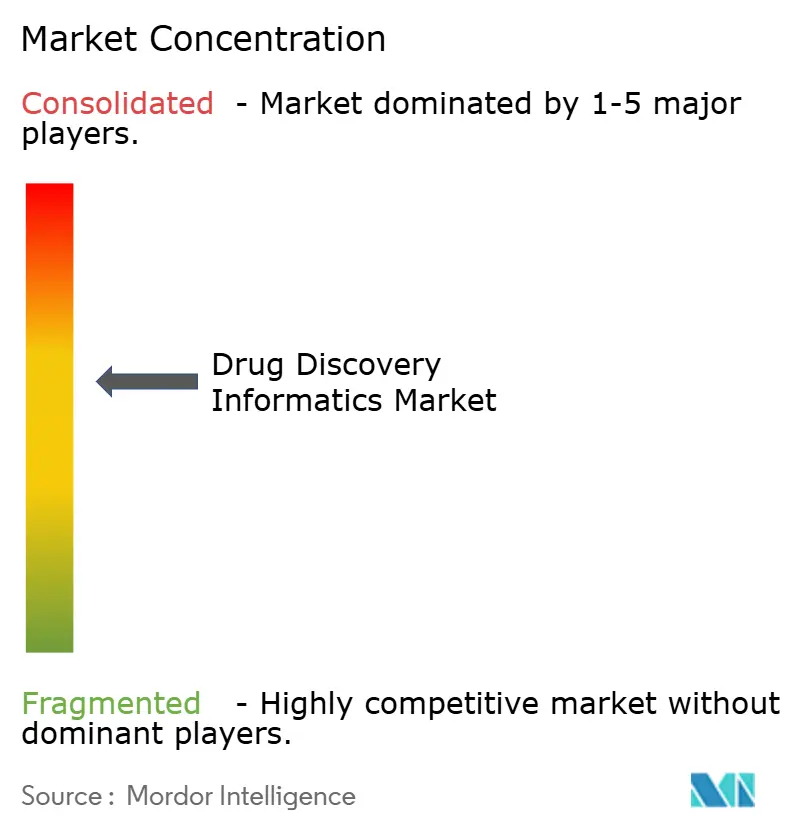
| Market Concentration | Medium |
Major Players *Disclaimer: Major Players sorted in no particular order Image © Mordor Intelligence. Reuse requires attribution under CC BY 4.0. | |
Drug Discovery Informatics Market Analysis by Mordor Intelligence
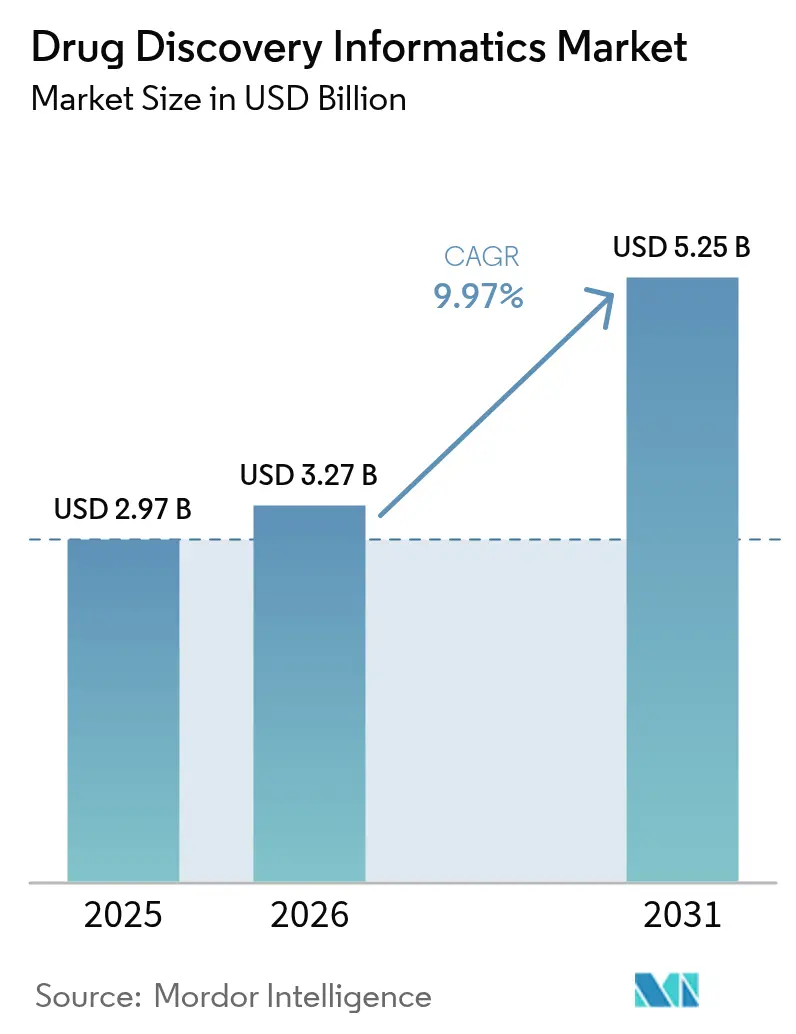
The drug discovery informatics market size was valued at USD 2.97 billion in 2025 and estimated to grow from USD 3.27 billion in 2026 to reach USD 5.25 billion by 2031, at a CAGR of 9.97% during the forecast period (2026-2031). Rapid adoption of AI-driven target identification, cloud-based molecular modeling, and multi-omics integration is helping pharmaceutical companies compress discovery timelines from 10-15 years to nearly half that period. More than 93% of life-sciences technology executives intend to increase AI budgets, signalling durable demand for platforms that convert expanding genomic, proteomic, and clinical data sets into viable leads. Market momentum also reflects heightened R&D spending, regulatory initiatives that clarify AI validation pathways, and rising demand for precision medicine solutions able to match therapies to smaller patient subpopulations. Meanwhile, large-scale acquisitions—such as Siemens’ USD 5.1 billion purchase of Dotmatics—underline an industry pivot toward unified, end-to-end digital research environments that cover everything from experiment capture to compliant data archiving.
Key Report Takeaways
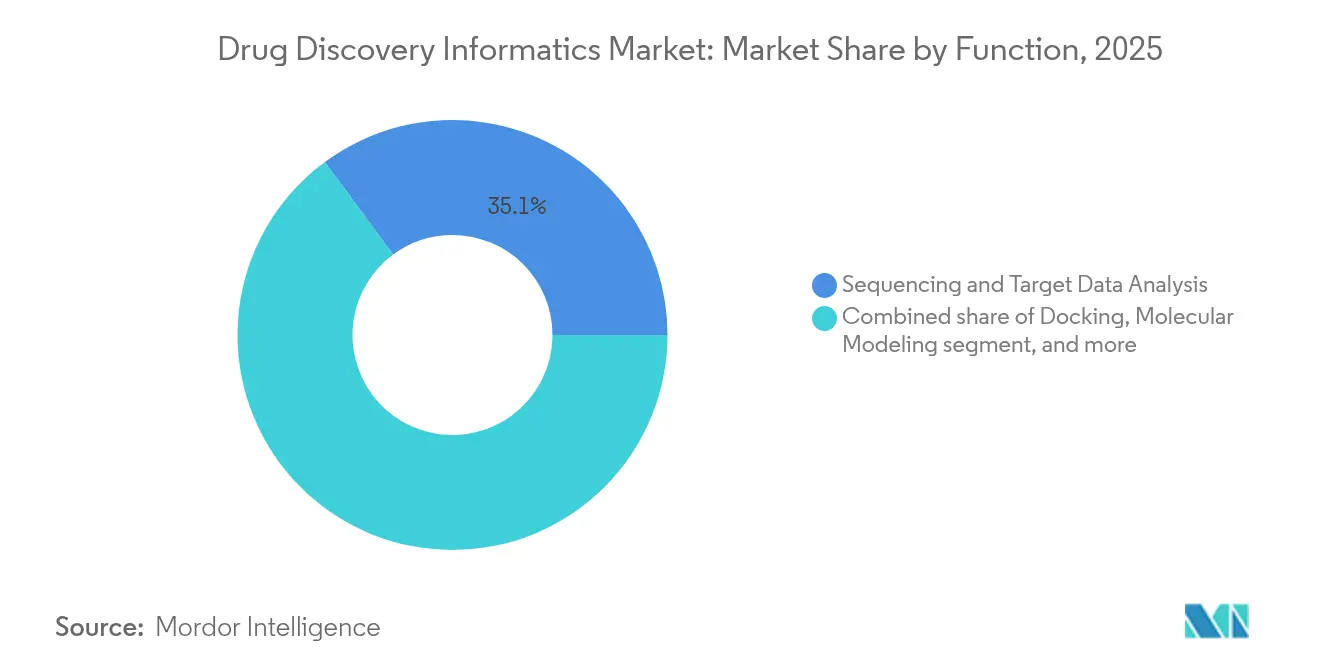
- By function, sequencing and target data analysis led with 35.12% revenue share in 2025, while molecular modeling is forecast to expand at a 13.34% CAGR through 2031.
- By end user, pharmaceutical companies held 47.85% of the drug discovery informatics market share in 2025; contract research organizations (CROs) record the fastest growth at 12.34% CAGR.
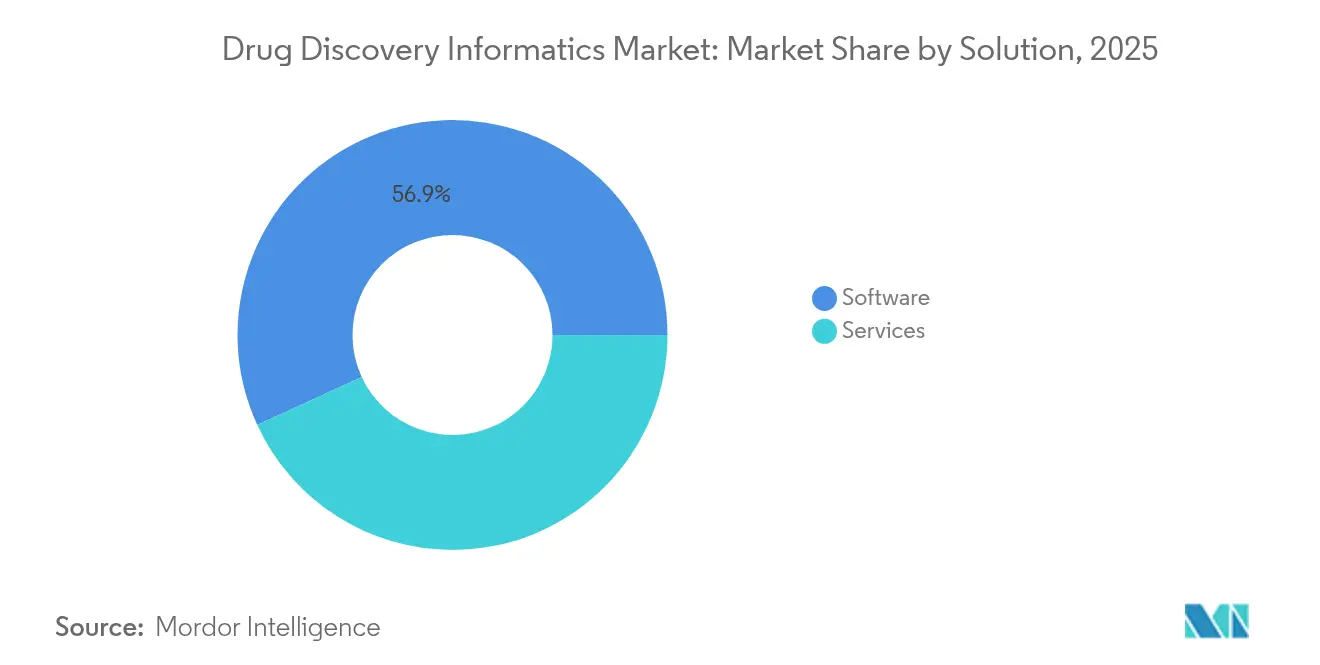
- By solution, software accounted for 56.88% share of the drug discovery informatics market size in 2025, but services are growing faster at a 14.29% CAGR.
- By workflow, discovery informatics captured 62.05% of the drug discovery informatics market share in 2025, while development informatics advances at a 15.18% CAGR.
- By geography, North America dominated with 44.76% share in 2025, whereas Asia-Pacific is projected to grow at a 13.98% CAGR through 2031.
Note: Market size and forecast figures in this report are generated using Mordor Intelligence’s proprietary estimation framework, updated with the latest available data and insights as of 2026.
Market Trends and Insights
Drivers Impact Analysis of Drug Discovery Informatics Market*
| Driver | (~) % Impact on CAGR Forecast | Geographic Relevance | Impact Timeline |
|---|---|---|---|
| Advancements In Artificial Intelligence And Machine Learning | +2.8% | North America, China | Medium term (2-4 years) |
| Growing Adoption Of Cloud-Based Informatics Platforms | +1.9% | North America, Europe | Short term (≤ 2 years) |
| Expansion Of Omics Data Generation And Integration | +1.5% | Global, strongest in APAC | Medium term (2-4 years) |
| Rising Pharmaceutical R&D Investments Globally | +2.1% | United States, Europe, Japan | Long term (≥ 4 years) |
| Government Incentives For Domestic Drug Innovation | +1.2% | China, India, South Korea | Medium term (2-4 years) |
| Increasing Demand For Precision Medicine And Personalized Therapies | +1.7% | United States, EU, expanding into APAC | Long term (≥ 4 years) |
| Source: Mordor Intelligence | |||
Advancements in Artificial Intelligence and Machine Learning
AI-powered platforms now cut lead-identification cycles by up to 50%, allowing researchers to test millions of in-silico molecules before a single synthesis run occurs. Bioptimus’ USD 76 million fundraising for foundation models exemplifies the race to generate biologically aware LLMs that can predict protein folding and disease phenotypes at scale. The FDA’s January 2025 draft guidance gives sponsors a risk-based rubric for evidencing AI model “credibility,” unlocking faster approvals for digital experimentation workflows[1]U.S. Food and Drug Administration, “Draft Guidance on Artificial Intelligence in Drug Development,” fda.gov. Pharmaceutical–tech alliances—including Eli Lilly’s collaboration with OpenAI—showcase how generative models are now embedded across discovery, preclinical, and clinical operations. Downstream, AI also shortens patient-recruitment windows by dynamically matching electronic health record cohorts to protocol-defined inclusion criteria, thereby lifting enrollment rates and lowering trial delays.
Growing Adoption of Cloud-Based Informatics Platforms
Cloud elasticity supplies on-demand high-performance computing that trims total cost of ownership for computational chemistry workloads by 60-80% compared with on-premises clusters. Novo Nordisk’s use of NVIDIA’s Gefion supercomputer illustrates how GPU-optimized infrastructure speeds training of bespoke protein-language models aimed at neurological indications. The FDA’s electronic-health-record–to–clinical-data-capture pilot proves that standardized, cloud-hosted APIs can shrink study-startup timelines by up to 60%. To mitigate IP leakage, most biopharma organizations are deploying hybrid architectures that keep sensitive datasets in virtual private clouds while bursting large simulations to public instances located in compliant regions.
Expansion of Omics Data Generation and Integration
Data from genomics, proteomics, and metabolomics is rising ten-fold every 2-3 years, driving multiscale analytics pipelines able to reveal novel therapeutic targets[2]CDISC, “Real-World Data Standards,” jmir.org. Thermo Fisher’s USD 3.1 billion acquisition of Olink spotlights the strategic importance of proteomics in next-gen biomarker discovery. New CDISC standards support cross-trial reference of real-world patient data, aiding meta-analyses that refine target-validation hypotheses. Modern analytics platforms now parse petabyte-scale datasets to surface faint molecular signatures linked to drug response, opening the door to digital biomarkers that anticipate efficacy before first dosing.
Rising Pharmaceutical R&D Investments Globally
Annual industry R&D outlays exceeded USD 250 billion in 2024, with a steep re-allocation toward informatics capabilities intended to lift success rates and curb late-stage attrition. Most large pharmacos have spun up in-house data-science divisions, and 60% plan to boost hiring of computational biologists during 2025. Government funding also contributes: the FDA’s USD 19.5 million grant to Schrödinger supports predictive toxicology that can remove animal studies from antibody programs. Taken together, higher budgets, enabling policy, and measurable return on AI investments create a durable tailwind for the drug discovery informatics market.
Restraints Impact Analysis of Drug Discovery Informatics Market*
| Restraints Impact Analysis | (~) % Impact on CAGR Forecast | Geographic Relevance | Impact Timeline |
|---|---|---|---|
| High Implementation And Licensing Costs | -1.8% | Global, most burdensome for smaller biotech firms | Short term (≤ 2 years) |
| Shortage Of Skilled Informatics Professionals | -2.1% | Acute in United States and Europe | Medium term (2-4 years) |
| Interoperability And Data Standardization Challenges | -1.5% | Global, affecting multi-site collaborations | Medium term (2-4 years) |
| Data Security And Intellectual Property Concerns | -1.3% | North America, Europe (GDPR), multinational cloud deployments | Short term (≤ 2 years) |
| Source: Mordor Intelligence | |||
High Implementation and Licensing Costs
Enterprise-grade discovery suites can require USD 500,000-2 million in upfront fees, and services often double the bill over a 3-5-year horizon, stretching lean biotech budgets. Integration work—linking ELNs, LIMS, and high-content screening systems—pushes deployment windows to 12-18 months. Even though cloud subscriptions cut capital outlay, many firms still worry about exposing proprietary lead series in shared environments, especially where patent filings are pending. Continuous release cycles also trigger frequent upgrade spending, creating a moving target for total cost-of-ownership calculations.
Shortage of Skilled Informatics Professionals
Eighty-three percent of pharmaceutical companies report difficulty hiring bioinformatics talent, and three-quarters expect gaps to widen in coming years. Multidisciplinary fluency across computer science, chemistry, and statistics is rare: fewer than 20% of graduates meet that bar. Big-tech salary premiums, sometimes 60% above pharma offers, siphon machine-learning experts away from therapeutics. To compensate, firms are funding internal academies and forging joint master’s programs with universities, but curricula often lag front-line technology by several years. Skills scarcity therefore delays platform rollouts and limits the effective scale of AI projects.
*Our forecasts treat driver/restraint impacts as directional, not additive. The impact forecasts reflect baseline growth, mix effects, and variable interactions.
Drug Discovery Informatics Market Segment Analysis
By Function:
AI-Enabled Molecular Modeling Gains SpeedSequencing and target data analysis held the largest slice of the drug discovery informatics market at 35.12% in 2025, reflecting how genomics and proteomics shape early discovery campaigns. The segment remains foundational because high-throughput sequencing feeds gigantic datasets into downstream modeling and screening pipelines. Molecular modeling, although smaller, is the fastest riser with a 13.34% CAGR as transformer-based architectures such as FeatureDock outperform classical docking tools and reduce false positives in virtual screens. The drug discovery informatics market size for molecular modeling is on track to expand rapidly as quantum-assisted simulation moves from proof-of-concept to routine use in lead optimization workflows.
AI accelerates conformer generation, free-energy perturbation, and prediction of ADMET properties, tightening feedback loops between design and synthesis. Cloud resources lower entry barriers, allowing mid-tier firms to run tens of thousands of molecular dynamics trajectories overnight. Regulatory momentum further favors in-silico toxicology, as agencies accept computational evidence to waive certain animal studies. Together, these trends keep molecular modeling a coveted competency and a magnet for venture capital.


By End User:
CROs Ride the Outsourcing WavePharmaceutical companies owned 47.85% of the drug discovery informatics market share in 2025, supported by enterprise rollouts that integrate discovery, preclinical, and early development data within a single digital thread. Collaborations such as Novartis’ USD 2.3 billion agreement with Schrödinger illustrate the scale at which big pharmas now license AI platforms. At the same time, contract research organizations exhibit a 12.34% CAGR, outpacing all other customer groups. Sponsors turn to CROs for specialized analytics, cloud hosting, and algorithm validation, allowing internal teams to focus on therapeutic biology instead of IT upkeep.
CROs enhance appeal by bundling data science, regulatory writing, and decentralized trial management under unified service agreements. This integrated approach resonates with small biotechnology clients that lack deep pockets but still require compliant informatics infrastructure. University labs and government institutes also expand platform use as funding bodies increasingly demand reproducible, shareable data. Collectively, diversified end-user demand supports a balanced revenue mix, making vendor roadmaps less susceptible to any single customer cohort.
By Solution:
Services Surge on Complexity ManagementSoftware continued to dominate with 56.88% of total 2025 revenue, encompassing electronic laboratory notebooks, cheminformatics toolkits, knowledge graphs, and AI model-building environments. Vendors strengthen portfolios through M&A—Certara’s ChemAxon purchase and Siemens’ acquisition of Dotmatics being prime examples. Still, services represent the fastest-growing category at a 14.29% CAGR as organizations seek managed deployments, algorithm customization, and continuous analytics operations.
The drug discovery informatics market size allocated to services increases because advanced solutions require skilled configuration, curated ontologies, and ongoing performance tuning to remain compliant. Outsourced managed services also help biotechs sidestep the talent crunch. Looking ahead, vendors that blend subscription software with outcome-based services—covering everything from data curation to model governance—are likely to capture disproportionate share.
By Workflow:
Development Informatics Closes the LoopDiscovery informatics generated 62.05% of drug discovery informatics market revenue in 2025. AI-driven target identification, next-best-compound recommendation, and virtual high-throughput screening together account for most computational spend. Yet development informatics shows the sharpest expansion, growing at 15.18% CAGR as electronic data capture, synthetic-control arms, and adaptive randomization bring advanced analytics into Phase I-III settings. The drug discovery informatics market size for development workflows is rising because regulators now encourage real-world evidence, decentralized monitoring, and continuous safety surveillance.
The melding of laboratory and clinic data in a single data lake enhances predictive power—compounds failing early in silico toxicity screens rarely proceed to costly human trials. Modern platforms therefore embed compliance modules (21 CFR Part 11, GxP) and audit trails to ensure continuity from bench to bedside. Together, these attributes drive strong customer interest in workflow-spanning solutions.
Geography Analysis
North America Drug Discovery Informatics Market
North America retained leadership with 44.76% of global revenue in 2025, backed by USD 100 billion-plus annual R&D outlays and clear FDA guidance for AI model reliability. Large hardware-software alliances—such as NVIDIA’s multi-partner life-sciences program announced at the 2025 JP Morgan Healthcare Conference—show that Silicon Valley and Wall Street capital continue to converge around computational discovery. Despite the region’s vast talent pool, 83% of companies still report recruiting pain points, reinforcing service-provider demand.
Europe Drug Discovery Informatics Market
Europe remains significant, propelled by EMA initiatives that standardize medicinal-product identifiers and improve cross-border data interoperability. Strong privacy rules under GDPR encourage development of privacy-preserving AI methods such as federated learning. While Brexit created parallel regulatory tracks, the United Kingdom sustains generous tax credits for AI research, helping domestic SMEs stay competitive.
APAC Drug Discovery Informatics Market
Asia-Pacific is the fastest-growing territory with a 13.98% forecast CAGR through 2031. China’s pipeline doubled to 4,391 investigational assets between 2021 and 2024, and China-to-West licensing deals hit USD 8.4 billion in 2024. Regulatory reforms curbing approval timelines and a reverse brain drain bolster local informatics demand. Japan and South Korea streamline trial governance, while India’s robust CRO sector supplies cost-efficient data-management services. Singapore’s biotech workforce is projected to grow 60% this decade, although talent gaps still widen as project counts rise.


Regulatory Landscape
Drug discovery informatics platforms increasingly operate within formal expectations for AI governance, digital evidence, and software quality, particularly when outputs support GxP decisions across discovery-to-development workflows. In the United States, the FDA has continued to operationalize digital health use in drug development, including an April 2026 Federal Register action tied to a pilot/RFI on assessing AI-enabled technologies in early-phase clinical trials, and updated Clinical Decision Support (CDS) software guidance (January 2026) clarifying when CDS functions fall under the medical device definition under the FD&C Act.
In Europe, the EMA has maintained a structured program for data, AI, and advanced analytics through its Network Data Steering Group (NDSG), adopting a 2026-2028 workplan that lays out AI activities across the medicines lifecycle. Cross-border convergence is also supported through ICH workstreams, including M15 on general principles for Model-Informed Drug Development (MIDD), which aims to support more consistent expectations for computational modeling evidence packages across regions and feeds into informatics vendor roadmaps for audit trails, model documentation, and data lineage.
Competitive Landscape
The drug discovery informatics market shows moderate consolidation. Incumbents such as Thermo Fisher, Schrödinger, and Dassault Systèmes maintain broad portfolios covering discovery through manufacturing. Their advantage lies in full-stack offerings and established validation protocols. Nevertheless, emergent AI specialists secure large venture rounds—Xaira’s USD 1 billion raise exemplifies capital availability for disruptive platforms tracxn.com.
M&A remains vigorous. Siemens paid USD 5.1 billion for Dotmatics to merge lab data capture with process control, ensuring seamless data lineage from bench chemistry to GMP production. Schrödinger’s USD 2.3 billion multi-target pact with Novartis locks in long-term software licensing plus milestone economics, highlighting the premium placed on validated physics-based simulation. Meanwhile, NVIDIA pairs GPU hardware with reference AI pipelines, courting pharma clients that need turnkey acceleration for large language models.
White spaces persist in quantum-ready molecular simulation, automated regulatory dossier generation, and AI-powered protocol amendments. Vendors that combine specialized algorithms with audit-ready compliance features stand to differentiate. Overall, rivalry is intense yet rational: leaders acquire or partner rather than risk disintermediation.
Drug Discovery Informatics Industry Leaders
Dassault Systèmes (BIOVIA)
PerkinElmer
Schrödinger, Inc.
Thermo Fisher Scientific, Inc.
Certara
- *Disclaimer: Major Players sorted in no particular order
Drug Discovery Informatics Market Companies Covered in this Report
- Thermo Fisher Scientific
- Dassault Systmes (BIOVIA)
- PerkinElmer
- Schrodinger
- Certara
- IBM
- Infosys
- Collaborative Care Diagnostics
- Genedata
- Charles River
- Jubilant Biosys
- Selvita
- Aragen Life Sciences
- Eurofins
- Zifo RnD Solutions
- Exscientia
- Benevolent AI
- Insilico Medicine
- Atomwise
- ChemAxon
- BioSolveIT

Market Opportunities and Future Outlook
Regulatory convergence and large-scale compute investments are widening the scope for discovery informatics beyond point tools into governed, end-to-end environments that can support AI-assisted decision-making. A clear opportunity centers on building AI-ready platforms that can be carried into regulated submissions, supported by the FDA-EMA joint principles on AI use in medicine development (January 2026) and the EMA data and AI work program for 2026-2028. Vendors and service providers that productize model governance (validation workflows, traceable training data, versioning, and uncertainty reporting) are being pulled earlier into discovery and into development informatics, where auditability and quality systems are non-negotiable.
Enterprise demand also points to whitespace in agentic and workflow-orchestrating capabilities that unify molecular modeling, knowledge graphs, and experimental execution systems in a single governed stack. In 2026, big-pharma and infrastructure moves reinforced this direction, including NVIDIA and Eli Lillys five-year co-innovation AI lab (backed by a shared USD 1 billion investment) and Mercks multi-year USD 1 billion partnership with Google Cloud to deploy agentic AI platforms across R&D and adjacent functions. These investments increase demand for interoperable informatics layers (ELN/LIMS integration, secure cloud execution, and standardized APIs) and for services that can implement, validate, and continuously tune AI-enabled pipelines under GxP-grade operating models.
Recent Industry Developments in Drug Discovery Informatics Market
- June 2026: Dassault Systemes enhanced the BIOVIA MARIE virtual companion with the NVIDIA BioNeMo Agent Toolkit to support agentic, multi-step drug discovery workflows. The update places BIOVIA closer to AI-orchestrated research execution, which is raising expectations for integrated informatics suites that combine natural-language interaction with traceable computational pipelines.
- May 2026: Project Farma (a PerkinElmer company) announced Gold Tier Certified Partner status with Valkit.ai to integrate an AI-powered digital validation platform. The partnership supports demand for validation and compliance tooling as discovery and development informatics workflows incorporate more automation and AI-generated outputs.
- December 2024: Schrödinger and Novartis signed a multi-target discovery collaboration valued up to USD 2.3 billion, including USD 150 million upfront, combining software access with a broad discovery pipeline agenda. The scale and structure of the agreement underscored how validated modeling and enterprise informatics platforms are being contracted as strategic R&D infrastructure, not just departmental tools.


Drug Discovery Informatics Market Report Scope and Research Methodology
Market Definition and Coverage
This market covers informatics software and related services used to support early drug discovery work, mainly by organizing, analyzing, and modeling R and D data from target selection through lead optimization and handoff to development.
Scope exclusions: We exclude general hospital and payer health IT and also exclude laboratory hardware that is sold without an informatics software or services component.
Segments Covered in This Report
- By Function
- Sequencing & Target Data Analysis
- Docking
- Molecular Modeling
- Library & Database Preparation
- Other Functions
- By End User
- Pharmaceutical Companies
- Biotechnology Companies
- Contract Research Organizations
- Other End Users
- By Solution
- Software
- Services
- By Workflow
- Discovery Informatics
- Development Informatics
- Geography
- North America
- United States
- Canada
- Mexico
- Europe
- Germany
- United Kingdom
- France
- Italy
- Spain
- Rest of Europe
- Asia-Pacific
- China
- Japan
- India
- Australia
- South Korea
- Rest of Asia-Pacific
- Middle East & Africa
- GCC
- South Africa
- Rest of Middle East & Africa
- South America
- Brazil
- Argentina
- Rest of South America
- North America
Data Sources, Market Sizing, and Validation
Desk Research
Desk work started with defining what counts as drug discovery informatics, then mapping typical workflows where these tools are purchased and used. For foundational volumes and signals, we referred to public sources such as NIH and NCBI publications, FDA drug development guidance pages, OECD health and innovation indicators, the World Bank macro series, and open-access peer reviewed journals covering computational chemistry and bioinformatics use cases.
To convert these signals into a sizing-ready view, we combined company filings and investor presentations for revenue context, and then added association and conference materials that describe adoption patterns in pharma, biotech, and CRO settings. We also used an approved paid subscription for company financials and news to cross-check reported revenues, deal announcements, and funding cycles that can shift demand timing. This list is illustrative only, and we relied on additional public and internal references to collect data, validate assumptions, and clarify open questions.
Primary Interviews and Surveys
Primary work focused on confirming what buyers treat as discovery informatics spend, and how budgets are split between software and services across pharma, biotech, and CRO teams. We spoke with a mix of commercial leaders, informatics managers, and functional heads across major regions so assumptions like adoption rates, typical contract sizes, and cloud migration pace could be checked and adjusted before finalizing the model.
Distribution of primary research fieldwork respondents
| Company type | Respondent position | Region |
|---|---|---|
| Top tier: 38% | CXOs: 16% | APAC: 43% |
| Mid tier: 44% | Functional/Unit leaders: 41% | EMEA: 31% |
| Smaller Players: 18% | Managers: 43% | Americas: 26% |
Market-Sizing & Forecasting
Sizing is built using a top-down approach where R and D spending pools and discovery workflow activity are reconstructed into an addressable informatics demand base, then translated into revenue using realistic penetration and pricing assumptions. To keep totals grounded, we ran selective bottom-up checks, such as sampling typical license or subscription pricing, triangulating service hours for implementation and support, and validating outcomes with supplier and channel feedback. Where coverage was clearly incomplete, we adjusted the gaps accordingly.
Key inputs used in the model include the share of discovery programs using in-silico methods, the growth of sequencing and target data analysis workloads, cloud versus on-premise adoption mix, average contract length and renewal patterns, and service intensity for integration and ongoing model maintenance. Forecasting is done using scenario analysis. The base case is guided by expert expectations on R and D budgets, AI-led workflow adoption, and regional investment levels, followed by sensitivity runs for slower platform migration or faster adoption in Asia-Pacific. When bottom-up evidence is thin for smaller or private providers, assumptions are capped using ranges confirmed in interviews, and the remaining tail is estimated through conservative share-of-spend logic rather than aggressive vendor roll-ups.
Data Validation & Update Cycle
Results are validated through triangulation across independent signals, and the model is stress-tested for anomalies such as unrealistic price jumps, sudden share shifts, or region totals that do not match R and D activity. If a variance is observed, we re-check the driver inputs, re-contact selected experts, and revise the specific assumption that created the mismatch before sign-off.
Each study is refreshed annually, and interim updates are made when material events occur, such as major regulation changes, sharp funding shifts, or large platform pricing moves. Before delivery, an analyst completes a final pass to ensure the numbers reflect the latest publicly visible changes and the most recent primary feedback.
Mordor Intelligence's Drug Discovery Informatics Market Estimate Compared With Other Published Estimates
Published market sizes for drug discovery informatics often do not match because different studies treat scope, the base year, and the revenue counted in services versus software in different ways. Another common reason is that growth is extrapolated from a limited set of visible price points, even when adoption rates and workflow coverage vary materially by region and end user.
Some estimates also fold in clinical trial data management or broader healthcare IT tooling that sits outside early discovery usage. In Mordor Intelligence, the market is counted around discovery-stage informatics functions such as sequencing and target data analysis, docking, molecular modeling, and library and database preparation, with revenues tied back to pharma, biotech, and CRO buying behavior rather than general clinical IT spend.
Benchmark comparison
| Source | Market Size | Gaps in Research Methodology |
|---|---|---|
| Mordor Intelligence | USD 3.27 B (2026) | |
| Global Consultancy A | USD 4.14 B (2025) | Uses a 2025 base and appears to blend broader service coverage, including in-house and outsourced models, which can pull adjacent informatics and platform services into the total. |
| Trade Journal B | USD 4.81 B (2025) | Includes categories like clinical trial data management within the definition, and the higher 2025 figure can also reflect different pricing progressions and currency timing assumptions. |
The spread in the table mainly comes from what is treated as discovery informatics versus adjacent clinical data systems, plus differences in base year choice. By keeping inputs tied to discovery workflow usage, validated adoption rates, and realistic contract pricing, the estimate is easier to trace and repeat when the model is refreshed.


Key Questions Answered in the Report
What is the current size of the drug discovery informatics market?
The market stands at USD 3.27 billion in 2026 and is projected to grow to USD 5.25 billion by 2031 at a 9.97% CAGR.
Which function generates the most revenue?
Sequencing and target data analysis contributes 35.12% of 2025 revenue, reflecting its role in genomics-driven discovery.
What geographic region is expanding the fastest?
Asia-Pacific leads growth with a forecast 13.98% CAGR, driven by China’s regulatory reforms and rising licensing activity.
Why are CROs gaining traction in this space?
Sponsors outsource specialized analytics and data management to CROs, giving the segment a 12.34% CAGR through 2031.
How does AI change drug discovery timelines?
AI-enabled platforms can compress early-stage discovery from 10-15 years to as little as 6-8 years by streamlining target identification and lead optimization.
What is the biggest barrier to adoption?
A shortage of skilled informatics professionals, cited by 83% of pharma companies, remains the primary constraint on scaling deployments.
Page last updated on:


 Your data is secure and never sold or shared.


