
Drilling Tools Market Size and Share
Market Overview
| Study Period | 2021 - 2031 |
|---|---|
| Market Size (2026) | USD 9.68 Billion |
| Market Size (2031) | USD 12.17 Billion |
| Growth Rate (2026 - 2031) | 4.68 % |
| Fastest Growing Market | Asia Pacific |
| Largest Market | North America |
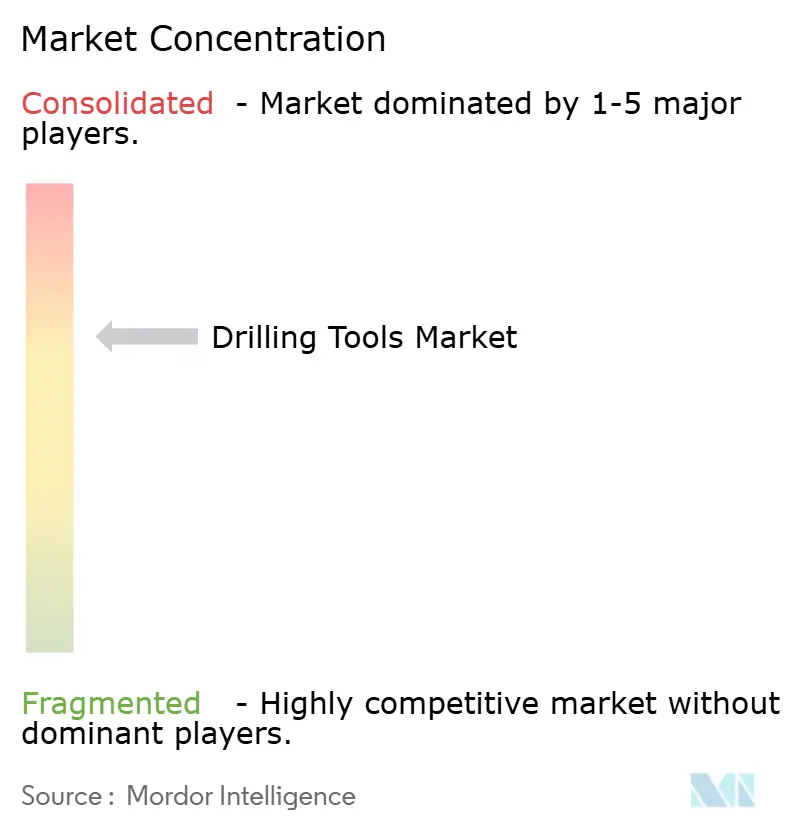
| Market Concentration | Medium |
Major Players *Disclaimer: Major Players sorted in no particular order Image © Mordor Intelligence. Reuse requires attribution under CC BY 4.0. | |
Drilling Tools Market Analysis by Mordor Intelligence
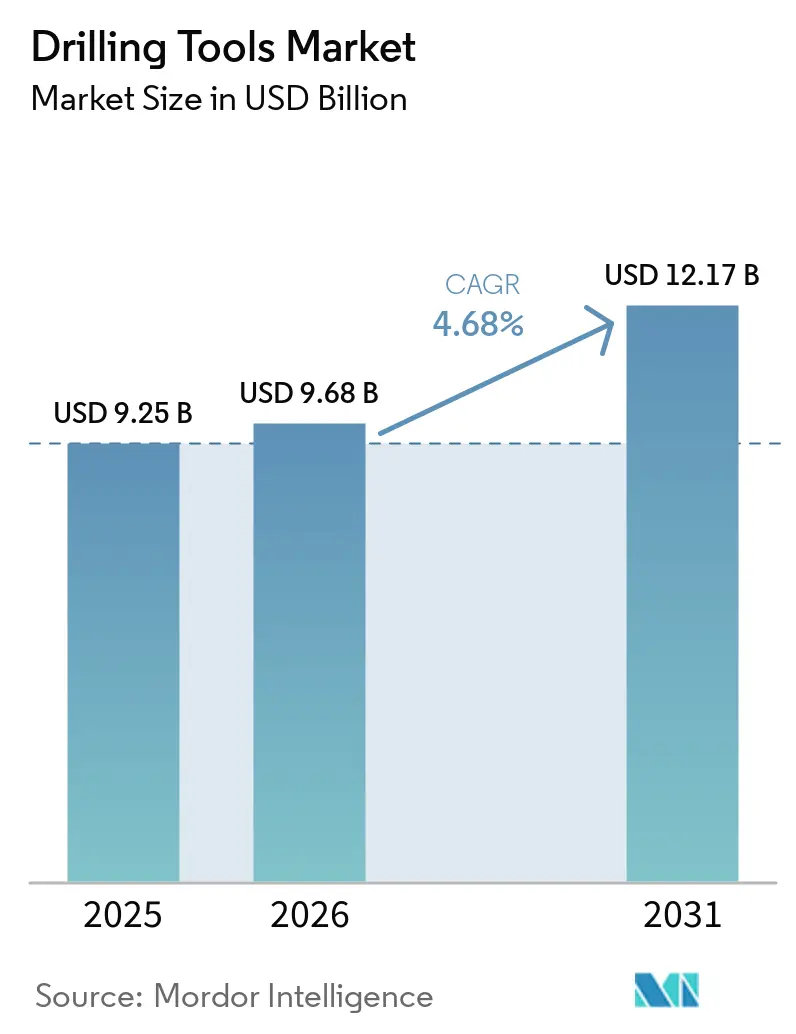
The Drilling Tools market size is expected to grow from USD 9.25 billion in 2025 to USD 9.68 billion in 2026 and is forecast to reach USD 12.17 billion by 2031 at 4.68% CAGR over 2026-2031.
The market’s forward momentum reflects selective reinvestment in high-return wells, improving access to advanced downhole technologies, and growing demand from geothermal and carbon-capture projects that diversify revenue streams away from purely hydrocarbon cycles. Operators are shifting capital toward efficiency-driven programs that shorten rig time and lift production reliability, a trend that rewards premium drill bits, rotary steerable systems, and high-specification mud motors. Momentum is further supported by final investment decisions on deep- and ultra-deepwater assets in Brazil, the US Gulf of Mexico, and West Africa, where elevated pressure and temperature ratings command purpose-built equipment. Meanwhile, supply-chain bottlenecks for specialty metals such as tungsten encourage long-term purchase agreements and foster vertical integration among service providers.
Key Report Takeaways
- By tool type, drill bits captured 66.37% of the drilling tools market share in 2025, while “Other Tools” led growth at an 7.72% CAGR through 2031.
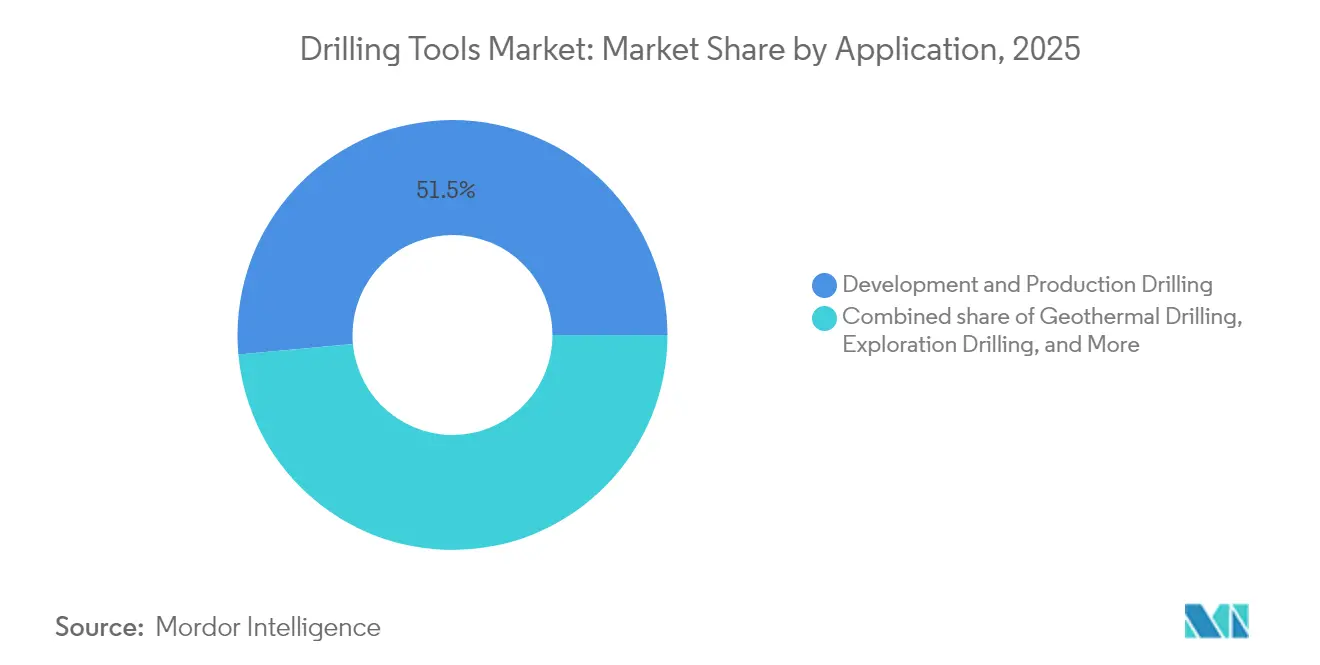
- By application, development and production drilling accounted for 51.45% of the drilling tools market size in 2025; geothermal drilling is set to expand at a 9.21% CAGR to 2031.
- By location of deployment, onshore activity held 67.92% of the drilling tools market share in 2025, whereas offshore applications are advancing at a 5.52% CAGR.
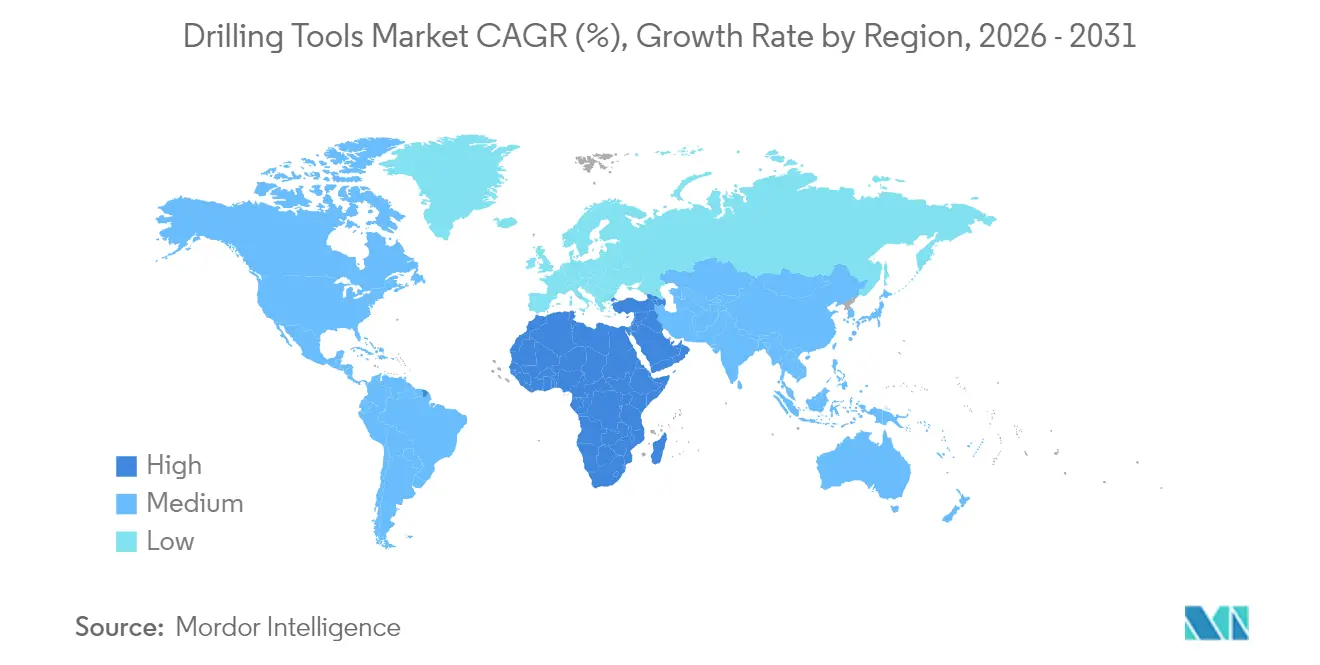
- By geography, North America generated 32.75% of the 2025 revenue, yet the Asia-Pacific region is forecast to post the fastest growth of 6.18% CAGR through 2031.
- SLB, Baker Hughes, Halliburton, NOV, and Weatherford collectively controlled more than 55% of 2024 revenue, underscoring the sector’s moderate concentration.
Note: Market size and forecast figures in this report are generated using Mordor Intelligence’s proprietary estimation framework, updated with the latest available data and insights as of 2026.
Global Drilling Tools Market Trends and Insights
Drivers Impact Analysis*
| Driver | % Impact on CAGR Forecast | Geographic Relevance | Impact Timeline |
|---|---|---|---|
| Upstream CAPEX rebound post-pandemic | +1.2% | Global, with emphasis on North America & Middle East | Medium term (2-4 years) |
| Shale well complexity driving demand for advanced drill bits | +0.8% | North America core, expanding to Argentina & Australia | Long term (≥ 4 years) |
| Expansion of deep- and ultra-deepwater projects | +0.9% | Global offshore basins, led by Brazil, West Africa, Gulf of Mexico | Long term (≥ 4 years) |
| Increasing geothermal drilling investments | +0.6% | Global, with early gains in US, Europe, Indonesia | Medium term (2-4 years) |
| Carbon-capture & storage (CCS) injection well programs | +0.4% | North America & EU regulatory frameworks | Long term (≥ 4 years) |
| Rising demand for critical-mineral exploration drilling | +0.3% | APAC core, spill-over to Australia, Canada | Medium term (2-4 years) |
| Source: Mordor Intelligence | |||
Upstream CAPEX Rebound Post-Pandemic
Global oil and gas investment is set to increase by 22% between 2025 and 2030, reversing three years of capital restraint and renewing demand for high-performance drilling tools, according to the International Energy Forum(1)International Energy Forum, “Growing Demand to Increase Upstream Oil & Gas Investment Needs 22% by 2030,” ief.org . In North America, Gulf of Mexico operators sanctioned multi-billion-dollar projects such as Chevron’s Anchor, which require 20,000 psi-rated equipment and validate the economic case for top-tier drill strings. Middle East national oil companies are likewise reviving infill drilling campaigns aimed at sustaining production quotas. This CAPEX upturn favors tools that deliver measurable rig-time savings, prompting suppliers to bundle rotary steerable systems with digital well-planning platforms. Service agreements are increasingly linking remuneration to improvements in penetration rates, a model that incentivizes continuous product upgrades. Taken together, an improving spend outlook, efficiency mandates, and contractual innovation provide sustained pull for the drilling tools market.
Shale Well Complexity Driving Demand for Advanced Drill Bits
Horizontal laterals now exceed 20,000 ft in premier US shale plays, subjecting drill bits to harsher vibration and cuttings-bed challenges AMERICAN OIL & GAS REPORTER. PDC cutters with advanced thermal-stable diamond and optimized face geometries extend run lengths under such regimes, enabling a single bit to drill multiple intervals NOV(2)NOV, “The Golden Era of Drill Bit Innovation,” nov.com . Meanwhile, AI-driven platforms, such as Halliburton’s LOGIX, analyze real-time torque data to preempt stick-slip, increasing lifting penetration rates by up to 30%. Argentina’s Vaca Muerta and Australia’s Cooper Basin replicate these design imperatives as they scale horizontal programs. Premium bit pricing, therefore, remains resilient, supporting the segment’s 32.3% revenue contribution to the drilling tools market.
Expansion of Deep- and Ultra-Deepwater Projects
The industry’s first 20,000 psi subsea systems entered service at Chevron’s Anchor and BP’s Kaskida, demonstrating commercial viability for fields once deemed uneconomic. Such projects require HP/HT drill pipes, collars, and jars certified to stringent metallurgical and fatigue limits, thereby increasing the average tool spend per well. Brazil and West Africa mirror this momentum with multi-well pre-salt developments that consolidate orders for rotary steerable systems capable of 60°/100 ft dog-leg severity. OEMs offering integrated BHAs and digital twin simulations gain a competitive edge, as operators prioritize full-package contracting to manage the risks associated with ultra-deepwater operations. The resulting premium lifts offshore’s CAGR ahead of onshore despite lower well counts.
Increasing Geothermal Drilling Investments
Enhanced geothermal systems funded by USD 200 million in US research grants adapt oil-field rotary steerable and insulated drill-pipe technologies to 300 °C reservoirs. NOV’s Phoenix PDC series and TK-340TC coatings mitigate thermal degradation and chloride corrosion, thereby lengthening bit life in superhot formations(3)Halliburton, “LOGIX®: precision drilling through intelligent automation,” halliburton.com . Europe supports similar pilots under the EU Innovation Fund, while Indonesia aims to add 17 GW of geothermal capacity by 2030. The crossover enables tool vendors to repurpose existing supply chains, thereby buffering revenue against fluctuations in hydrocarbon prices. As geothermal wells deepen beyond 15,000 ft, demand centers on high-torque mud motors and high-temperature elastomers, expanding the addressable drilling tools market.
Restraints Impact Analysis*
| Restraint | % Impact on CAGR Forecast | Geographic Relevance | Impact Timeline |
|---|---|---|---|
| Volatile crude-oil prices impacting drilling budgets | -0.7% | Global, with highest sensitivity in North America shale | Short term (≤ 2 years) |
| Stringent environmental regulations on drilling operations | -0.5% | North America & EU, expanding to other regions | Medium term (2-4 years) |
| Supply-chain disruptions for high-spec drill pipes & bits | -0.4% | Global, with critical bottlenecks in Asia-Pacific manufacturing | Short term (≤ 2 years) |
| Skilled-labor shortage for digital drilling systems | -0.3% | Global, most acute in North America & Middle East | Medium term (2-4 years) |
| Source: Mordor Intelligence | |||
Volatile Crude-Oil Prices Impacting Drilling Budgets
WTI spot prices slipped below USD 70/bbl in early 2025, prompting US independents to trim their planned spending to USD 60.1 billion, 4% lower than the prior guidance. When budgets tighten, non-core exploration wells are deferred, curbing near-term orders for standard drill pipe and collars. Conversely, operators continue to pay premiums for tools that shorten cycle times, sustaining top-end demand even in price troughs. Suppliers that diversify into geothermal or CCS projects gain partial insulation from oil-price swings, tempering but not eliminating the drag on the drilling tools market.
Stringent Environmental Regulations on Drilling Operations
EPA methane rules are expected to impose USD 22-31 billion in compliance costs through 2038, obliging operators to upgrade pneumatic controls and deploy continuous monitoring equipment. On the rig side, higher scrutiny extends to well control and HP/HT safety cases, adding engineering documentation and third-party certification requirements that lengthen procurement cycles. Smaller operators may exit marginal fields, reducing tool demand, while larger firms negotiate bundled contracts with service majors to manage compliance. This shift accelerates market consolidation, yet restricts overall well counts, thereby trimming the growth trajectory of the drilling tools market.
*Our forecasts treat driver/restraint impacts as directional, not additive. The impact forecasts reflect baseline growth, mix effects, and variable interactions.
Segment Analysis
By Tool Type: Premium Technologies Drive Market Evolution
Drill bits generated USD 6.14 billion in 2025, equal to 66.37% of the drilling tools market size, underscoring their pivotal role in well economics. Continued adoption of thermally stable PDC cutters and real-time imaging at the bit face allows operators to achieve single-run curves in interbedded formations, reducing connection time and NPT. OEMs capture price premiums by packaging bits with digital advisory software that recommends rotary speed and weight-on-bit adjustments in real time.
The “Other Tools” category includes jars, shock subs, mud motors, and rotary steerable systems, which will outpace overall growth at an 7.72% CAGR. Halliburton’s iCruise and Baker Hughes’ AutoTrak generate dynamic steering corrections that cut slide-rotate cycles, while SLB’s Suppressor dampening tool mitigates torsional oscillation by more than 60%. That performance edge justifies higher day rates, despite budget pressure, and anchors robust revenue expansion for full-suite providers.
By Application: Energy Transition Reshapes Demand Patterns
Development and production drilling accounted for 51.45% of 2025 revenue, reflecting operators’ focus on brownfield optimization and resource recovery. Multi-well pad designs and batch drilling intensify tool utilization, driving steady orders for drill pipe, reamers, downhole drilling tools, and vibration absorbers. Exploration drilling, although cyclical, gains strategic importance in frontier deepwater blocks sanctioned by major oil companies seeking to renew their portfolios.
Geothermal wells represent the fastest floor-count addition, advancing at a 9.21% CAGR as governments fund superhot rock pilots. Carbon-capture injection wells form a smaller but fast-scaling niche, where directional profiles require abrasion-resistant bottom-hole assemblies capable of handling dense CO₂ muds. The positive spill-over broadens the customer mix and offsets oil price-driven volatility, adding resilience to the drilling tools market.


By Location of Deployment: Offshore Premium Drives Value Creation
Onshore operations accounted for 67.92% of the 2025 turnover, driven by high-volume unconventional programs in the US, Canada, Argentina, and China. Standardized rig fleets, lower logistics costs, and shorter cycle times characterize this segment, tilting procurement toward cost-competitive drill strings and motors. Yet offshore activity, particularly ultra-deepwater, delivers stronger margin capture.
Offshore growth at 5.52% CAGR hinges on HP/HT discoveries such as Ballymore and Trion, where each well can require USD 20 million worth of specialized tools and services. Complex geomechanics drive the adoption of wired drill-pipe telemetry and remote steering consoles, allowing real-time trajectory correction from onshore centers. Suppliers with integrated surface-to-seabed portfolios hold a structural advantage, deepening the gulf between tier-one and regional competitors.
By End-User: Operator Consolidation Reshapes Procurement Patterns
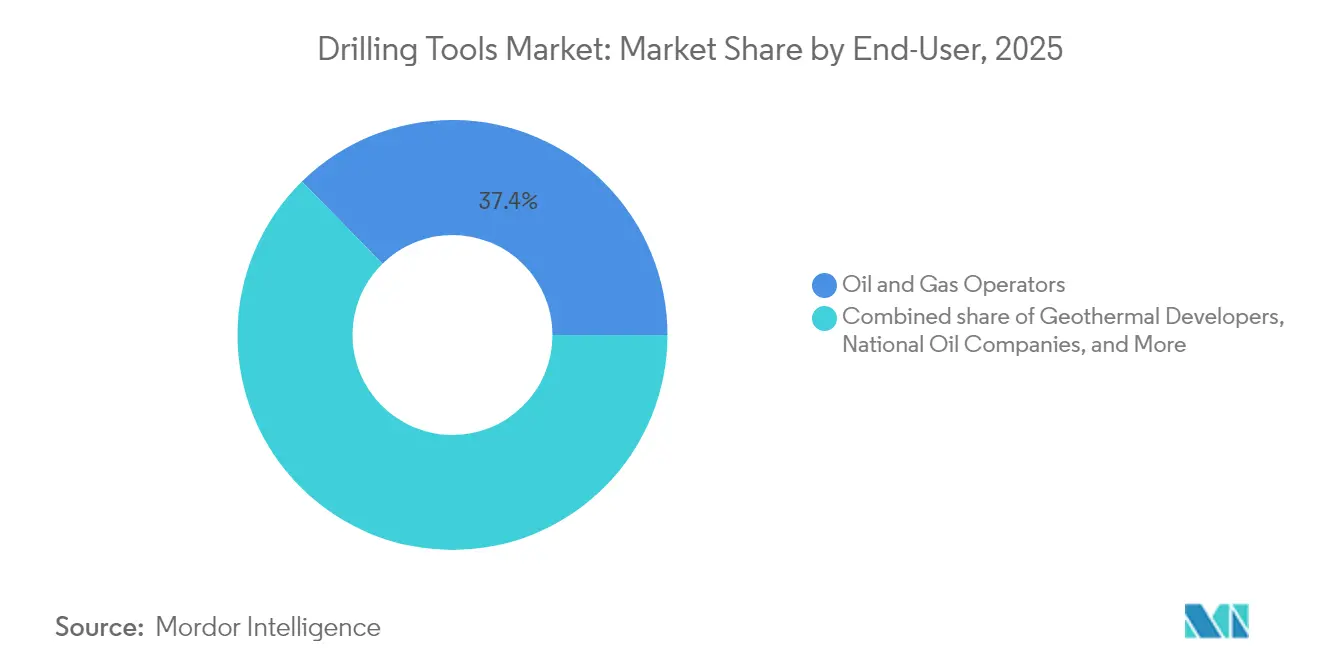
Oil and gas operators remained the single largest buyer group at 37.35% in 2025. Supermajors leverage global master service agreements to secure fleet-wide access to rotary steerable systems and high-torque motors, bundling them with analytics subscriptions that guarantee performance benchmarks. National oil companies, notably those in the Middle East, pursue local content targets by co-manufacturing drill bits and collars under technology transfer arrangements.
Geothermal developers are registering the quickest expansion, with a 9.21% CAGR driven by policy incentives and the technical similarity between geothermal and unconventional oil drilling. Independent E&Ps are increasingly outsourcing tool management to drilling contractors under lump-sum, turnkey deals, which is shrinking spot-purchase volumes but lengthening contract tenures. Mining exploration firms, though still niche, employ oil-field coring tools to accelerate critical-mineral discovery programs, adding breadth to the drilling tools market demand base.
Geography Analysis
North America generated 32.75% of 2025 revenue, driven by record Permian horizontal footage and resilient Gulf of Mexico deepwater campaigns. The region’s advanced logistics and digital drilling ecosystem keeps equipment utilization high, even as capital discipline tempers rig additions. Federal methane rules and state-level setback regulations pressure smaller operators, yet the supermajors’ adoption of triple-frac completion methods is increasing drill-pipe torque requirements and sustaining premium-tool demand.
Asia-Pacific leads growth at a 6.18% CAGR through 2031. China’s national firms drive deep onshore targets in the Tarim and Sichuan basins, demanding abrasion-resistant PDC bits and high-temperature mud motors. Indonesia pursues geothermal baseload projects, while Australia’s critical-mineral exploration creates a fresh pull for coring bits compatible with HP hard-rock drilling. Collectively, these trends expand the drilling tools market footprint across both hydrocarbon and renewable value chains.
Europe, anchored by Norway and the UK, maintains tooling demand via brownfield tie-backs and a surge of CCS wells under the North Sea Transition Deal. The Middle East and Africa capitalize on low breakeven reservoirs and state-sponsored capacity expansions, though political risk occasionally delays purchase orders. South America, buoyed by Brazil’s pre-salt, channels large integrated contracts to SLB and Baker Hughes, concentrating market share within a handful of vendors. The combined regional dynamics underscore a gradual shift from volume-led to efficiency-led purchasing.

Regulatory Landscape
In the United States offshore market, the Bureau of Safety and Environmental Enforcement (BSEE) updated its Point-in-Time Inspection/Certification guidance for well operations and equipment (B-PINCs) in January 2026, reinforcing compliance expectations tied to API Standard 53 (4th Edition) for well control equipment and related inspection and documentation practices under 30 CFR 250.730. In February 2026, BSEE also issued a proposed rule (RIN 1014-AA63) to revise elements of the 2023 Blowout Preventer Systems and Well Control Rule, clarifying submittal requirements for failure data, failure analysis timeframes, and independent third-party qualification recordkeeping. This in turn affects qualification and lifecycle documentation for critical well control hardware used in offshore drilling programs.
At the standards level, API updates continue to set manufacturing, inspection, and certification pathways for drilling and well-servicing equipment. API moved forward with an effective update associated with the API Monogram Program for API Specification 8C (6th Edition) covering drilling and production hoisting equipment, and API published API STD 16WS:2026 covering well control systems for well servicing. Taken together, these actions reinforce a compliance environment where tool and equipment suppliers compete on certified quality systems, traceable materials and inspection records, and the ability to support operator audits for both offshore and onshore applications.
Competitive Landscape
Consolidation defines the current competitive storyline. SLB’s USD 7.1 billion purchase of ChampionX fortifies its chemicals and artificial-lift offering, adding surface-production synergies to the downhole portfolio. Helmerich & Payne’s USD 1.97 billion acquisition of KCA Deutag quadruples its Middle East rig count, granting direct control over tool specification and procurement cycles. These moves illustrate how scale and integration help absorb R&D costs for AI-enabled drilling systems.
Technological differentiation remains the principal moat. Halliburton and Sekal achieved the world’s first automated on-bottom drilling system, uniting LOGIX and Drilltronics for closed-loop drilling parameter control. Baker Hughes invests in electrified surface units that cut emissions while synchronizing with high-speed downhole telemetry. NOV prioritizes high-temperature materials science to unlock geothermal revenues, collaborating with research labs on the stability of carbide matrices.
Disruption potential exists from software-native entrants developing reservoir-aware advisory engines, although safety certification requirements and incumbent bundling hamper acceptance. Regional toolsmiths coexist by specializing in reamers, stabilizers, or coring gear for hard-rock minerals; however, rising metallurgical standards are raising the capital barrier. The sector’s preference for performance-based contracts ultimately biases market share toward firms delivering integrated hardware-software packages.
Drilling Tools Industry Leaders
NOV Inc.
Halliburton Company
Schlumberger Limited
Baker Hughes Company
Weatherford International Plc
- *Disclaimer: Major Players sorted in no particular order

Market Opportunities and Future Outlook
A whitespace is opening around integrated, closed-loop drilling execution that links downhole sensing, subsurface interpretation, and surface rig control, which increases the value of premium directional drilling tools and digital-enabled bottom-hole assemblies. In March 2026, ExxonMobil and Halliburton reported a fully closed-loop automated geological well placement milestone offshore Guyana, using Halliburton LOGIX orchestration with EarthStar ultra-deep resistivity and Sekal DrillTronics. The reported combination of at-the-bit measurements and automation is positioned to reduce course corrections and nonproductive time, supporting demand for higher-spec drill bits, rotary steerable systems, telemetry, and software-connected tools that can function as part of an integrated control loop rather than standalone hardware.
Opportunities also appear in large, integrated well construction and multi-year development programs where service companies package drilling tools with managed services and performance-based delivery. In July 2026, Halliburton reported an industry-first deployment of integrated closed-loop rig automation with managed pressure drilling on a deepwater exploration well offshore Indonesia with Eni, highlighting the premium placed on tool reliability and real-time control in complex offshore wells. In the Middle East, Aramco awarded Halliburton a multi-year contract for integrated stimulation and completion services for unconventional gas development in the Jafurah basin, including deployment of an intelligent fracturing platform starting in Q3 2026, which supports sustained tool utilization across pads and favors suppliers that can standardize bits, motors, and steering assemblies at scale. Separately, ADNOC Drilling delivered its first AI-enabled, fully automated walking island rig (AD-300) for deployment on offshore UAE artificial islands in July 2026, reinforcing procurement pull for automation-ready drilling systems and toolstrings aligned with high-efficiency, high-repeatability drilling campaigns.
Recent Industry Developments
- July 2026: Halliburton and Eni completed an industry-first deployment of integrated closed-loop rig automation combined with managed pressure drilling (MPD) on a deepwater exploration well offshore Indonesia using Halliburton's LOGIX automation platform. The integration of automation with pressure management elevates requirements for high-spec directional tools, telemetry, and reliable bit performance in complex offshore wells. It also reinforces the shift toward bundled, digitally orchestrated well construction execution models.
- May 2026: Equinor awarded drilling and well services contracts on the Norwegian shelf to Baker Hughes, Halliburton, and SLB. The awards support continued demand for premium drilling tools and well services aligned with North Sea operating standards and mature-field efficiency programs. Securing multi-company contract coverage also strengthens the role of large service providers in standardizing tool selection and digital workflows across campaigns.
- July 2025: SLB completed its USD 7.1 billion acquisition of ChampionX, expanding its production-focused portfolio alongside its drilling and reservoir offering. The combined platform increases the ability to bundle chemicals, artificial lift, and digital capabilities with drilling-related services across the well lifecycle. Greater integration can influence procurement by favoring consolidated contracts and integrated service delivery across both drilling and production phases.


Research Methodology Framework and Report Scope
Market Definition and Coverage
This market covers revenue generated from drilling tools used to drill, steer, and stabilize a well during onshore and offshore drilling activity, including tool families that sit in the drill string and bottomhole assembly.
Scope exclusions: We exclude drilling rigs, drilling fluids and chemicals, cementing services, and non-tool consumables that are not sold as drilling tools.
Segmentation Overview
- By Tool Type
- Drill Bit
- Drill Pipe
- Drill Collar
- Drill Reamer and Stabilizer
- Drill Swivel
- Other Tools (Jars, Shock Subs, Mud Motors, RSS)
- By Application
- Exploration Drilling
- Development and Production Drilling
- Workover and Well Intervention
- Geothermal Drilling
- CCS and Injection Wells
- By Location of Deployment
- Onshore
- Offshore
- By End-User
- Oil and Gas Operators
- National Oil Companies
- Independent EandP
- Drilling Contractors
- Geothermal Developers
- Mining Exploration Firms
- By Geography
- North America
- United States
- Canada
- Mexico
- Europe
- Germany
- United Kingdom
- Norway
- Russia
- Rest of Europe
- Asia-Pacific
- China
- India
- South Korea
- ASEAN Countries
- Rest of Asia-Pacific
- South America
- Brazil
- Argentina
- Colombia
- Rest of South America
- Middle East and Africa
- Saudi Arabia
- United Arab Emirates
- Qatar
- South Africa
- Egypt
- Nigeria
- Rest of Middle East and Africa
- North America
Data Sources, Market Sizing, and Validation
Desk Research
Desk work was used to anchor the demand environment and the operational reality behind tool consumption. We referenced public series such as the U.S. Energy Information Administration for upstream activity context, the U.S. Bureau of Labor Statistics for cost and wage inflation signals, and the World Bank and IMF for macro indicators that influence drilling spend.
We also reviewed non-paywalled publications and datasets from sources such as the International Energy Agency for energy outlooks, and national petroleum regulators and statistics offices for well counts and directional drilling adoption where available. For supplier-side guardrails, we used company annual reports, investor presentations, and reputable press releases to understand product mix and exposure to drilling cycles. A paid subscription for company financials and intelligence was used selectively to standardize revenue splits and track ownership changes. This list is illustrative, and many other public and paid sources were also referred to for collection, cross-checks, and clarification.
Primary Interviews and Surveys
Primary discussions were run with a mix of tool manufacturers, drilling service specialists, and procurement or drilling engineering users to test assumptions on tool run rates, replacement cycles, and pricing moves. Since this is a global market, inputs were checked across the main drilling basins so differences between onshore intensity and offshore tool specifications could be reflected in the final model.
Distribution of primary research fieldwork respondents
| Company type | Respondent position | Region |
|---|---|---|
| Top tier: 28% | CXOs: 13% | APAC: 47% |
| Mid tier: 57% | Functional/Unit leaders: 42% | EMEA: 33% |
| Smaller Players: 15% | Managers: 45% | Americas: 20% |
Market-Sizing & Forecasting
The core model starts from a top-down build where drilling activity and well construction needs are converted into a realistic demand pool for tools by location type and well complexity, and then translated into value through average selling price ranges. To keep totals grounded, we also used selective bottom-up approximations, such as supplier revenue sanity checks, sampled ASP multiplied by implied tool volumes, and channel conversations that helped adjust for underreported categories.
Key inputs included active rig and well activity direction, the share of horizontal and extended-reach wells (which changes tool intensity), offshore versus onshore mix, typical bottomhole assembly configuration trends (including steering and stabilization needs), and price movement driven by steel and manufacturing costs. Where direct volume signals were patchy, gaps were handled by using proxy indicators like drilling spend trends and utilization patterns from primary feedback, and then back-testing the implied tool-per-well ranges. For forecasting, scenario analysis was applied with a base case that aligns drilling outlook expectations to tool intensity and pricing, and then upside and downside cases were built around oil and gas capex sensitivity and offshore project timing.
Data Validation & Update Cycle
Outputs were checked against independent signals like drilling activity shifts, offshore project sanction news, and reported upstream capex direction, and then reviewed for sudden jumps that do not match the operating cycle. When variances showed up, assumptions were revisited and, if needed, follow-up calls were triggered to confirm whether the issue came from scope overlap, price timing, or a demand proxy.
Before sign-off, the model goes through a multi-step analyst review where calculations, conversions, and year alignment are rechecked. Reports are refreshed annually, and interim updates are made when material events occur that can move tool demand or pricing. Right before delivery, a fresh pass is done so clients receive the latest updated view available.
Mordor Intelligence's Drilling Tools Market Sizing Compared With Other Published Estimates
Published market values for drilling tools can look different even when the same broad label is used, because authors vary the tool list, the activity proxy, and the year used for pricing and currency conversion. Differences also come from how offshore tools and directional drilling intensity are treated, and whether adjacent drilling equipment is pulled into the number.
Some published estimates fold in a wider set of drilling equipment and services, or they assume a faster price progression without linking it back to tool replacement and well complexity. When that broader scope is used, Mordor Intelligence only counts defined tool categories (such as drill bits, drill pipe, drill collars, reamers and stabilizers, swivels, and specified other tools like jars, shock subs, mud motors, and RSS) and ties the demand build to drilling applications including geothermal, workover and well intervention, and CCS and injection wells.
Benchmark comparison
| Source | Market Size | Gaps in Research Methodology |
|---|---|---|
| Mordor Intelligence | USD 9.25 B (2025) | |
| Global Consultancy A | USD 7.85 B (2023) | Uses a different base year and forecast window, and the sizing can skew lower if tool intensity per well is averaged broadly without separating offshore specifications and higher-intensity horizontal wells. |
| Industry Publisher B | USD 9.96 B (2025) | Shows inconsistent base-year reporting across sections and applies a higher growth path, which can overstate totals when price and volume assumptions are not reconciled back to drilling activity and replacement cycles. |
The spread across the three figures mainly reflects year alignment, category inclusion, and how tool intensity is linked to drilling activity. By keeping the tool list explicit and cross-checking assumptions against drilling cycle signals and primary feedback, our final number stays traceable to clear inputs and repeatable steps, so users can adapt the same logic to their own planning cases.


Key Questions Answered in the Report
What is the current value of the drilling tools market?
The drilling tools market size was USD 9.68 billion in 2026 and is forecast to reach USD 12.17 billion by 2031 on a 4.68% CAGR trajectory.
Which region leads global sales?
North America held 32.75% of 2025 revenue due to high unconventional activity and deepwater projects.
Which application segment is expanding fastest?
Geothermal drilling is projected to register the quickest 9.21% CAGR through 2031 as energy-transition funding accelerates.
How will offshore demand evolve?
Offshore wells especially ultra-deepwater are expected to grow at a 5.52% CAGR, supported by HP/HT project sanctions in Brazil, the Gulf of Mexico, and West Africa.
What technologies are shaping competitive advantage?
AI-enabled rotary steerable systems, at-bit imaging, and high-temperature PDC bits are central to performance-based contracting and margin expansion.
How do environmental rules affect tool demand?
Stricter methane and HP/HT regulations increase compliance costs, prompting operators to adopt premium, low-emission drilling tools that meet new safety standards.
Page last updated on:


 Your data is secure and never sold or shared.


