
Dragon Fruit Market Size and Share
Dragon Fruit Market Analysis by Mordor Intelligence
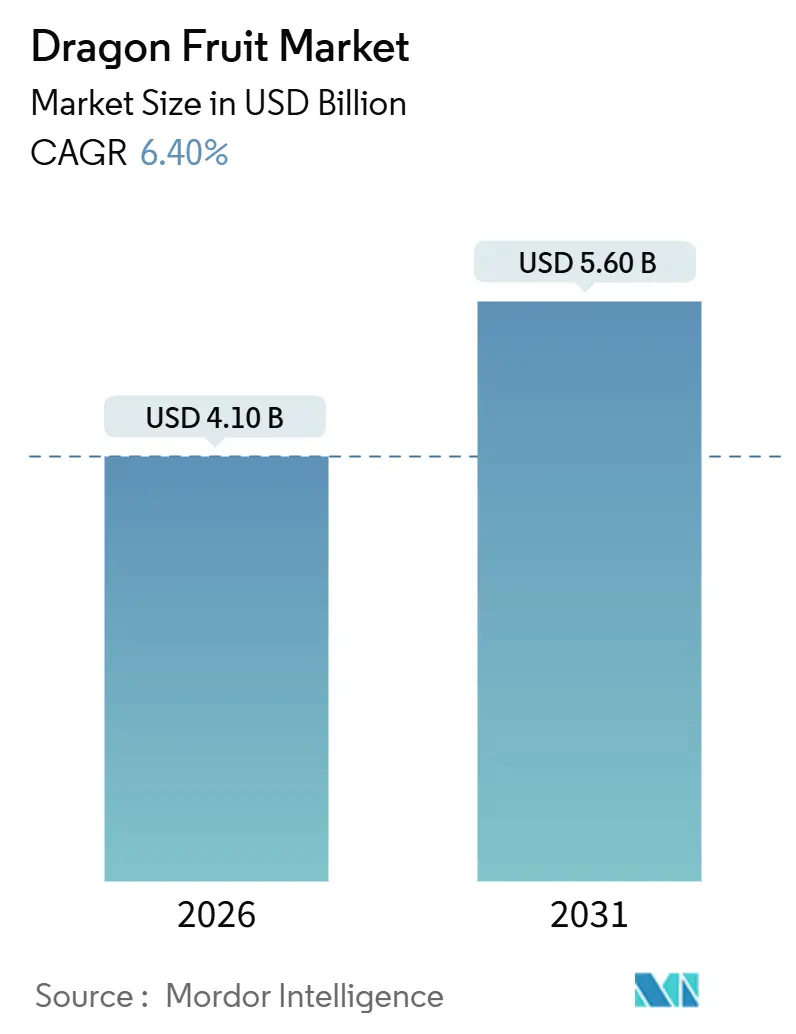
The dragon fruit market size reached USD 4.1 billion in 2026 and is projected to touch USD 5.6 billion by 2031, registering a 6.4% CAGR over the period. Demand growth is rooted in the adoption of functional foods, the keto trend, and improved off-season supply from Asia-Pacific growers who utilize light-emitting diode systems to stabilize year-round volumes[1]Source: Asia Pacific Food and Fertilizer Technology Center, “Dragon Fruit Production and Marketing in Vietnam,” ap.fftc.org.tw. The Asia-Pacific region remains the anchor of consumption, though its dominance masks a strategic vulnerability, as China’s orchard expansion reduces Vietnamese volumes and forces a pivot toward premium-certified exports. North America leads growth as retailers expand their exotic-snack assortments, and free-trade pacts reduce tariffs for South American suppliers. Controlled-atmosphere logistics, blockchain traceability, and solar-powered irrigation further support cost reductions and premium positioning. Competitive intensity is therefore migrating from volume-driven commodity flows to certification-based differentiation, where traceability, residue compliance, and branding shape access to high-margin channels.
Key Report Takeaways
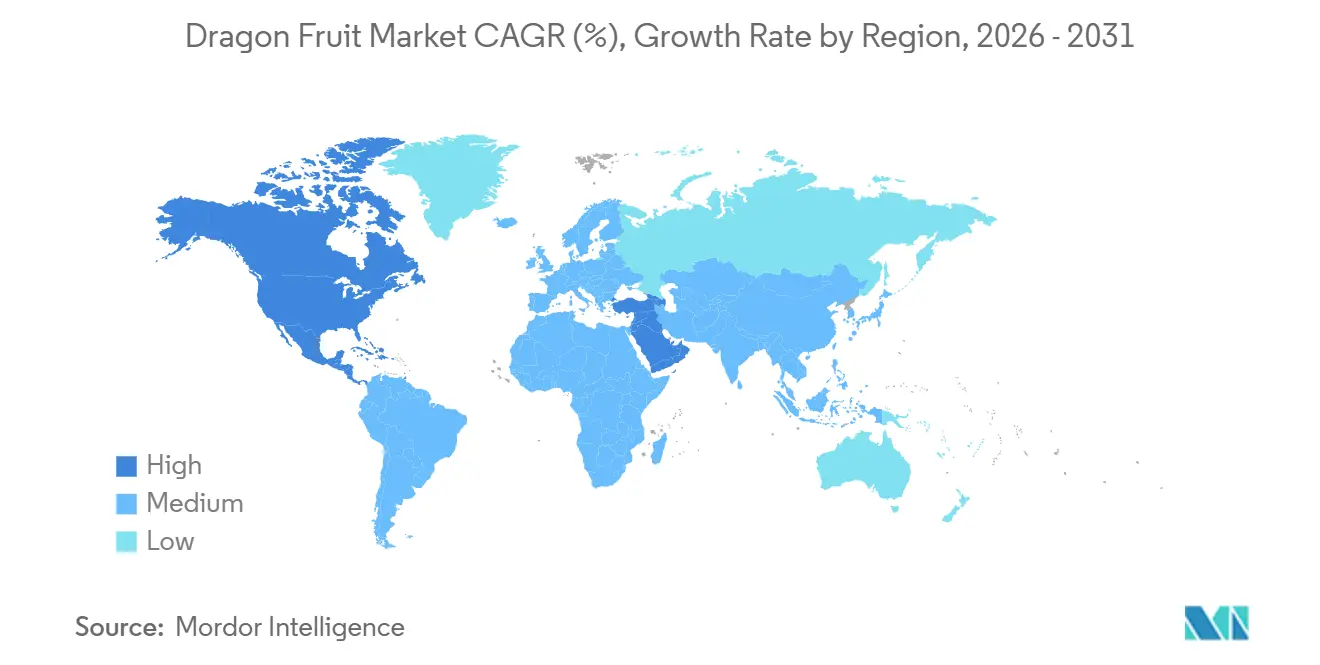
By region, Asia-Pacific captured 83.0% of the 2025 consumption volume of the dragon fruit market share, while North America is projected to expand at a 6.7% CAGR through 2031.
Note: Market size and forecast figures in this report are generated using Mordor Intelligence’s proprietary estimation framework, updated with the latest available data and insights as of January 2026.
Global Dragon Fruit Market Trends and Insights
Drivers Impact Analysis*
| Driver | (~) % Impact on CAGR Forecast | Geographic Relevance | Impact Timeline |
|---|---|---|---|
| China’s off-season lighting systems stabilize year-round yields | +1.0% | China, Vietnam, Thailand, spill-over to South America | Medium term (2-4 years) |
| Functional-food demand for low-carbohydrate exotic fruit | +1.2% | North America and Europe, rising in Middle East | Medium term (2-4 years) |
| Free-trade agreements cutting tariffs for major producers | +0.8% | Global, strongest on Asia-Pacific to Europe lanes | Long term (≥ 4 years) |
| GlobalG.A.P. and blockchain traceability premiums | +0.9% | Vietnam, Peru, Ecuador, and Thailand | Medium term (2-4 years) |
| Controlled-atmosphere sea freight lowers logistics cost | +0.7% | Long-haul routes from Asia-Pacific to North America and Europe | Medium term (2-4 years) |
| Solar-powered on-farm irrigation trims operating cost | +0.5% | Middle East, Africa, arid South America, and Southeast Asia | Long term (≥ 4 years) |
| Source: Mordor Intelligence | |||
China’s Off-Season Lighting Systems Stabilize Year-Round Yields
Low-cost light-emitting diode (LED) rigs in Vietnam and China enable 11 to 12 annual harvest cycles, reducing supply volatility and price swings of 30% to 40%. Vietnam's Rang Dong supplies 5 to 9-watt LED modules, reducing energy costs to 0.04 USD per kilowatt-hour and supporting off-season harvests. Huawei's 2024 Guangxi study demonstrated a 22% yield increase and 18% energy savings using smart LED controllers[2]Source: Huawei Technologies Co., Ltd., “Smart Agriculture Dragon Fruit Case Study,” huawei.com. LEDs, which offer 25% higher photosynthetic efficiency and 30% longer bulb life than compact fluorescent lamps (CFLs), are accelerating adoption across Southeast Asia, benefiting large-scale exporters over smallholders.
Functional-Food Demand for Low-Carbohydrate Exotic Fruit
Keto-diet followers and diabetic consumers in the United States and Europe are driving demand for low-sugar exotic fruit products. Dragon fruit, with 9 to 14 grams of carbohydrates per 100 grams, is favored over mango (15 grams) and pineapple (13 grams). In 2024, United States retail chains expanded dragon fruit shelf space by 20%, while Ecuador's Terrafertil brand reported dragon fruit products accounted for 30% of exotic-fruit sales. European Union imports have shown a rising trade value, with GlobalG.A.P. certification and stricter residue limits favoring certified exporters from South America and Southeast Asia.
Free-Trade Agreements Cutting Tariffs for Major Producers
The European Union (EU)-Vietnam Free Trade Agreement (EVFTA), effective August 2020, eliminated 99% of tariffs on fresh fruit, reducing the cost of Vietnamese dragon fruit in Rotterdam by 8-10%. Comprehensive and Progressive Agreement for Trans-Pacific Partnership (CPTPP) members, including Vietnam, Peru, and Mexico, benefit from tariff reductions, which opens high-margin markets such as Japan. Colombia's trade agreement with the EU, fully implemented in 2013, removed tariffs on tropical fruit, boosting Colombian yellow pitahaya exports. Peru's agreements with the United States and the EU provide duty-free access, enabling exporters to increase shipments significantly. The compliance with phytosanitary standards and pesticide-residue limits remains a key challenge for many exporters.
Controlled-Atmosphere Sea Freight Lowers Logistics Cost
Maersk's controlled-atmosphere (CA) container trials extended cherry shelf life to 35 days and reduced per-kilogram freight costs by 40% on long-haul routes, prompting dragon fruit exporters to adopt similar protocols[3]Source: Maersk, “Controlled Atmosphere Containers Extend Shelf Life,” maersk.com. Compagnie Maritime d'Affrètement - Compagnie Générale Maritime (CMA CGM) recommends 7 to 8 degrees Celsius for red-fleshed dragon fruit and 5 degrees Celsius for yellow pitahaya, with 20 to 25 cubic meters per hour (CMH) ventilation and controlled-atmosphere (CA) conditions of 2 to 4% oxygen and 6 to 8% carbon dioxide. Ecuador's Ecuaexotics and Social Deal tested sea-freight protocols for pitahaya shipments to the European Union (EU), aiming to replace air freight while maintaining fruit quality.
Restraints Impact Analysis*
| Restraint | (~) % Impact on CAGR Forecast | Geographic Relevance | Impact Timeline |
|---|---|---|---|
| Price Volatility Caused by Oversupply During Peak Harvest Seasons | −1.0% | China, Vietnam, and Thailand | Short term (≤ 2 years) |
| Stricter pesticide-residue tests in European Union and China | −0.6% | Europe and China import markets | Short term (≤ 2 years) |
| Brown-spot disease outbreaks under climate volatility | −0.4% | Vietnam, Thailand, China, emerging in South America | Medium term (2-4 years) |
| Cold-chain gaps causing post-harvest losses | −0.5% | Africa, South America, smaller Asia-Pacific producers | Medium term (2-4 years) |
| Source: Mordor Intelligence | |||
Stricter Pesticide-Residue Tests in European Union and China
The European Union (EU) increased testing rates for pitahaya imports from Vietnam to 10% of consignments under Regulation 2019/1793 Annex I and II, citing heightened pesticide-residue risks. Over 5% of shipments in 2024 were rejected for exceeding maximum residue limits (MRLs). Germany's LIDL and Kaufland supermarket chains set internal MRLs at 33.3% of EU statutory limits, creating challenges for exporters. China's Decrees 248 and 249, implemented in late 2021, require Vietnamese exporters to adopt clean production practices, secure certifications, and implement traceability systems. Exporters failing to invest in integrated pest management (IPM) face rejection risks.
Brown-Spot Disease Outbreaks Under Climate Volatility
Neoscytalidium dimidiatum, the pathogen responsible for brown-spot disease, caused yield losses of 15% to 30% in Binh Thuan Province, Vietnam, affecting approximately 50% of the cultivated area[4]Source: Centre for Agriculture and Bioscience International, “Neoscytalidium dimidiatum,” cabi.org. The disease spreads through wounds, contaminated pruning tools, irrigation water, and infected planting material, leading to brown spots, stem canker, fruit rot, and dieback. Severe outbreaks reduce yields by 30% to 40%, with treatment costs of USD 200 to USD 400 per hectare per season. Management includes cultural practices, chemical controls like copper-based fungicides (e.g., copper hydroxide, copper oxychloride), and biological controls using Trichoderma species and Bacillus subtilis. Resistant varieties are still in the pipeline, so growers rely on costly fungicide rotations.
*Our forecasts treat driver/restraint impacts as directional, not additive. The impact forecasts reflect baseline growth, mix effects, and variable interactions.
Geography Analysis
The Asia-Pacific region accounts for 83.0% of the dragon fruit market consumption volume in 2025, with mainland China and Vietnam leading the way. To maintain its position, Vietnam is focusing on the adoption of certifications and market diversification, particularly targeting India and the Gulf states. The region represents the largest demand base, with China consuming over 2 million metric tons annually and Vietnam exporting more than 1 million metric tons per year. Declining Chinese imports have prompted Vietnamese exporters to explore alternative markets, including the United States, India, and the United Arab Emirates.
North America is the fastest-growing region for dragon fruit, with the market projected to grow at a 6.7% CAGR through 2031. The United States accounts for approximately 60% of Ecuador's dragon fruit exports, while domestic cultivation in California, Florida, and Hawaii remains limited to less than 400 hectares, underscoring the need for additional supply. Certification requirements for mainstream retail chains are driving demand for traceable dragon fruit from South America.
South America utilizes free-trade agreements to access European and North American markets. Ecuador's December 2025 launch of the Centro de Empaque Fitosanitario de Pitahaya in Palora is projected to enhance cold-chain infrastructure for 2,260 growers. In Peru, the Piura and Amazonas regions now feature GlobalG.A.P.-certified orchards, primarily exporting to Spain, the United Kingdom, and the Netherlands. Growth in the Middle East depends on the United Arab Emirates serving as a re-export hub, while Africa's contribution remains constrained by inadequate refrigeration and high airfreight costs.


Regulatory Landscape
Dragon fruit trade is governed by origin-specific phytosanitary entry rules and residue compliance in destination markets. In the United States, access is managed under USDA APHIS commodity import requirements (7 CFR 319.56-4) and country approvals that specify measures such as import permits, phytosanitary certificates, and prescribed pre-export treatments (for example, irradiation or vapor heat treatment depending on the pathway). In January 2026, the US EPA published a Federal Register tolerance action that set a 3 ppm residue tolerance for permethrin on dragon fruit (pitaya), reinforcing the need for exporters and packers to monitor pesticide-label alignment with import tolerances.
In Europe, pesticide maximum residue limits are set under Regulation (EC) No 396/2005 and reflected in the EU Pesticides Database. These MRLs function as a key non-tariff barrier alongside heightened border controls applied to certain origins. Regional harmonization is also progressing: ASEAN member states have adopted intra-ASEAN phytosanitary guidelines for dragon fruit that standardize inspection and certification approaches to facilitate cross-border flows within Southeast Asia, while still requiring exporters to align practices with stricter retailer and government checks in premium import markets.
Value Chain Analysis
The dragon fruit value chain runs from input suppliers (planting material, trellising and irrigation systems, crop protection, and off-season lighting) to growers, collectors/traders, packhouses, logistics providers, and end channels across fresh retail and foodservice, plus processing into frozen chunks, purees, powders, and concentrates. In key Asian origins, smallholders dominate production, which makes aggregation and standardization central for cooperatives and traders. Forward-buying and spot procurement remain common, which can compress farmgate pricing during peak harvests.
Food safety, traceability, and phytosanitary readiness increasingly shift to the packhouse stage, where exporters implement grading, residue-control protocols, pre-cooling, and documentation to meet destination requirements. Bottlenecks concentrate in compliance and cold chain execution, including inconsistent on-farm practices, gaps in electronic recordkeeping, and limited pre-cooling or temperature-controlled handling that raise post-harvest losses and rejection risk on long-haul routes. The chain is also moving toward more integrated models that combine certified orchards, centralized packing, and controlled-atmosphere sea freight to extend shelf life. Capability investments are widening upstream as well, including commercialization of canker-tolerant cultivars in 2026 through Plant & Food Research and partners, and scaling export-enabled production systems in Vietnam supported by growing-area codes and licensed processing facilities.
Competitive Landscape
The supply base is fragmented in Asia but more consolidated in South America. Vietnamese cooperatives, such as Van Thanh Cooperative, aggregate smallholder output across 150 hectares of GlobalG.A.P. plots to secure off-season contracts that pay VND 8,000 per kilogram (approximately USD 0.32 per kilogram). In Peru, Camposol S.A. integrated orchard, packing, and logistics operations, gaining GlobalG.A.P. certification in Q4 2024 and targeting premium European slots.
Technology adoption plays a significant role in shaping competitive advantages. Huawei Technologies Co., Ltd. has introduced smart light-emitting diode (LED) control systems that enhance yields and reduce energy consumption, providing early adopters with a cost advantage. Hoang Phat Fruit Company Limited installed hot-steam pathogen-reduction lines to meet China’s stricter phytosanitary decrees, safeguarding market access where rivals face rejections.
Logistics providers such as A.P. Moller-Maersk A/S have optimized controlled-atmosphere technologies, extending shelf life to 35 days. This development allows sea freight to replace more expensive air freight options. Certification agencies such as Control Union and GlobalG.A.P. issue Risk Assessment on Social Practice add-ons that European and North American buyers increasingly mandate. Producers that lack these credentials remain confined to wholesale channels and price-driven trade.
Market Opportunities and Future Outlook
Certification-led access is a clear opportunity area as retailers and import authorities raise the bar on residue compliance and traceability. GlobalG.A.P. remains the primary gateway credential for premium channels in the EU, Japan, the United States, Australia, South Korea, and New Zealand, and exporters are building the operational stack around it, including packhouse upgrades, documented integrated pest management, and verified chain-of-custody. This emphasis is reinforced through market-access programs and standards: in May 2026, Vietnam reported intensified food safety and compliance measures to sustain EU access for dragon fruit, and China has also pushed traceability and clean production compliance through its import-decree framework.
Digitized traceability and climate-smart production systems create additional room for differentiation, especially for suppliers trying to replace commodity flows with verified quality and sustainability claims. Projects in Binh Thuan, Vietnam, show active deployment of electronic traceability tools, including QR-code based tracking and carbon-footprint related data capture, that support eco-friendly positioning and buyer audits. On the supply expansion side, new production corridors are being cultivated through standards and government programs, including India where production reached 53.72 thousand metric tonnes in 2023-2024 on 14.51 thousand hectares. Growth also depends on standardized production protocols, such as Hainan’s provincial standard DB46/T 597-2023, which covers production, management, and traceability across the dragon fruit industry chain.
Recent Industry Developments
- July 2026: Saint Lucia opened its first dragon fruit nursery in Union, Castries, through the Ministry of Agriculture in collaboration with the Taiwan Technical Mission. The nursery is designed to supply farmers with quality planting material and accelerate commercial cultivation, reducing reliance on ad hoc sourcing. This strengthens upstream availability of uniform seedlings and improves the feasibility of scaled production and organized marketing.
- April 2026: Frieda’s expanded its Ecuadorian grower network for its US dragon fruit program to improve supply consistency amid freight and cost volatility. Broadening the supplier base supports steadier retail fulfillment and helps maintain year-round assortment for US buyers. The move also increases the strategic importance of Ecuador as a counter-seasonal origin for North American demand.
- July 2025: The Uttar Pradesh state government in India announced plans to expand dragon fruit cultivation by an additional 200 hectares and establish a support center to improve production and quality. The initiative aims to raise farmer participation in commercial pitaya farming and standardize cultivation support. It adds a structured pathway for domestic supply development and organized extension services in a fast-scaling producing country.


Research Methodology Framework and Report Scope
Market Definition and Coverage
For this study, the dragon fruit market is defined as the commercial value generated from dragon fruit sold as fresh fruit and as directly processed forms that are still traded as dragon fruit products (for example frozen pieces, puree, or powder), across producing and consuming countries.
Scope exclusions: We exclude downstream derivatives where dragon fruit is only a minor input, such as nutraceutical isolates, cosmetic actives, and oil-extract ingredients.
Segmentation Overview
- By Geography
- North America
- United States
- Production Analysis (Area Harvested, Yield, and Production Volume)
- Consumption Analysis (Consumption Value and Volume)
- Import Market Analysis (Import Value, Volume, and Key Supplying Markets)
- Export Market Analysis (Export Value, Volume, and Key Destination Markets)
- Wholesale Price Trend Analysis and Forecast
- Regulatory Framework
- List of Key Players
- Logistics and Infrastructure
- Seasonality Analysis
- Canada
- Production Analysis (Area Harvested, Yield, and Production Volume)
- Consumption Analysis (Consumption Value and Volume)
- Import Market Analysis (Import Value, Volume, and Key Supplying Markets)
- Export Market Analysis (Export Value, Volume, and Key Destination Markets)
- Wholesale Price Trend Analysis and Forecast
- Regulatory Framework
- List of Key Players
- Logistics and Infrastructure
- Seasonality Analysis
- Mexico
- Production Analysis (Area Harvested, Yield, and Production Volume)
- Consumption Analysis (Consumption Value and Volume)
- Import Market Analysis (Import Value, Volume, and Key Supplying Markets)
- Export Market Analysis (Export Value, Volume, and Key Destination Markets)
- Wholesale Price Trend Analysis and Forecast
- Regulatory Framework
- List of Key Players
- Logistics and Infrastructure
- Seasonality Analysis
- United States
- South America
- Ecuador
- Production Analysis (Area Harvested, Yield, and Production Volume)
- Consumption Analysis (Consumption Value and Volume)
- Import Market Analysis (Import Value, Volume, and Key Supplying Markets)
- Export Market Analysis (Export Value, Volume, and Key Destination Markets)
- Wholesale Price Trend Analysis and Forecast
- Regulatory Framework
- List of Key Players
- Logistics and Infrastructure
- Seasonality Analysis
- Colombia
- Production Analysis (Area Harvested, Yield, and Production Volume)
- Consumption Analysis (Consumption Value and Volume)
- Import Market Analysis (Import Value, Volume, and Key Supplying Markets)
- Export Market Analysis (Export Value, Volume, and Key Destination Markets)
- Wholesale Price Trend Analysis and Forecast
- Regulatory Framework
- List of Key Players
- Logistics and Infrastructure
- Seasonality Analysis
- Peru
- Production Analysis (Area Harvested, Yield, and Production Volume)
- Consumption Analysis (Consumption Value and Volume)
- Import Market Analysis (Import Value, Volume, and Key Supplying Markets)
- Export Market Analysis (Export Value, Volume, and Key Destination Markets)
- Wholesale Price Trend Analysis and Forecast
- Regulatory Framework
- List of Key Players
- Logistics and Infrastructure
- Seasonality Analysis
- Ecuador
- Europe
- Germany
- Production Analysis (Area Harvested, Yield, and Production Volume)
- Consumption Analysis (Consumption Value and Volume)
- Import Market Analysis (Import Value, Volume, and Key Supplying Markets)
- Export Market Analysis (Export Value, Volume, and Key Destination Markets)
- Wholesale Price Trend Analysis and Forecast
- Regulatory Framework
- List of Key Players
- Logistics and Infrastructure
- Seasonality Analysis
- Netherlands
- Production Analysis (Area Harvested, Yield, and Production Volume)
- Consumption Analysis (Consumption Value and Volume)
- Import Market Analysis (Import Value, Volume, and Key Supplying Markets)
- Export Market Analysis (Export Value, Volume, and Key Destination Markets)
- Wholesale Price Trend Analysis and Forecast
- Regulatory Framework
- List of Key Players
- Logistics and Infrastructure
- Seasonality Analysis
- Spain
- Production Analysis (Area Harvested, Yield, and Production Volume)
- Consumption Analysis (Consumption Value and Volume)
- Import Market Analysis (Import Value, Volume, and Key Supplying Markets)
- Export Market Analysis (Export Value, Volume, and Key Destination Markets)
- Wholesale Price Trend Analysis and Forecast
- Regulatory Framework
- List of Key Players
- Logistics and Infrastructure
- Seasonality Analysis
- Germany
- Asia-Pacific
- China
- Production Analysis (Area Harvested, Yield, and Production Volume)
- Consumption Analysis (Consumption Value and Volume)
- Import Market Analysis (Import Value, Volume, and Key Supplying Markets)
- Export Market Analysis (Export Value, Volume, and Key Destination Markets)
- Wholesale Price Trend Analysis and Forecast
- Regulatory Framework
- List of Key Players
- Logistics and Infrastructure
- Seasonality Analysis
- Vietnam
- Production Analysis (Area Harvested, Yield, and Production Volume)
- Consumption Analysis (Consumption Value and Volume)
- Import Market Analysis (Import Value, Volume, and Key Supplying Markets)
- Export Market Analysis (Export Value, Volume, and Key Destination Markets)
- Wholesale Price Trend Analysis and Forecast
- Regulatory Framework
- List of Key Players
- Logistics and Infrastructure
- Seasonality Analysis
- Thailand
- Production Analysis (Area Harvested, Yield, and Production Volume)
- Consumption Analysis (Consumption Value and Volume)
- Import Market Analysis (Import Value, Volume, and Key Supplying Markets)
- Export Market Analysis (Export Value, Volume, and Key Destination Markets)
- Wholesale Price Trend Analysis and Forecast
- Regulatory Framework
- List of Key Players
- Logistics and Infrastructure
- Seasonality Analysis
- India
- Production Analysis (Area Harvested, Yield, and Production Volume)
- Consumption Analysis (Consumption Value and Volume)
- Import Market Analysis (Import Value, Volume, and Key Supplying Markets)
- Export Market Analysis (Export Value, Volume, and Key Destination Markets)
- Wholesale Price Trend Analysis and Forecast
- Regulatory Framework
- List of Key Players
- Logistics and Infrastructure
- Seasonality Analysis
- China
- Middle East
- Saudi Arabia
- Production Analysis (Area Harvested, Yield, and Production Volume)
- Consumption Analysis (Consumption Value and Volume)
- Import Market Analysis (Import Value, Volume, and Key Supplying Markets)
- Export Market Analysis (Export Value, Volume, and Key Destination Markets)
- Wholesale Price Trend Analysis and Forecast
- Regulatory Framework
- List of Key Players
- Logistics and Infrastructure
- Seasonality Analysis
- United Arab Emirates
- Production Analysis (Area Harvested, Yield, and Production Volume)
- Consumption Analysis (Consumption Value and Volume)
- Import Market Analysis (Import Value, Volume, and Key Supplying Markets)
- Export Market Analysis (Export Value, Volume, and Key Destination Markets)
- Wholesale Price Trend Analysis and Forecast
- Regulatory Framework
- List of Key Players
- Logistics and Infrastructure
- Seasonality Analysis
- Saudi Arabia
- Africa
- South Africa
- Production Analysis (Area Harvested, Yield, and Production Volume)
- Consumption Analysis (Consumption Value and Volume)
- Import Market Analysis (Import Value, Volume, and Key Supplying Markets)
- Export Market Analysis (Export Value, Volume, and Key Destination Markets)
- Wholesale Price Trend Analysis and Forecast
- Regulatory Framework
- List of Key Players
- Logistics and Infrastructure
- Seasonality Analysis
- Egypt
- Production Analysis (Area Harvested, Yield, and Production Volume)
- Consumption Analysis (Consumption Value and Volume)
- Import Market Analysis (Import Value, Volume, and Key Supplying Markets)
- Export Market Analysis (Export Value, Volume, and Key Destination Markets)
- Wholesale Price Trend Analysis and Forecast
- Regulatory Framework
- List of Key Players
- Logistics and Infrastructure
- Seasonality Analysis
- South Africa
- North America
Data Sources, Market Sizing, and Validation
Desk Research
Desk work started by mapping the global supply and trade footprint for dragon fruit, and then checking which public data series can be used repeatedly each year. Sources we leaned on include national agriculture ministries and statistics offices, FAOSTAT for crop and area indicators, UN Comtrade for import and export flows, and USDA and similar agencies for horticulture updates and price commentary.
We also reviewed customs notifications, food safety and plant health rules from official regulators, and peer reviewed papers that discuss yields, post-harvest losses, and cultivation economics. To ground the company side, we used annual reports, investor presentations, and credible press releases, and we supplemented financial context with a paid subscription that helps with company financials and news screening. This list is not exhaustive, and many other public sources were used to collect data, validate it, and clarify open questions during the analysis.
Primary Interviews and Surveys
Primary work was used to verify real-world pricing and volume movement because dragon fruit pricing can shift quickly by season and by export acceptance. We spoke with growers, packers, exporters, importers, distributors, and buyers for retail and food service across APAC, EMEA, and the Americas to challenge assumptions from desk inputs and align on practical conversion factors between farmgate, wholesale, and landed pricing.
Distribution of primary research fieldwork respondents
| Company type | Respondent position | Region |
|---|---|---|
| Top tier: 33% | CXOs: 13% | APAC: 45% |
| Mid tier: 51% | Functional/Unit leaders: 29% | EMEA: 31% |
| Smaller Players: 16% | Managers: 58% | Americas: 24% |
Market-Sizing & Forecasting
Sizing was built using a top-down approach where production, harvested area, yield benchmarks, and trade balances were used to reconstruct a realistic consumption pool by region, which is then converted to value using observed price bands. When the market shifts during the year, we adjust for seasonality, post-harvest loss, and the share that is sold into export-grade versus domestic channels, before the final value is calculated.
Those totals were then checked with selective bottom-up approximations, such as sampling exporter and importer throughput, applying typical pack sizes, and using a price per kilogram range validated by interviews for key routes. Inputs that materially move the model include export volumes by origin and destination, domestic wholesale price movement, yield trends from cultivation practices, cold-chain penetration for premium fruit, and the share of processed formats like frozen pieces or puree in trade. For forecasting, we relied on scenario analysis supported by expert consensus on supply expansion, demand pull in health-oriented retail, and expected price normalization, and then we stress-tested outcomes using a simple regression on trade volumes and price trends. Where direct data is thin, gaps are handled through conservative proxying from similar producing belts and by cross-checking with adjacent fruit trade signals, and then corrected through follow-up interviews.
Data Validation & Update Cycle
Outputs were validated through multiple checks that look for mismatches between value and volume signals, unusual price jumps, and region totals that do not reconcile with trade and production direction. When a variance is identified, the assumptions are revisited, interview notes are rechecked, and respondents are re-contacted if the gap is still not explained.
Before sign-off, another analyst reviews the model logic, the unit conversions, and the key inputs that drive the final number. The report is refreshed annually, and interim updates are triggered when there are material events such as major crop disruptions, import rule changes, or sharp freight and price shifts. Right before delivery, a final pass is completed so clients receive the latest updated view.
Mordor Intelligence's Dragon Fruit Market Size Versus Other Published Estimates
Published market sizes for dragon fruit often do not line up because each study chooses its own boundary for what counts as the market, the year used as the starting point, and the way price is converted across countries.
The table shows a wide spread mainly because some sources anchor the market closer to farmgate trade of fresh fruit only, while others blend in broader value capture, including directly processed formats and different price points by channel and region.
Benchmark comparison
| Source | Market Size | Gaps in Research Methodology |
|---|---|---|
| Mordor Intelligence | USD 4.10 B (2026) | |
| Industry Publisher A | USD 0.53 B (2024) | Uses an earlier base year and appears to keep the scope tighter around fresh-fruit value, with limited visibility into wholesale-to-retail price uplift and processed dragon fruit trade forms. |
| Advisory Firm B | USD 0.68 B (2024) | Reports current value on a different time window and does not clearly separate farmgate versus landed pricing, which can understate value in import-heavy regions and omit some directly processed formats. |
The table points to how much the inclusion of traded processed forms and the price point used can change the final number, and in Mordor Intelligence's model the market is counted as fresh dragon fruit plus directly processed products like frozen pieces, puree, and powder that still trade as dragon fruit items. By keeping the steps tied to production, trade, loss, and realistic price bands, the result stays traceable and can be repeated when new season and trade data becomes available.


Key Questions Answered in the Report
What is the projected global value of the dragon fruit market in 2031?
The dragon fruit market is forecast to reach USD 5.6 billion by 2031, reflecting a 6.4% CAGR during 2026-2031.
Which region currently holds the largest share of dragon fruit consumption?
Asia-Pacific accounts for 83.0% of global consumption, led by China’s domestic demand that exceeds 2 million metric tons annually.
Why is North America the fastest-growing destination for dragon fruit?
Keto and functional-food trends, plus tariff-free access for certified South American suppliers, underpin a 6.7% CAGR through 2031.
How are logistics innovations affecting the supply chain?
Controlled-atmosphere containers now extend shelf life to 35 days and cut sea-freight costs by 40.0%, enabling longer routes without air transport.
What certifications are most critical for dragon fruit exporters?
GlobalG.A.P. and blockchain-based traceability are becoming mandatory for European and North American retailers, unlocking 12.0-15.0% price premiums for compliant growers.
Page last updated on:


 Your data is secure and never sold or shared.


