
DLP Projector Market Size and Share
Market Overview
| Study Period | 2020 - 2031 |
|---|---|
| Market Size (2026) | USD 6.69 Billion |
| Market Size (2031) | USD 9.49 Billion |
| Growth Rate (2026 - 2031) | 7.24% CAGR |
| Fastest Growing Market | Middle East |
| Largest Market | Asia Pacific |
| Market Concentration | Medium |
Major Players *Disclaimer: Major Players sorted in no particular order Image © Mordor Intelligence. Reuse requires attribution under CC BY 4.0. | |
DLP Projector Market Analysis by Mordor Intelligence
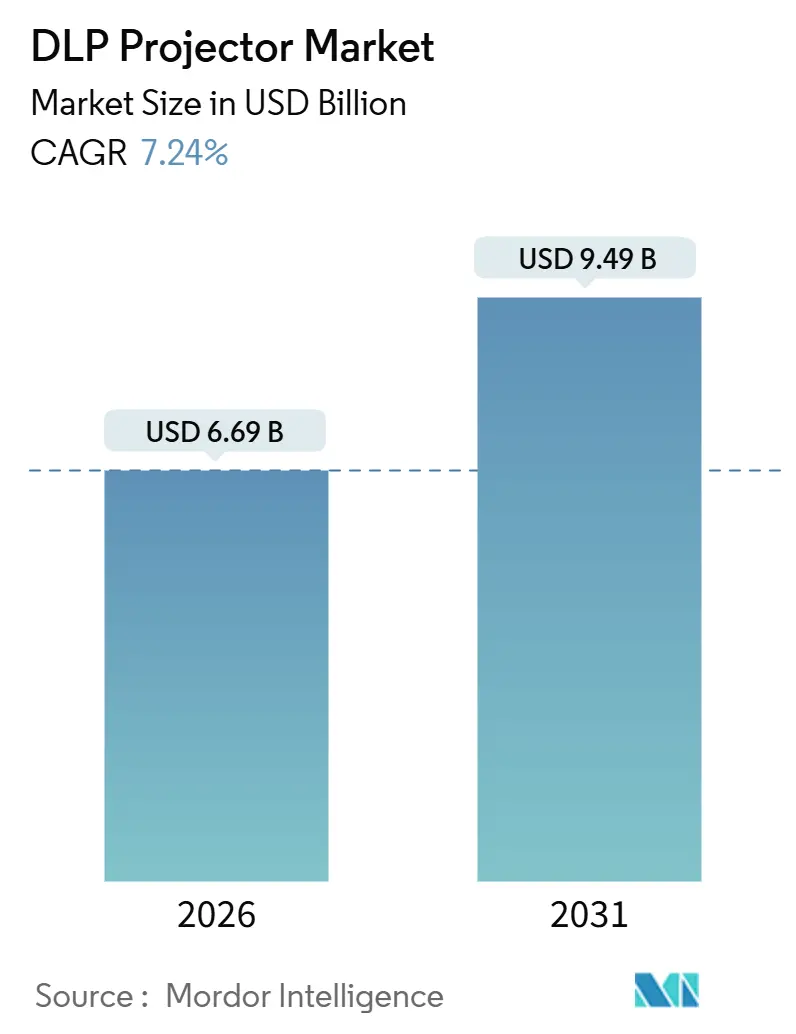
The DLP Projector Market or Digital Light Processing Projector Market size is estimated at USD 6.69 billion in 2026 and is projected to reach USD 9.49 billion by 2031, representing a 7.24% CAGR over the forecast period. Momentum is anchored in a migration from lamp to laser light sources, a trend that cuts maintenance costs and opens high-brightness use cases across cinema, education, corporate, and large-venue environments. Adoption is also supported by defense programs that fund simulation suites and by retailers that use projection mapping to create immersive shopping experiences. Unit shipments are relatively flat in mature regions, yet average selling prices rise as buyers favor long-lifecycle models with luminous flux above 10,000 lumens. Competitive pressure remains intense because Texas Instruments supplies a common chipset foundation, enabling both global brands and value-focused Chinese entrants to introduce 4K devices at a price point below USD 1,500. Substitution risk from large flat-panel displays persists, but the DLP projector market differentiates itself through screen sizes exceeding 100 inches, flexible throw ratios, and rapid replacement cycles for lamp installations.
Key Report Takeaways
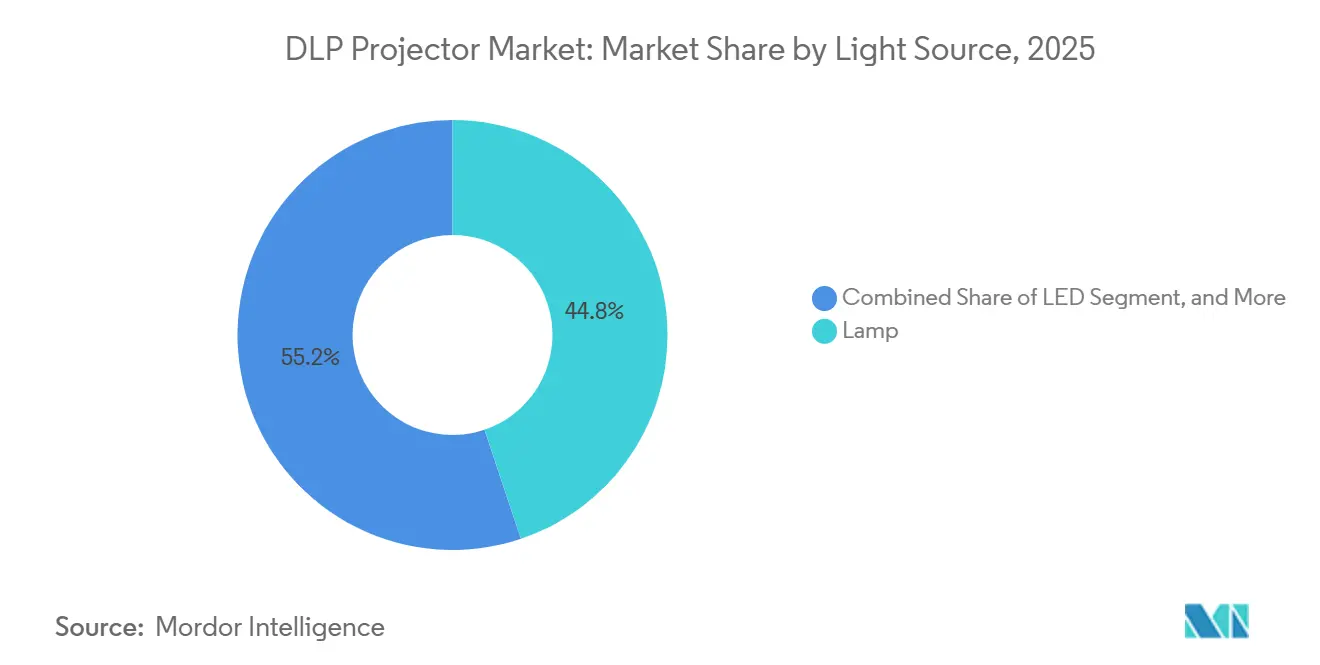
- By light source, lamp-based systems held 44.83% of the DLP Projector Market or Digital Light Processing Projector Market share in 2025, while laser variants are forecast to expand at a 7.67% CAGR through 2031.
- By chip model, the one-chip configuration captured 62.14% share in 2025, whereas the three-chip segment is advancing at a 7.51% CAGR to 2031.
- By throw distance, normal-throw units maintained a 59.16% share in 2025, yet ultra-short-throw models are growing at a 7.72% CAGR over the same horizon.
- By brightness class, projectors above 10,000 lumens posted the fastest 7.88% CAGR, while the 2,500-to-4,999-lumen band accounted for 42.38% of 2025 sales.
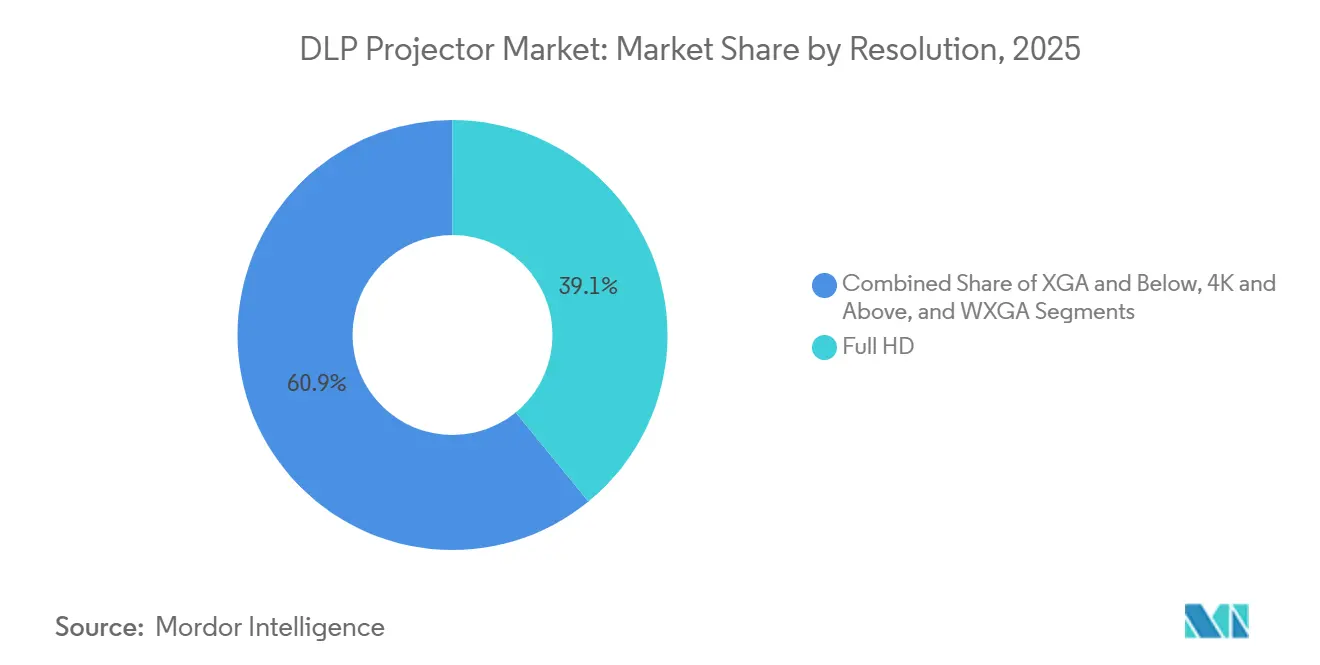
- By resolution, Full HD held a 39.11% share in 2025, and 4K devices are projected to rise at a 7.91% CAGR through 2031.
- By application, education led with 34.16% share in 2025, and simulation and training is set to grow at an 8.56% CAGR during the forecast period.
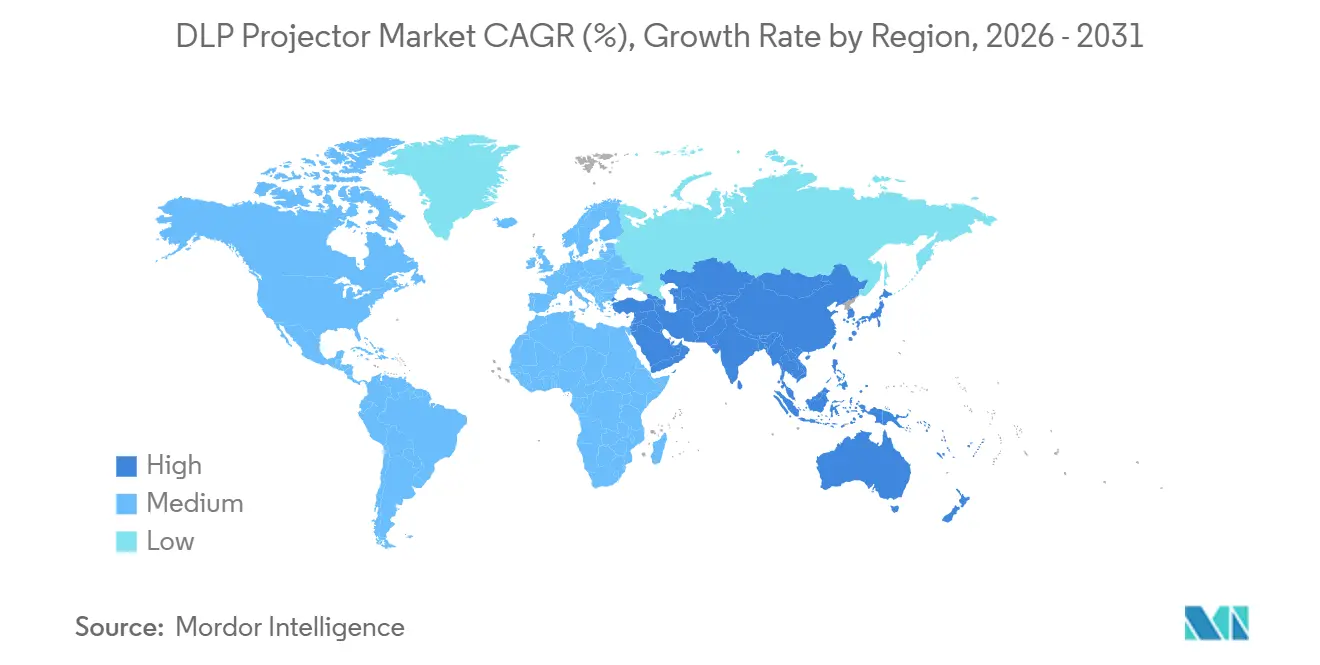
- By geography, the Asia-Pacific region generated 36.77% of the 2025 revenue, whereas the Middle East is poised for the fastest 8.29% CAGR to 2031.
Note: Market size and forecast figures in this report are generated using Mordor Intelligence’s proprietary estimation framework, updated with the latest available data and insights as of January 2026.
Global DLP Projector Market Trends and Insights
Drivers Impact Analysis*
| Driver | (~) % Impact on CAGR Forecast | Geographic Relevance | Impact Timeline |
|---|---|---|---|
| Increment in Demand in the Entertainment Industry | +1.2% | Global, with concentration in North America and Middle East | Medium term (2-4 years) |
| Rapid Digitalization in the Education Sector | +1.8% | Asia-Pacific core, spill-over to South America and Africa | Long term (≥ 4 years) |
| Surge in Home Cinema Adoption with Affordable 4K | +1.1% | North America, Europe, and urban Asia-Pacific | Short term (≤ 2 years) |
| Replacement Cycle for Lamp to Laser Upgrades in Corporates | +1.5% | Global, with early gains in North America and Europe | Medium term (2-4 years) |
| Increasing Deployment in Simulation and Training for Defense | +0.9% | North America, Europe, and Middle East | Long term (≥ 4 years) |
| Growth in Immersive Retail Experiences via Projection Mapping | +0.7% | Global, concentrated in urban centers and high-traffic retail zones | Short term (≤ 2 years) |
| Source: Mordor Intelligence | |||


Rapid Digitalization in the Education Sector
Government stimulus for digital classrooms is accelerating projector tenders, exemplified by India’s plan to surpass USD 2.1 billion in education-sector projector spend by 2029. Laser models now run 20,000 hours before service, tenfold the lamp interval, which cuts downtime for districts with limited technicians.[1]Seiko Epson Corporation, “PowerLite L-Series Launch,” epson.com Epson’s February 2025 PowerLite L-Series, which includes twelve laser SKUs spanning 4,000–7,000 lumens, was released expressly for K-12 and higher-ed rollouts.
Surge in Home Cinema Adoption with Affordable 4K
Texas Instruments’ DLP473TE 0.47-inch chipset, launched in July 2025, enables brands to ship native 4K projectors at a price point near USD 1,500. Hisense soon followed with the PX3-Pro triple-laser ultra-short-throw projector at 3,000 ANSI lumens and a sub-0.25 throw ratio, marketed as an alternative to OLED TVs.[2]Hisense Visual Technology, “TriChroma PX3-Pro Projector Details,” hisense.com Optoma, BenQ, and XGIMI unveiled similarly priced models in the same quarter, creating a consumer price war.
Replacement Cycle for Lamp to Laser Upgrades in Corporations
Lamp replacements cost USD 200–400 every 2,000–3,000 hours, whereas laser engines operate 20,000–30,000 hours with no consumables. AMC Theatres budgeted more than USD 100 million to convert 3,500 auditoriums to laser projection by 2026.[3]AMC Theatres, “Laser Projection Upgrade Program,” amctheatres.com Dolby and Christie introduced a joint Dolby Vision laser system for premium large-format screens in May 2025, underscoring laser’s corporate and cinema appeal.
Increment in Demand in the Entertainment Industry
Panasonic’s PT-RQ45K, announced in June 2025, delivers 40,000 lumens for projection-mapping and stadium shows, raising performance expectations for live events. Barco’s UDX-4K40 (37,500 lumens) and Christie’s 32,000-lumen Griffyn 4K32-RGB likewise target festivals and arenas. High-output rigs justify premium ticket pricing, prompting venue operators across the Middle East to specify projectors with a lumens output of ≥ 20,000 for new attractions.
Restraints Impact Analysis*
| Restraint | (~) % Impact on CAGR Forecast | Geographic Relevance | Impact Timeline |
|---|---|---|---|
| High Cost of Laser-Based DLP Projectors | -0.8% | Global, with acute impact in price-sensitive Asia-Pacific and South America | Medium term (2-4 years) |
| Stiff Competition from LCD and LCOS Technologies | -0.5% | Global, concentrated in education and corporate segments | Short term (≤ 2 years) |
| Growing Adoption of Large Flat-Panel Displays as Alternatives | -0.9% | North America and Europe, with emerging pressure in urban Asia-Pacific | Short term (≤ 2 years) |
| Supply Chain Constraints for High-Power Laser Diodes | -0.4% | Global, with bottlenecks in systems above 20,000 lumens | Medium term (2-4 years) |
| Source: Mordor Intelligence | |||
High Cost of Laser-Based DLP Projectors
Laser units are still priced 40%–80% above their lamp counterparts, restricting uptake in developing markets, including non-metro India, where lamp projectors remain dominant. Vendors offer hybrid laser-phosphor models to trim bill-of-materials costs, but such compromises reduce color-gamut coverage and brightness uniformity.
Growing Adoption of Large Flat-Panel Displays as Alternatives
Interactive flat panels shipped more than 7.2 million units in 2023, siphoning demand from projectors in classrooms measuring 75 to 85 inches. BenQ’s comparative study showed conference rooms under 85 inches favor plug-and-play LED screens over ceiling-mounted projection. Epson counters by marketing a 100-inch laser projection that undercuts equivalent flat-panel costs, yet falling LED prices still widen the substitution threat.
*Our forecasts treat driver/restraint impacts as directional, not additive. The impact forecasts reflect baseline growth, mix effects, and variable interactions.
Segment Analysis
By Light Source: Laser Adoption Widens Across Use Cases
Laser systems are on track for a 7.67% CAGR, outstripping the overall DLP Projector Market or Digital Light Processing Projector Market as buyers prioritize maintenance savings. Lamp units, which accounted for 44.83% of revenue in 2025, remain prevalent in price-sensitive rental markets and emerging economies where short-term capital constraints outweigh lifecycle economics. Energy-efficiency standards favor instant-on laser engines that draw less power in standby, while advances in gallium-nitride diodes push wall-plug efficiency to higher levels. The DLP projector market size for laser units is forecast to surpass lamp revenue by 2029, driven by cinema, simulation, and projection-mapping projects that require stable brightness exceeding 10,000 lumens. Lamp demand persists in South America and Africa, where utilization rates are low and existing inventories of spare lamps extend the usable life at a minimal incremental cost.
Manufacturers exploit laser momentum by bundling five-year warranties and by integrating eco-modes that dim output during static content. Corporate buyers cite reduced downtime and lamp logistics as primary reasons for standardizing on laser, while venue operators see higher color saturation and uniformity as ways to justify premium ticket pricing. Sequential Segmented Transfer DMD technology solidifies the laser’s edge by enabling 4K120 Hz performance, positioning DLP for gaming and virtual reality arenas that cannot tolerate the ramp-up delays of lamp illumination.


By Chip Model: One-Chip Cost Leadership Versus Three-Chip Performance
The one-chip design controlled 62.14% of the 2025 revenue base, reflecting its cost advantage in education, small business, and entry-level home cinema. Texas Instruments supplies a broad SKU line with pixel-shift options that deliver pseudo-4K images on budget hardware, keeping price pressure on three-chip rivals. The three-chip category, however, is charting a 7.51% CAGR as large venues, simulation suites, and high-end cinemas demand color uniformity across red, green, and blue channels. The DLP Projector Market or Digital Light Processing Projector Market share of three-chip models, therefore, expands more quickly than unit volumes, because ASPs above USD 30,000 inflate revenue weightings.
Component roadmaps indicate rising cross-over points where one-chip platforms add RGB lasers and high-refresh DMDs, narrowing the visual gap without reaching three-chip price levels. Nevertheless, stadium operators, planetariums, and flagship cinemas still allocate budgets to three-chip rigs to avoid rainbow artifacts and to maintain greater than 95% DCI-P3 coverage. Regional uptake is skewed toward North America, Europe, and the Middle East, where five-year service contracts often bundle calibration and spares.
By Throw Distance: Ultra-Short Throw Targets Space-Constrained Environments
Ultra-short-throw shipments are rising at a 7.72% CAGR, energized by consumers who want 100-inch images from less than 12 inches away. Normal-throw devices hold 59.16% of revenue because ceiling mount infrastructure already exists in offices and auditoriums. Short-throw options carve out incremental share where classrooms lack rear clearance, yet still need whiteboard interaction. The DLP projector market size for ultra-short-throw home cinema models surpassed USD 1 billion in 2025, driven by triple-laser engines that achieve 3,000 lumens without fan noise spikes.
Retail showrooms demonstrate ultra-short-throw units with ambient-light rejection screens, making walk-up comparison against OLED televisions more persuasive. Commercial deployments include museum exhibits that avoid visitor shadows and digital signage that fills storefront windows. Although optical constraints limit the maximum screen size to around 140 inches, the convenience of floor placement and the elimination of cable runs offset such trade-offs for many users.

By Brightness Class: High-Lumen Demand Reflects Venue Investment Cycles
Projectors with a brightness above 10,000 lumens are growing at the fastest rate, with a 7.88% CAGR, driven by stadium renovations, projection-mapping festivals, and tourist attractions. The mainstream 2,500-to-4,999-lumen band still accounts for 42.38% of 2025 revenue, covering boardrooms and classrooms with controlled lighting. Brightness segments between 5,000 and 9,999 lumens meet the needs of auditoriums, while sub-2,500-lumen units serve the portable and pico categories. Flagship 40,000-lumen models launch, underscoring how the DLP projector market can extend into USD 100,000 price brackets, where gross margins remain double those of corporate models.
High-lumen growth is geographically concentrated in North America, Europe, and the Middle East, where event promoters allocate budgets for large open-air displays. City governments use projection mapping to enliven heritage buildings during festivals, driving seasonal spikes in rental and staging demand. Conversely, Asia-Pacific education customers continue to rely on 3,500-lumen ceiling mounts, keeping mid-range brightness a relevant option.
By Resolution: 4K Gains Scale as Chipset Prices Fall
Native 4K projectors are projected to record a 7.91% CAGR, underpinned by chipset cost declines that narrow the premium over Full HD to below USD 300 in some SKUs. Full HD maintains a 39.11% revenue share in 2025 because corporate PowerPoint content and legacy classroom assets are still 1080p. The XGA tier lingers in budget procurement where price is paramount. The DLP projector market size for 4K education models is modest today, but is expected to increase once digital syllabus materials transition beyond HD graphics.
Content ecosystems matter: streaming platforms now offer live sports and movies in 4K HDR, which exploits the high contrast ratio of DLP. Simulation and gaming further encourage 4K120 Hz operating modes, while emerging 8K pilots serve cockpit trainers that require pixel density per field of view. Manufacturers achieve 4K in one-chip designs through fast pixel shifting, although three-chip units still deliver the highest on-screen resolution.
By Application: Education Dominates, Simulation Expands
Education accounted for 34.16% of 2025 revenue, thanks to large-scale procurement programs across India, China, and Indonesia. Simulation and training posts the strongest 8.56% CAGR as defense entities modernize flight and vehicle trainers that require 4K and even 8K projection walls. Business applications range from conference rooms to rental staging, while home entertainment is on the rise in urban areas, where living-room space often favors a projector over a 100-inch television. Large-venue installations include stadium scoreboards and houses of worship, and projection-mapping advertising turns city façades into temporary screens.
In North America and Europe, cinema operators are upgrading their auditoriums with laser rigs that reduce maintenance and enable the delivery of HDR content. Asia-Pacific continues to invest in classroom digitalization, a driver that supports steady demand even when consumer spending slows. Defense-oriented simulation programs span the United States, the Middle East, and NATO partners, who align their budgets with immersive training mandates.
Geography Analysis
Asia-Pacific assembled 36.77% of 2025 revenue, lifted by China’s consumer projector enthusiasm and by India’s public-school digitization grants. Several provinces subsidize the local assembly of 4K DLP models, keeping channel prices low enough to expand beyond tier-one cities. Japanese corporations are refreshing their meeting room fleets with laser units that help satisfy internal sustainability goals, thereby reinforcing replacement demand even as new-build office space plateaus.
The Middle East registers the fastest 8.29% CAGR, driven by mega-projects in Saudi Arabia and the United Arab Emirates that require projectors with 20,000-plus lumens for stadiums, cultural centers, and expo venues. Vision 2030 tourism targets in Saudi Arabia include projection mapping spectacles at heritage sites, while Dubai’s event calendar sustains rental-staging inventories. Regional integrators often bundle long-term service contracts, which inflates revenue relative to the number of units.
North America and Europe experience steady but slower growth, shaped by corporate lamp-to-laser replacement cycles, cinema retrofits, and premium home-theater buyers who favor ultra-short-throw designs. The substitution risk from large flat panels is highest in small conference rooms, although projector makers defend their share in spaces above 100 inches. South America and Africa lag due to financing constraints, yet intermittent education grants and donor-funded ICT initiatives create pockets of demand. Currency volatility and import duties temper ASPs, prompting vendors to release lamp models that stretch service intervals to 4,000 hours.

Regulatory Landscape
Safety and performance compliance for DLP projectors is shaped by optical radiation and laser-safety frameworks that vary by light source. Laser-illuminated projectors align with IEC 60825-1:2014 for laser product safety classification, while IEC 62471-5:2015 provides a projector-specific photobiological risk-group approach applicable to both lamp and laser image projectors, including labeling and risk assessment requirements. In the United States, the FDA CDRH recognizes pathways such as Laser Notice No. 57 (May 8, 2019), which enables conformity using specified IEC standards as an alternative route for laser product requirements, affecting how manufacturers document hazard distances and installation constraints for higher-risk models, including Risk Group 3.
Energy-related rules create a second compliance layer, though projection equipment generally receives carve-outs. In the European Union, Commission Regulation (EU) 2023/826 applies from May 9, 2025 and sets standby and off-mode ecodesign requirements for electronic equipment. Projectors are generally excluded from the EU ecodesign framework for electronic displays under Regulation (EU) 2019/2021, so product safety documentation and labeling remain central for laser platforms, while energy-policy impacts tend to show up indirectly through features such as instant-on behavior and auto-dimming that reduce standby consumption in corporate and education deployments.
Value Chain Analysis
The DLP projector value chain is anchored by a concentrated upstream component structure. Texas Instruments is the single-source supplier for DLP digital micromirror devices and closely related chipset elements, including controllers and power-management components. Downstream of the chipset layer, optical module makers build the optical and light engine (optics, illumination modules, and integration needed to meet brightness and color targets), while system integrators or OEM/ODM assemblers complete electronics, thermal design, housing, firmware, and final assembly. Brand differentiation for Panasonic, Christie, Barco, BenQ, Optoma, and XGIMI typically comes through the optical engine, light source selection (lamp versus laser), image processing, acoustics, and software or connectivity, even when the core DLP chipset foundation is shared.
Distribution and deployment run through consumer retail and e-commerce for home cinema, as well as A/V integrators and rental-staging channels for education, corporate, large venues, and projection mapping. The chain is exposed to trade-policy friction and logistics disruptions. Coretronic reported a suspension in shipments of its projectors to the United States in April 2025 due to tariffs, with shipments gradually resuming from May 2025, which shows how cross-border cost shifts can interrupt finished-goods flow and force inventory, sourcing, or routing changes. On the component side, availability constraints for high-power laser diodes and specialized optics are most acute for very high-lumen systems, making qualification of multiple suppliers and tighter collaboration between chipset, optical module, and final-assembly tiers important for products above 10,000 lumens.
Competitive Landscape
Texas Instruments operates as the sole supplier of DLP digital micromirror devices, a structure that standardizes core components while allowing projector brands to differentiate through optics, light sources, and software ecosystems. The field, therefore, exhibits moderate concentration, with top players, such as Panasonic, Christie Digital, and Barco, dominating the premium venue segment. Meanwhile, BenQ, Optoma, and XGIMI compete aggressively in the value segments.
Private equity interest surfaced when Bain Capital took Barco private in late 2024, providing investment capacity for high-margin cinema and simulation verticals. Chinese consumer brands are leveraging domestic supply chains and e-commerce distribution to release native 4K ultra-short-throw units at a price point below USD 1,500, a strategy that erodes entry-level pricing worldwide. Premium vendors respond by bundling calibration, extended warranties, and network management suites that integrate projectors into broader A/V ecosystems.
Technology roadmaps emphasize higher refresh rates, energy efficiency, and HDR capabilities. The latest 0.47-inch 4K chipset enables gaming-oriented 120Hz modes, while Sequential Segmented Transfer DMD pushes to 8K at 60Hz for virtual reality domes. Software is a growing differentiator as brands preload streaming apps, voice assistants, and cloud diagnostics that create sticky ecosystems. Regulatory focus on power consumption guides the inclusion of auto-dimming and instant-on features that favor laser illumination.
DLP Projector Industry Leaders
Texas Instruments Inc.
Barco NV
Optoma Corporation
Digital Projection Ltd.
NEC Corporation
- *Disclaimer: Major Players sorted in no particular order


Market Opportunities and Future Outlook
Laser migration continues to create whitespace for DLP platforms that combine high brightness with longer service intervals, particularly where buyers standardize 10,000+ lumen fleets for venues, simulation suites, and premium cinema. Product roadmaps in 2026 point to pushing large-venue performance into more compact single-chip architectures. Panasonic Connect unveiled the PT-HTQ20 (1-Chip DLP, 20,000 lumens, Rec. 2020 color gamut with 4K via Quad Pixel Drive) with targeted availability in Q4 2026, and Christie announced the Korus Series in April 2026 using Texas Instruments 0.8-inch HEP DMD technology positioned for 24/7 professional operation. These releases support opportunities for integrators and brands to package higher-lumen DLP with service contracts, remote monitoring, and color-calibration workflows aimed at reducing total downtime for enterprise and attraction operators.
The consumer and prosumer segment also presents a monetization path around 4K and premium HDR feature sets as projectors compete against large flat panels in 100-inch-plus scenarios. Texas Instruments chip advances, including the July 2025 DLP473TE enabling native 4K projectors around the USD 1,500 price point, have already broadened the addressable base for ultra-short-throw and home cinema. Meanwhile, 2026 launches such as Optoma UHR90DV (RGB triple-laser 4K with Dolby Vision and IMAX Enhanced) show continued feature-led segmentation at the high end. Education and corporate refresh cycles further support bundling collaboration and casting software with laser models to defend projector share against interactive flat panels, especially in rooms where installation constraints favor ultra-short-throw placement and screen sizes above 100 inches.
Recent Industry Developments
- July 2026: Optoma launched the UHR90DV flagship RGB triple-laser 4K home theater projector, adding Dolby Vision and IMAX Enhanced positioning to its premium lineup. The release strengthens feature-led differentiation against high-end TVs and reinforces triple-laser RGB as a competitive benchmark for color-gamut and HDR performance in home cinema.
- May 2026: Optoma expanded its ProScene portfolio with the ZK1000, a 4K UHD+ (WQUXGA) interchangeable-lens laser projector aimed at professional installation use cases. The move broadens Optoma's coverage of higher-brightness, integrator-led deployments where lens flexibility and fleet standardization influence purchasing decisions.
- August 2024: Texas Instruments introduced a compact DLP display controller designed to enable 4K UHD projector designs in smaller form factors. By lowering size and integration barriers at the controller level, the announcement supports OEM efforts to bring 4K capability to more portable and space-constrained designs across consumer and commercial segments.


Research Methodology Framework and Report Scope
Market Definition and Coverage
For this study, the DLP projector market is defined as revenue earned from projectors that use digital light processing technology, counted at the point of sale into end-use channels across regions and applications.
Scope exclusions: we exclude non-DLP projector technologies and non-projector display equipment (such as flat panels and LED walls) to avoid mixing adjacent display categories.
Segmentation Overview
- By Light Source
- Lamp
- LED
- Laser
- By Chip Model
- One Chip
- Three Chip
- By Throw Distance
- Normal Throw
- Short Throw
- Ultra-Short Throw
- By Brightness Class
- Below 2,500 Lumens
- 2,500-4,999 Lumens
- 5,000-9,999 Lumens
- Above 10,000 Lumens
- By Resolution
- XGA and Below
- WXGA
- Full HD
- 4K and Above
- By Application
- Home Entertainment and Cinema
- Business
- Education
- Large Venues
- Simulation and Training
- Projection Mapping Advertising
- Other Applications
- By Geography
- North America
- United States
- Canada
- Mexico
- Europe
- Germany
- United Kingdom
- France
- Russia
- Rest of Europe
- Asia-Pacific
- China
- Japan
- India
- South Korea
- Australia
- Rest of Asia-Pacific
- Middle East and Africa
- Middle East
- Saudi Arabia
- United Arab Emirates
- Rest of Middle East
- Africa
- South Africa
- Egypt
- Rest of Africa
- Middle East
- South America
- Brazil
- Argentina
- Rest of South America
- North America
Data Sources, Market Sizing, and Validation
Desk Research
Desk research was used to set the factual base for the model and to keep our assumptions realistic before expert validation. We referenced public sources such as US Census trade data, UN Comtrade, World Bank macro indicators, and standards and technical notes from bodies such as ISO and IEC, where projector performance terms are defined.
We also used public financial filings, investor decks, product specification sheets, and reputable press coverage to track shipment direction, pricing bands, and launch timing for new light-source types. Where needed, paid subscriptions for company financials and intelligence, news and financials, and patent databases were used to cross-check supplier activity and product roadmaps. These examples are illustrative, since other public sources were also used for data collection, validation, and clarification.
Primary Interviews and Surveys
Primary inputs came from interviews and structured surveys with stakeholders across the projector value chain, including component ecosystem participants, brand-side product and pricing teams, channel partners, and large-venue and education buyers. For a global market like this, responses were balanced across APAC, EMEA, and the Americas so that regional pricing, demand seasonality, and procurement cycles could be reflected, then checked against the desk-research signals.
Distribution of primary research fieldwork respondents
| Company type | Respondent position | Region |
|---|---|---|
| Top tier: 29% | CXOs: 15% | APAC: 39% |
| Mid tier: 55% | Functional/Unit leaders: 30% | EMEA: 35% |
| Smaller Players: 16% | Managers: 55% | Americas: 26% |
Market-Sizing & Forecasting
The core sizing starts with a top-down build where production and trade signals, regional demand pools, and adoption by application are used to reconstruct yearly revenue for DLP projectors. To keep the totals grounded, we then corroborated the outcome with selective bottom-up checks using sampled average selling price (ASP) by brightness and resolution bands, along with channel checks on unit movement in key regions.
Key inputs used in the model include projector shipment direction by region, mix shifts toward laser and LED light sources, brightness class demand (including higher-lumen venue use), resolution upgrades (Full HD to 4K and above), and the application mix across education, business, home entertainment, and large venues. Where data was thin for smaller geographies, gaps were handled by applying proxy indicators such as import intensity and procurement cycle timing, then corrected through interview feedback.
For forecasting, scenario analysis was used to reflect the different speed of upgrades and replacement cycles across applications. The scenarios were anchored to interview consensus on pricing trends and product availability. Final outputs were expressed in USD with consistent year-level assumptions so the time series remains comparable.
Data Validation & Update Cycle
Validation was done through multiple checks so the model stays consistent with real-world market behavior. Outputs were compared against independent signals such as regional trade movement, product launch cadence, and observable shifts in ASP by major performance tiers, and then unusual jumps were reworked before sign-off.
Each dataset and assumption was reviewed in steps, and respondents were re-contacted when variances were outside expected ranges, or when a major market event changed pricing or supply. Reports are refreshed annually, with interim updates when material events occur, and a final pre-delivery review is completed so clients receive the latest updated view.
Mordor Intelligence's Dlp Projector Market Estimate Compared With Other Published Estimates
Published market sizes for DLP projectors often do not match because the timing and pricing assumptions differ, even when the market name looks the same. Differences also come from what each publisher counts as revenue and how they treat application-led demand in years with fast technology shifts.
A common gap driver is the refresh cadence of the input set, since ASPs for higher brightness and 4K-class models can move quickly as laser penetration rises and inventory cycles normalize. Currency conversion timing can also change the USD view. In this study, quarterly pricing checks, consistent FX timing, and re-validation calls were used to keep the 2026 value steady. This is the main reason the number aligns to USD 6.69 B (2026) in Mordor Intelligence while some other publications land higher or lower.
Benchmark comparison
| Source | Market Size | Gaps in Research Methodology |
|---|---|---|
| Mordor Intelligence | USD 6.69 B (2026) | |
| Global Consultancy A | USD 7.27 B (2026) | Uses a higher blended ASP trajectory and a broader application mapping (including more large-venue and immersive-use weighting), which can lift the near-term value when premium mix is assumed to scale faster. |
| Industry Publisher B | USD 6.17 B (2025) | Anchors the base year at 2025 and applies a different currency timing and upgrade cycle assumption, which can understate the step-up into 2026 when replacement demand is modeled more conservatively. |
The spread across the three figures is mainly explained by how each estimate treats near-term ASP movement, the year chosen for the anchor point, and the conversion timing into USD. By tying the total to observable mix shifts (light source, brightness, and resolution) and then checking it with repeatable channel and expert inputs, the final number stays traceable and easier to update as new signals appear.


Key Questions Answered in the Report
What is the projected value of the DLP projector market in 2031?
The market is forecast to reach USD 9.49 billion by 2031.
Which light source is growing fastest in projector adoption?
Laser illumination is advancing at a 7.67% CAGR as buyers replace lamp units.
Which region leads global revenue?
Asia-Pacific generated 36.77% of 2025 sales and remains the largest regional contributor.
What brightness class records the highest CAGR?
Projectors above 10,000 lumens post the quickest 7.88% growth through 2031.
How are flat-panel displays affecting projector demand?
Large LED panels compete directly in corporate and education settings, trimming the market CAGR by 0.9 percentage points in the short term.
Which application segment is expanding fastest?
Simulation and training is projected to rise at an 8.56% CAGR due to defense spending on immersive environments.
Page last updated on:






