
Market Overview
| Study Period | 2020 - 2031 |
|---|---|
| Market Size (2026) | USD 0.93 Trillion |
| Market Size (2031) | USD 1.29 Trillion |
| Growth Rate (2026 - 2031) | 6.87 % |
| Fastest Growing Market | Asia-Pacific |
| Largest Market | North America |
| Market Concentration | Low |
Major Players *Disclaimer: Major Players sorted in no particular order Image © Mordor Intelligence. Reuse requires attribution under CC BY 4.0. | |
DIY Home Improvement Market Analysis by Mordor Intelligence
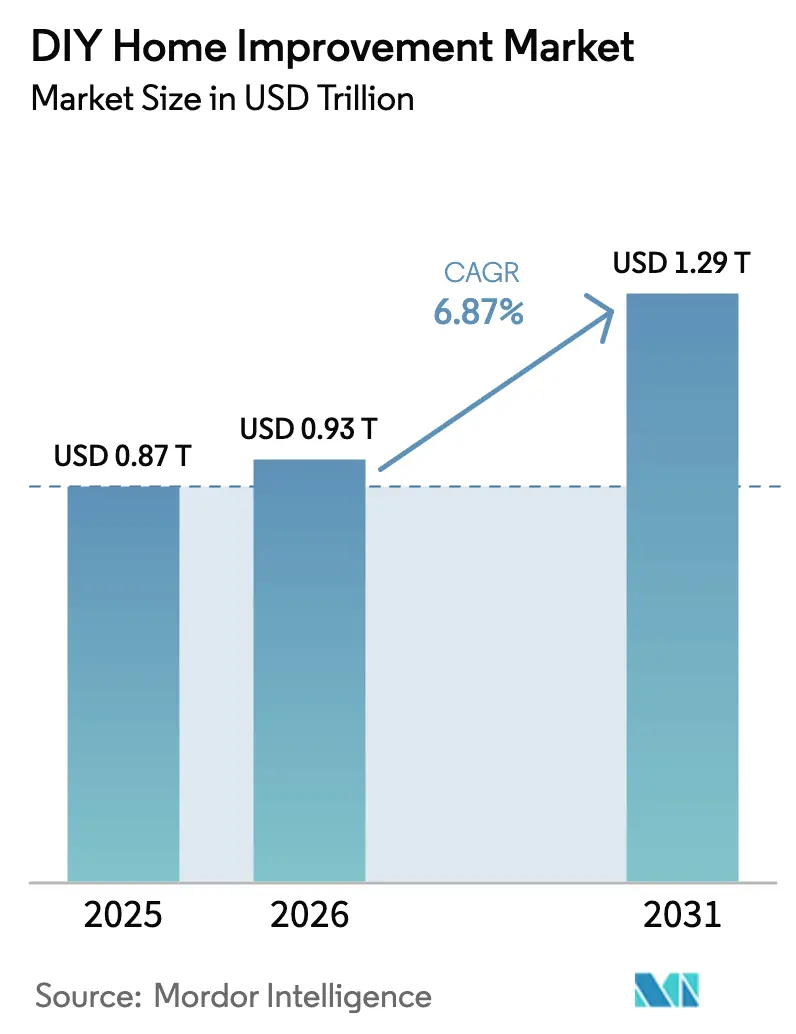
The DIY home improvement market size was valued at USD 0.87 trillion in 2025 and is estimated to grow from USD 0.93 trillion in 2026 to reach USD 1.29 trillion by 2031, at a CAGR of 6.87% during the forecast period (2026-2031). This growth rate represents an acceleration compared with the 2020–2025 period, which was marked by pandemic-driven demand swings and uneven supply conditions. In 2026, homeowners increasingly favor renovation over relocation, as elevated mortgage rates and constrained housing supply limit mobility and sustain demand for repair, replacement, and targeted upgrade projects. Competitive intensity remains moderate, characterized by a mix of regional leaders and national players, with differentiation increasingly driven by omnichannel capabilities, professional customer engagement, and efficient jobsite fulfillment. Marketplace platforms and AI-driven merchandising tools are contributing incremental revenue and margin improvement by aligning assortments more closely with local demand and improving digital conversion rates.
Key Report Takeaways
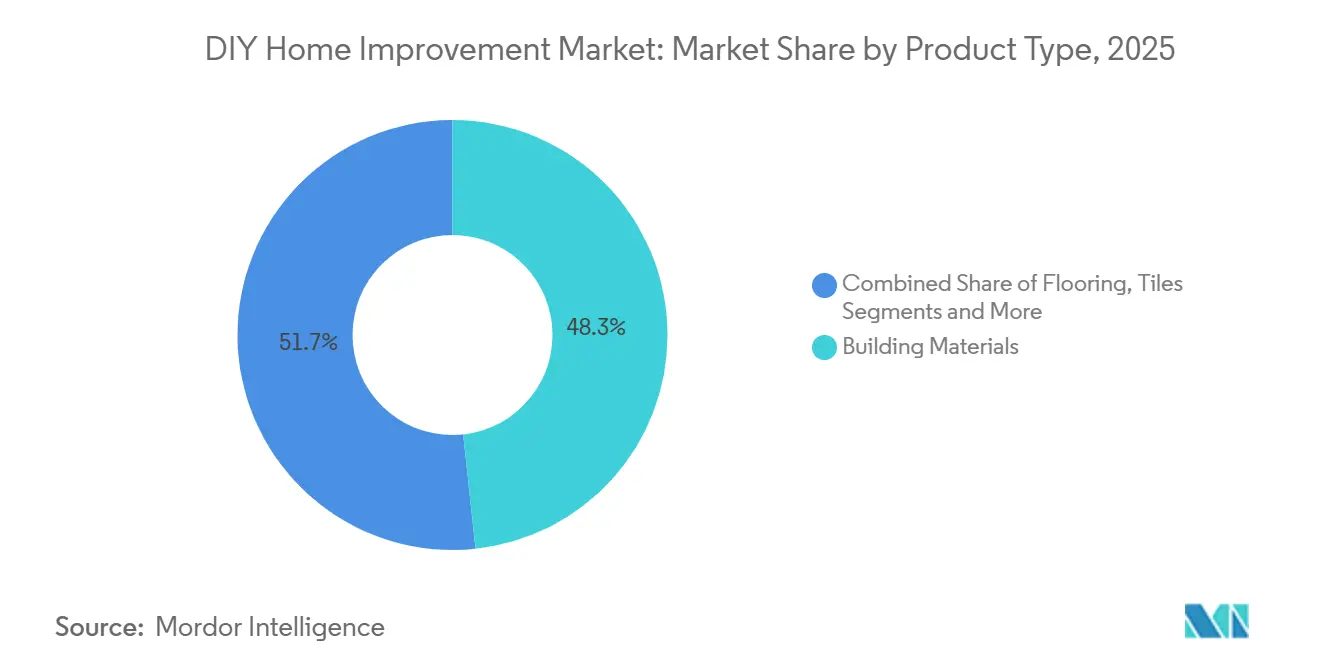
- By product type, building materials led with 48.33% of the DIY home improvement market share in 2025, while flooring and tiles are projected to grow at a 7.76% CAGR through 2031, signaling a shift toward modular and sustainable surface upgrades that lift ticket values in the DIY home improvement market.
- By distribution channel, DIY home improvement stores accounted for 68.74% of the DIY home improvement market share in 2025, with online channels expanding at an 8.27% CAGR through 2031, as store-based fulfillment underpins cost-effective same-day and next-day options.
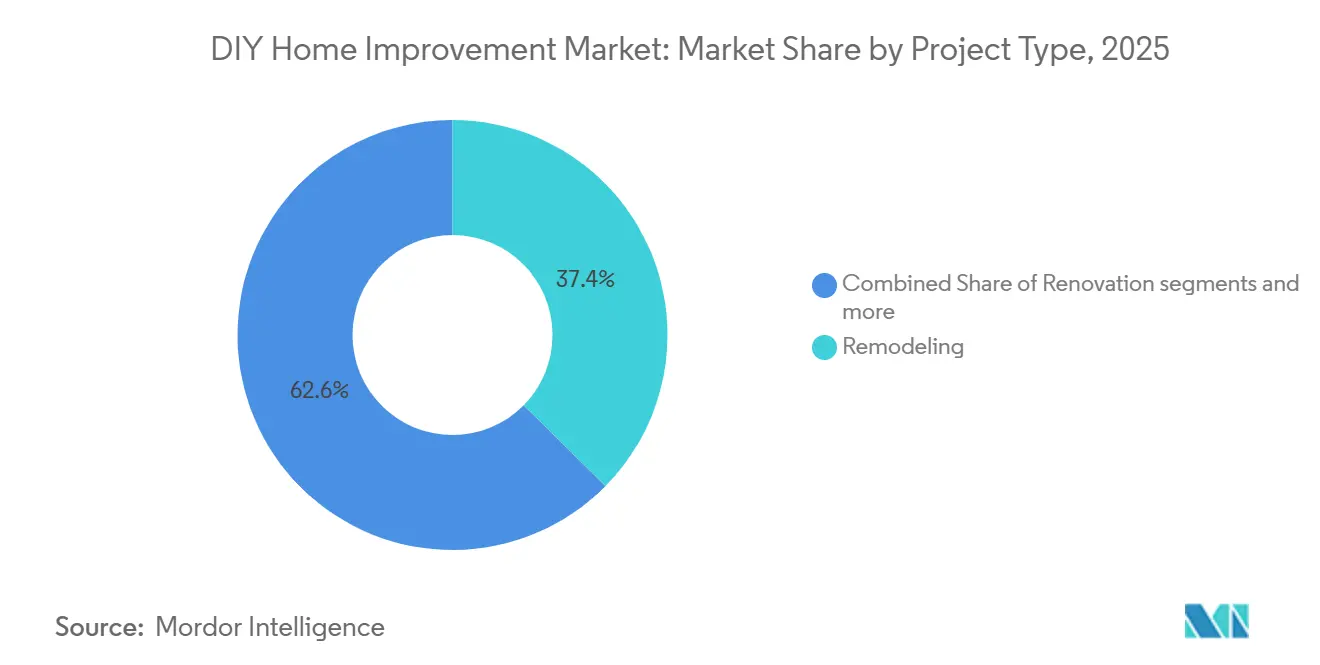
- By project type, remodeling accounted for 37.38% of the DIY home improvement market in 2025, while renovation is the fastest-growing segment at a 6.75% CAGR through 2031, as budget-conscious households prioritize targeted fixes.
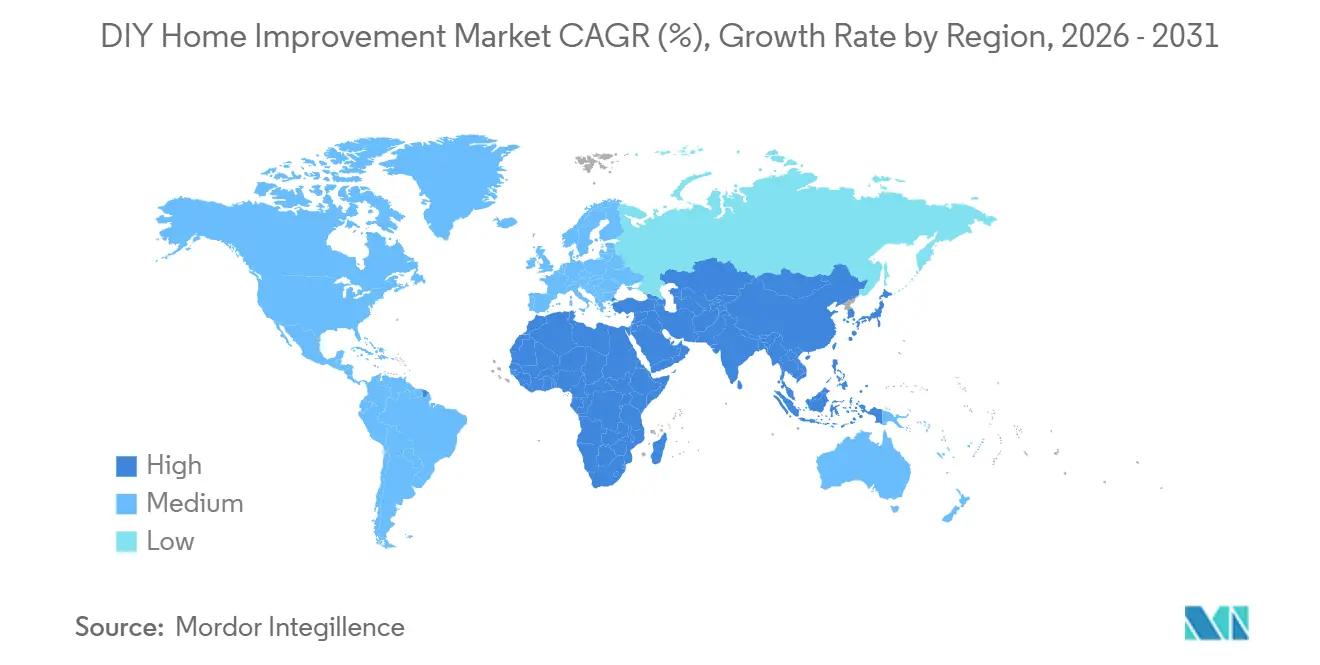
- By geography, North America captured 39.35% of the DIY home improvement market share in 2025, and Asia-Pacific is the fastest-growing region, with a 7.87% CAGR through 2031.
Note: Market size and forecast figures in this report are generated using Mordor Intelligence’s proprietary estimation framework, updated with the latest available data and insights as of January 2026.
Market Trends and Insights
Drivers Impact Analysis of DIY Home Improvement Market*
| Driver | (~) % Impact on CAGR Forecast | Geographic Relevance | Impact Timeline |
|---|---|---|---|
| Digital retail transformation in home improvement | +1.2% | Global, with North America and Europe leading adoption | Short term (≤ 2 years) |
| Younger demographic entry into homeownership and renovation | +1.8% | North America core, spillover to APAC urban centers | Medium term (2-4 years) |
| Legacy housing stock maintenance and modernization needs | +1.4% | North America, Western Europe | Long term (≥ 4 years) |
| Digital content creator impact on home improvement trends | +0.9% | Global, particularly strong in North America and APAC | Short term (≤ 2 years) |
| Collaborative workshop ecosystem growth | +0.3% | Urban centers in North America, and selective EU cities | Medium term (2-4 years) |
| Augmented reality-enabled DIY adoption | +0.6% | Global, led by tech-savvy cohorts in APAC and North America | Medium term (2-4 years) |
| Source: Mordor Intelligence | |||
Digital retail transformation in home improvement
Digital convenience now shapes how households and trade professionals plan and execute projects, which supports steady gains for the DIY home improvement market as online and offline channels converge. The Home Depot reported that digital transactions accounted for 15.1% of fiscal 2024 net sales, and about half of U.S. online orders were fulfilled through stores, which helps the retailer deliver on delivery speed while controlling last-mile costs for bulky, low-margin products[1]. Store-based fulfillment is also a demand signal engine because high-volume items cycle through local inventory faster, improving planogram accuracy for DIY and Pro baskets alike in the DIY home improvement market. Kingfisher’s marketplace model scaled quickly, with GMV rising strongly and incremental retail profits from third-party sellers, which extend the assortment without inventory risk and enhance conversion from long-tail searches. This commerce architecture now anchors competitive strategy because it blends speed, breadth, and cost efficiency that pure plays struggle to match on bulky SKUs in the DIY home improvement market. As privacy rules such as GDPR shape how retailers use customer data, scalable personalization and attribution become key to boosting conversion while maintaining compliance, especially across borders with varying enforcement cadences.
Younger demographic entry into homeownership and renovation
Younger owners are making frequent, style-forward updates, bringing fresh volume to the DIY home improvement market, even when budgets are tighter. Generational behavior continues to shift toward value, digital discovery, and quicker projects that improve livability without long disruptions, which aligns with product categories that are easy to install and replace[2]. Retailers are responding by strengthening digital engagement and content to guide first-time renovators from research to purchase and fulfillment, often combining project calculators, inspiration, and checklists that increase basket attach rates. Omnichannel programs and loyalty ecosystems emphasize education and convenience for these cohorts, reducing friction from idea to execution and strengthening repeat-purchase behavior in the DIY home improvement market. As digital acquisition costs rise, retailers with helpful content and clear fulfillment paths are more likely to retain younger shoppers through subsequent project cycles, which sustains category health. The result is a generational handoff in which online research, in-app planning, and rapid store pickup work together to sustain steady project throughput in the DIY home improvement market.
Legacy housing stock maintenance and modernization needs
A maturing housing stock is a structural tailwind for the DIY home improvement market because systems wear out, codes evolve, and energy costs push owners toward efficiency upgrades. More than 80% of homes in the United States are at least 20 years old, which increases the need for recurring remedial work on roofing, HVAC, windows, cladding, and plumbing over time. JCHS estimated that spending on home improvements and repairs exceeded USD 450 billion in 2024, with steady activity anchored by repair and replacement as owners stayed put amid higher mortgage rates[3]. European programs tied to the energy transition are also nudging the market toward insulation, heat-pump readiness, and building envelope improvements that require reliable access to compliant materials. Retailers that combine compliant assortments with how-to guidance and local availability are positioned to capture share from mandated or subsidy-eligible upgrades in the DIY home improvement market. This structural base of work supports consistent category demand even when discretionary projects cycle lower in the short term.
Digital content creator impact on home improvement trends
Content creators have changed how homeowners learn techniques and choose products, which shifts the advice layer from store aisles to digital channels in the DIY home improvement market. Retailer marketplaces and curated online experiences intersect with this trend by broadening assortments and giving shoppers more paths from inspiration to purchase, while reducing the platform's inventory risk. AI-driven personalization at leading European retailers has converted browsing signals into measurable sales, indicating that timely, localized recommendations increase conversion for both DIY and trade shoppers. As short videos normalize product education, stores and websites that integrate project planning tools help bridge confidence gaps and reduce returns in categories with technique-sensitive installation. The playing field favors platforms that integrate content, inventory, and fulfillment into a seamless journey, keeping orders within the retailer’s ecosystem and sustaining loyalty in the DIY home improvement market. This shift complements rather than replaces expert in-store guidance for complex jobs, especially where Pro services remain central to execution.
Restraints Impact Analysis of DIY Home Improvement Market*
| Restraint | (~) % Impact on CAGR Forecast | Geographic Relevance | Impact Timeline |
|---|---|---|---|
| Labor scarcity driving professional service substitution | -1.1% | North America and Western Europe, where aging demographics are pronounced | Long term (≥ 4 years) |
| Commodity price fluctuations deterring project initiation | -0.8% | Global, with North America and Europe most affected | Short term (≤ 2 years) |
| Municipal approval complexity limiting DIY scope | -0.5% | National, with early impact in large states and metro areas enforcing 2024-2025 code cycles | Medium term (2-4 years) |
| Liability and warranty gaps in owner-executed projects | -0.3% | North America, in states with higher resilience standards | Medium term (2-4 years) |
| Source: Mordor Intelligence | |||
Labor scarcity driving professional service substitution
Ongoing shortages of skilled trade labor continue to limit project execution capacity, steering a growing share of complex home improvement work toward credentialed professionals and narrowing the scope of purely DIY projects. Major retailers are responding by investing in workforce development, including training programs and scholarships, to strengthen the skilled trades pipeline and improve job-site reliability. At the same time, retailers are expanding Pro-focused capabilities, including jobsite delivery, project-based pricing, and dedicated sales support, to better serve higher-value projects with strict scheduling and specification requirements. These investments are increasing the share of spending captured through professional channels, even when projects originate from DIY-led research and planning. As housing demographics age and building codes become more complex, the DIFM segment is expected to retain a structurally larger role in total market spending, reinforcing a bifurcated landscape in which mass retail supports smaller tasks while professional ecosystems capture larger project budgets.
Commodity price fluctuations deterring project initiation
Fluctuations in lumber and other core building material prices continue to introduce budgeting uncertainty for both homeowners and installers, often leading to delayed timelines or the phasing of larger projects. Pricing data in 2025 highlighted renewed upward pressure on framing lumber and structural inputs, reinforcing a volatile cost environment that complicates planning and scheduling. Retailers are addressing part of this challenge by expanding distribution capacity and holding deeper inventories of bulky materials, enabling more reliable jobsite delivery and reducing order fragmentation for time-sensitive professional projects. For DIY consumers, heightened price volatility increases the importance of transparent pricing, flexible pickup options, and clear product substitution guidance to help keep projects within budget. Overall, these conditions are encouraging a more cautious approach to large discretionary projects, with demand tilting toward essential repair and replacement activities that deliver immediate functional benefits.
*Our forecasts treat driver/restraint impacts as directional, not additive. The impact forecasts reflect baseline growth, mix effects, and variable interactions.
DIY Home Improvement Market Segment Analysis
By Product Type:
Building Materials Anchor Revenue While Surface Categories Capture Innovation PremiumBuilding materials accounted for 48.33% of the 2025 market size, reflecting the essential nature of lumber, drywall, insulation, cement, and related inputs across repair, replacement, and structural work in the DIY home improvement market. The category’s weight is underpinned by aging stock and code cycles that require ongoing updates to roofs, cladding, windows, and foundation perimeter defenses in mature markets. Against this backdrop, flooring and tiles are forecast to expand at a 7.76% CAGR through 2031, as modular surfaces, click-in systems, and lower-VOC materials unlock faster installations and a wider array of styles in the DIY home improvement market. Luxury vinyl tile and large-format porcelain have become favored options for kitchens and baths because they balance cost, durability, and ease of installation for experienced DIYers. The same trends are lifting demand for certified adhesives, underlayments, and trims that improve finish quality and address moisture and acoustics in multi-family dwellings.
Paints and coatings sustain strong brand loyalty and steady turnover due to a wide range of color refresh, stain blocking, and exterior protection tasks that are viable even in tighter budgets. Tools and Equipment remain resilient because homeowners break down projects into smaller scopes, which drives sales of cordless drills, sanders, multi tools, oscillating kits, and rental attachments that enhance capability without major capital outlays. Decor and Lighting, along with Plumbing and Electrical, sit in the middle of essential and deferrable spend, yet streamline upgrades are compelling when paired with energy savings or accessibility needs. Accessibility-led retrofits, such as lever handle faucets and grab bars, benefit from demographic trends and renewed attention to safety and usability in older homes. Together, product categories that save time, reduce mess, and deliver immediate functional improvements will continue to compound their contributions to the DIY home improvement market.

By Distribution Channel:
Physical Stores Retain Primacy While Marketplaces Extend ReachDIY home improvement stores accounted for 68.74% of the 2025 market size, underscoring the advantages of dense networks near suburban population centers, strong assortments, and integrated services such as rental, curbside pickup, and project guidance. Online channels are expanding at an 8.27% CAGR through 2031 as marketplaces add breadth without balance sheet inventory and as replatforming shortens checkout flows for both DIY and trade buyers. The Home Depot reports that about 50% of U.S. online orders are fulfilled through stores, reducing last-mile costs for bulky items and speeding delivery while keeping inventory productive. Kingfisher’s marketplace model delivered strong GMV and increased retail profit, proving the viability of third-party seller integration for home improvement assortments that require deep long-tail coverage. Specialty stores focus on targeted categories and depth of service, while hypermarkets emphasize convenience items but typically do not support complex projects end-to-end.
The strategic focus is shifting toward omnichannel journeys that start online and end with store pickup or immediate delivery, which is well-suited to the DIY home improvement market, where product verification and rapid availability matter. For retailers, the combination of store-based fulfillment and marketplace breadth helps cover a wider range of project needs without overextending capital, while analytics drives better slotting and staffing. The model also strengthens Pro relationships by enabling job lot quantities and time-specific drop windows through regional distribution assets that stock larger assortments of bulky goods. As customer expectations converge around fast fulfillment and accurate substitutions, leaders will keep enhancing localization and intelligent recommendations to lift conversion and repeat purchases in the DIY home improvement market. This distribution evolution rewards operators that harmonize inventory, content, and data across channels.
By Project Type:
Renovation Gains Momentum as Households Prioritize Targeted FixesRemodeling held the largest market share at 37.38% in 2025, but renovation is the fastest-growing project type at a 6.75% CAGR through 2031 as households favor essential repairs, replacements, and short downtime upgrades in the DIY home improvement market. The distinction is important because remodeling often requires permits, engineered plans, and sizable contingencies, while renovation centers on appliance swaps, patch-and-paint, roof spot repairs, and HVAC service, which are easier to schedule and finance. Angi reported that average project spend declined in 2024 as budgets moved toward maintenance and emergency repairs, which aligns with the observed preference for targeted scopes that deliver immediate utility[4]. This pattern favors categories with lower installation friction and clear performance improvements, including water-saving fixtures, LED lighting, and efficient insulation in priority zones. As homeowners plan multi-phase improvements, renovation projects serve as bridge steps that unlock later remodeling when prices and labor availability are more predictable.
New construction remains tied to lot availability, financing conditions, and builder confidence, which makes it more volatile than existing home repair and replacement in the DIY home improvement market. For mass retailers, new construction demand flows more through Pro ecosystems via job lot deliveries and credit programs, while renovation and remodeling maintain a steadier retail sales cadence across the calendar year. The widening focus on accessibility features is another driver in the renovation mix, as households adapt homes for aging in place with safer bathrooms, improved lighting, and threshold modifications guided by practical standards. The OECD has documented the broader economic case for enabling households to age in place with supportive home environments, which highlights the long-run tailwinds for retrofit categories. These trends collectively support the DIY home improvement market as owners tackle needed work and schedule larger ambitions for later cycles.
Geography Analysis
North America DIY Home Improvement Market
North America retained a 39.35% market share in 2025, reflecting an older housing stock, strong home equity cushions, and a culture of ongoing repair and replacement that supports the DIY home improvement market. More than 80% of homes in the United States are more than 20 years old, which increases the frequency of roof work, mechanical replacements, and envelope improvements that underpin recurring demand throughout the cycle. Within the region, the United States represents the largest home improvement market, reflecting the scale of consumer and professional spending across retail and related services and underscoring the importance of operational excellence for retailers seeking to capture and defend market share. Format diversity is visible across suburban and exurban catchments, where big boxes compete with local specialists and co-op models that tailor assortments to neighborhood needs. As mortgage rates stabilize and employment remains steady, the region continues to support a balanced mix of renovation and remodeling activity in the DIY home improvement market.
APAC DIY Home Improvement Market
Asia-Pacific is the fastest-growing region, with a 7.87% CAGR through 2031, driven by urbanization, rising disposable incomes, and first-time home ownership, which trigger fit-outs and ongoing upgrades in the DIY home improvement market. China and India anchor the momentum, with expanding middle-class segments and active small-project categories that improve livability in compact spaces. Southeast Asian markets add to growth with public housing programs and private renovations that prioritize functional gains and durability within constrained footprints. Japan and Australia exhibit more mature profiles, where aging demographics and stringent codes drive targeted upgrades with emphasis on safety, efficiency, and resilience for climate and seismic conditions. As supply chains mature locally, category adoption continues to rise due to better availability, fair pricing, and shorter lead times in the DIY home improvement market.
Europe DIY Home Improvement Market
Europe presents a mixed picture across the largest retail banners and country markets, reflecting differences in consumer sentiment and policy support in 2025 and 2026. Kingfisher reported that the United Kingdom and Ireland like-for-like sales rose in its fiscal first half, while France fell, illustrating divergent consumer confidence and category traction across the continent. Iberia posted strong like-for-like growth during the same period within Kingfisher’s footprint, showcasing the benefit of format segmentation and inventory optimization in markets where demand rotated to value and speed. Central and Eastern Europe present a range of outcomes, with some markets showing flat trends as inflation and financing costs weighed on discretionary purchases in 2025. Renovation mandates aligned with energy transition goals provide a structural foundation in several EU countries, helping stabilize demand for insulation, windows, and heating upgrades in the DIY home improvement market. As retailers streamline markdowns and boost personalization with AI, they are improving throughput, protecting gross margin, and aligning inventory with real-time demand.
Value Chain Analysis
The DIY home improvement value chain spans upstream raw materials (lumber, steel, aluminum, gypsum, chemicals), building-product and tool manufacturers, and distributors or importers that stage inventory for retailers and jobsite delivery. Home improvement centers serve DIY baskets and smaller pro purchases, while specialty dealers, lumberyards, and wholesale distributors account for a larger share of sourcing for professional remodelers and homebuilders, particularly for structural materials and installed categories. Recent friction points include volatile lead times for selected building products, including cabinetry, plumbing, and fixtures. Cost pressure tied to import tariffs on key inputs and finished goods has also pushed brands and distributors to diversify sourcing and rebalance domestic production and inventory positions.
Downstream, competitive differentiation increasingly comes from logistics and service layers that connect bulky goods to projects, including regional warehousing, contractor-oriented delivery branches, and digital inventory visibility that supports substitutions and tighter delivery windows. Major retailers have expanded contractor-focused networks via acquisitions, such as The Home Depot integrating assets like SRS Distribution and Gypsum Management and Supply to support interior and trade contractors with more reliable fulfillment. Across the chain, value-added capabilities such as truss plants, door shops, custom millwork, and installed-service partners are being used to protect margin, reduce jobsite risk, and keep customers within a single ecosystem from specification through delivery.
Competitive Landscape
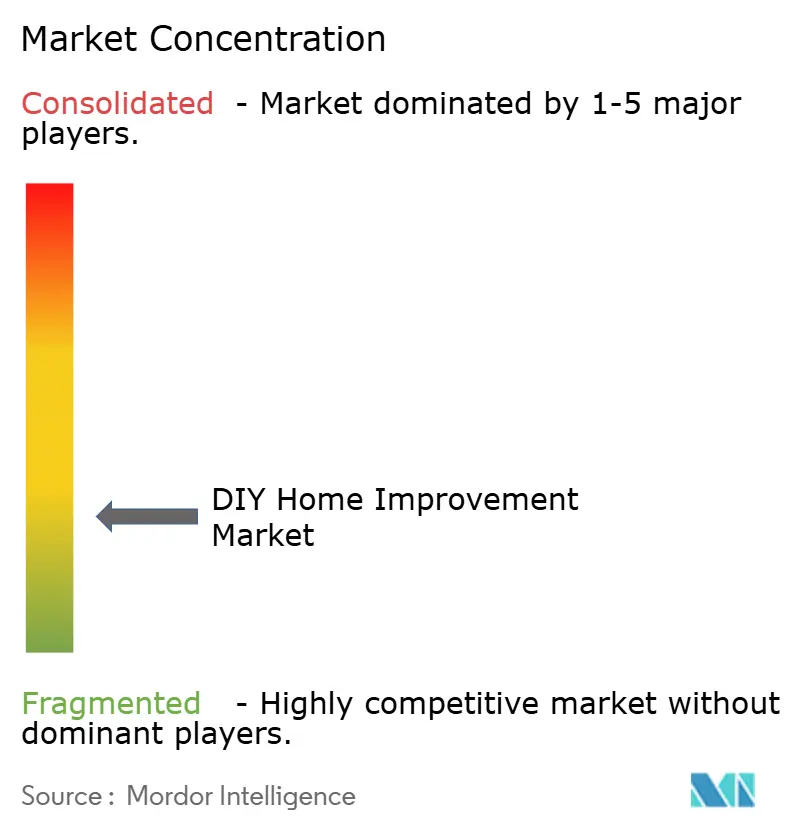
The DIY home improvement market has low market concentration, with the leading companies collectively holding a significant but not overwhelming share. This structure indicates a moderately fragmented competitive landscape, leaving ample opportunity for regional operators, smaller players, and specialized formats to expand without facing a single dominant player. Strategic priorities across leading retailers have converged around deeper professional customer engagement, stronger omnichannel execution, and tighter control of inventory and margins. Large banners that integrate dedicated distribution for bulky goods, jobsite delivery, and trade credit are better positioned to capture a greater share of professional spending while continuing to serve DIY shoppers efficiently. Marketplace participation and the use of AI for pricing and personalization have become meaningful value drivers, enabling retailers to benefit from scale and high traffic.
The Home Depot continues to invest in regional distribution infrastructure for large and heavy merchandise, improving jobsite reliability for professional customers while easing operational pressure on stores. Its omnichannel model benefits from strong digital engagement, with a significant share of online orders fulfilled through store networks to enhance speed and cost efficiency in last-mile delivery. Lowe’s is advancing its Total Home strategy with a focus on professional penetration, omnichannel growth, and expanded services. The company has also pursued targeted acquisitions to strengthen capabilities in interior finishes and project-based categories. These initiatives reflect the growing importance of projects that combine material supply with installation expertise, which generate larger revenue pools than purely DIY activity.
In Europe, Kingfisher’s multi-banner strategy emphasizes format specialization and technology deployment, including AI-driven tools that improve markdown efficiency and customer personalization. Portfolio optimization has allowed the group to concentrate on higher-return markets while continuing to expand marketplace models and digital penetration across banners. Across the competitive landscape, leading players are applying similar levers with different priorities, blending logistics upgrades, deeper category authority, digital content, and enhanced in-store experiences. Sustainability initiatives are also gaining prominence, with retailers working to reduce the environmental footprint of their operations and supply chains. Over the long term, the most resilient competitive positions are likely to emerge where logistics scale, high-quality data, and service capabilities intersect at a national scale.
DIY Home Improvement Industry Leaders
-
The Home Depot
-
Lowe’s Companies Inc
-
ADEO Group
-
Kingfisher plc
-
Menards Inc.
- *Disclaimer: Major Players sorted in no particular order
DIY Home Improvement Market Companies Covered in this Report
- The Home Depot Inc.
- Lowe’s Companies Inc.
- ADEO Group (Leroy Merlin)
- Kingfisher plc (B&Q, Screwfix)
- Menards Inc.
- Ace Hardware Corp.
- OBI GmbH
- Travis Perkins plc
- Amazon Services LLC (DIY)
- Walmart Inc. (DIY)
- Bunnings Group
- Wickes Group plc
- Hornbach Holding AG
- Canadian Tire Corp.
- Bauhaus AG
- Wilko Ltd.
- True Value Company
- Mr DIY Group
- Sodimac S.A.
- OBI-Koçtaş
Market Opportunities and Future Outlook
White space is concentrated in tools and services that reduce planning friction and execution risk for homeowners who split work between DIY and professionals. Evidence from the Home Improvement Research Institute points to a shift in mix in early 2026, with a smaller share of homeowners completing projects in Q1 2026 versus Q1 2025, but higher average project spending. Hybrid renovation models expanded to 46%, while pure DIY participation declined to 39%, supporting an opportunity for retailers and brands to bundle project-ready kits, compliant assortments, and flexible fulfillment with pro enablement (trade credit, jobsite delivery, and installed-service networks) so higher-ticket projects stay within retailer ecosystems.
Digital opportunity is moving beyond e-commerce into AI-supported discovery, estimation, and decision workflows that connect inspiration to purchasable bills of materials and scheduling. In 2026, homeowner adoption of AI tools for renovation planning reached 23%, with usage centered on comparing prices, materials, and vendors, and decision-making also influenced by contractor adoption of AI. Retailers are responding with marketplaces, personalization, and agentic shopping and project-assistant tools, which creates room for differentiated content-to-cart experiences, localized assortments, and services that reduce returns in technique-sensitive categories such as flooring systems, plumbing fixtures, and adhesives or underlayments.
Recent Industry Developments in DIY Home Improvement Market
- July 2026: The Home Depot launched delivery to APO/FPO/DPO addresses, enabling overseas military customers to buy more than 20,000 home improvement products through partnerships with the Army and Air Force Exchange Service (AAFES) and Navy Exchange Service Command (NEXCOM). This extends addressable demand through an institutional channel while testing long-distance fulfillment for small parcels and select project essentials.
- May 2026: The Home Depot completed the acquisition of Mingledorff's, LLC, an HVAC equipment and parts distributor, and integrated it into SRS Distribution. The deal deepens the companys professional supply footprint in repair and replacement categories where speed, parts availability, and contractor relationships drive repeat purchasing.
- December 2025: The Home Depot introduced the Home Depot Creator Portal to connect influencers and DIY enthusiasts with campaigns and shoppable project ideas. This strengthens the content-to-commerce funnel and supports higher conversion for project-based categories where education and step-by-step guidance influence product selection.
DIY Home Improvement Market Report Scope and Research Methodology
Market Definition and Coverage
This market is defined as the value of spending on DIY home improvement activities and the products purchased to complete them, where the homeowner or end user carries out the work without paid installation as the core condition.
Scope exclusions: We exclude stand-alone professional labor revenue for DIFM-only projects and large commercial construction that is not tied to home improvement demand.
Segments Covered in This Report
- By Product Type
- Building Materials
- Paints & Coatings
- Tools & Equipment
- Decor & Lighting
- Flooring & Tiles
- Plumbing & Electrical
- Others
- By Distribution Channel
- DIY Home Improvement Stores
- Specialty Stores
- Online
- Hypermarkets and Supermarkets
- By Project Type
- Renovation
- Remodeling
- New Construction
- By Region
- North America
- Canada
- United States
- Mexico
- South America
- Brazil
- Peru
- Chile
- Argentina
- Rest of South America
- Asia-Pacific
- India
- China
- Japan
- Australia
- South Korea
- South East Asia (Singapore, Malaysia, Thailand, Indonesia, Vietnam, and Philippines)
- Rest of Asia-Pacific
- Europe
- United Kingdom
- Germany
- France
- Spain
- Italy
- BENELUX (Belgium, Netherlands, and Luxembourg)
- NORDICS (Denmark, Finland, Iceland, Norway, and Sweden)
- Rest of Europe
- Middle East & Africa
- United Arab Emirates
- Saudi Arabia
- South Africa
- Nigeria
- Rest of Middle East & Africa
- North America
Data Sources, Market Sizing, and Validation
Desk Research
Desk research is used to build the starting demand picture, then to anchor the model to measurable signals that do not depend on retailer mix. We referenced public sources such as housing stock and homeownership indicators from the US Census Bureau, residential construction and remodeling activity from the US Census Bureau and similar national statistics offices, and macro series from the World Bank and the IMF.
We also reviewed DIY relevant safety and building guidance published by government bodies, plus product and material trend references from trade associations (such as those covering paint, tools, and building materials), along with customs and trade statistics that help sense-check cross-border flows. Company filings, investor presentations, annual reports, and reputable press were used to understand channel shifts, ticket size behavior, and category emphasis by region. Where needed, a paid subscription focused on company financials and a separate shipment-level import export database were used selectively to validate directional splits and remove obvious outliers. These examples are not exhaustive, and many other sources were consulted for data collection, validation, and clarification.
Primary Interviews and Surveys
Primary work was used to test what households actually treat as DIY work, and which categories get pulled into a project basket across regions. We spoke with retailers, brand-side product managers, distributors, and trade experts to confirm how pricing moves show up in-category, how channel mix shifts over time, and the typical share of project spend that stays DIY versus moving to assisted services. We then rechecked the key assumptions across APAC, EMEA, and the Americas.
Distribution of primary research fieldwork respondents
| Company type | Respondent position | Region |
|---|---|---|
| Top tier: 31% | CXOs: 17% | APAC: 47% |
| Mid tier: 48% | Functional/Unit leaders: 32% | EMEA: 29% |
| Smaller Players: 21% | Managers: 51% | Americas: 24% |
Market-Sizing & Forecasting
For sizing, we used a top-down approach where housing activity and repair and renovation intensity are reconstructed into an addressable DIY spend pool, and then translated into value using category-level price and mix assumptions. To avoid over-relying on any single macro series, our totals were then corroborated with selective bottom-up approximations such as sampled average selling price (ASP) times volume checks for a few high-frequency categories, and channel checks on how much spend is captured by home centers, specialty, and online.
Inputs that matter for this market include existing housing stock age, home sales and turnover, residential construction and renovation cycles, DIY participation and project frequency, and category price inflation for materials and tools. We also track regional differences in labor availability and the common shift from DIY to assisted work as project complexity rises, which helps keep the DIY-only portion realistic.
Forecasts were built using scenario analysis supported by a light multivariate regression on housing and renovation indicators, with expert feedback used to set sensible ranges for price progression and DIY participation. When bottom-up validations were sparse for smaller regions, we filled gaps using per-household spending benchmarks that were adjusted for housing stock and purchasing power, and then rechecked against trade and retailer momentum signals.
Data Validation & Update Cycle
Validation is done through repeated cross-checks, first within the model and then against outside signals that should move in the same direction. We run variance checks by region and by category to catch sudden jumps that are not supported by housing activity, price trends, or channel evidence, and those flags are reviewed in a separate analyst pass before sign-off.
Outputs are compared with independent metrics such as construction spending, home sales cycles, and reported category inflation, and we re-contact sources when the gaps are large or when a material event changes behavior (for example, a sharp rate change or a supply shock). The report is refreshed annually, with interim updates when major shifts occur, and a final pre-delivery review is completed so clients receive the most current view.
Mordor Intelligence's Diy Home Improvement Market Size Versus Other Published Estimates
Published market numbers for DIY home improvement can look far apart, even when the topic sounds the same, because the scope and the counting rules are not always aligned. Differences usually come from whether spending is treated as DIY-only or blended with professional work, how product baskets are defined, and how price changes are carried forward year to year.
The main gap comes from mixing DIFM project labor and contractor-led budgets into the same pool, while Mordor Intelligence keeps the value tied to DIY-led spending and validates the DIY share using housing activity signals and interview-based checks on when projects typically shift to assisted installation.
Benchmark comparison
| Source | Market Size | Gaps in Research Methodology |
|---|---|---|
| Mordor Intelligence | USD 0.87 T (2025) | |
| Industry Publisher A | USD 1.01 T (2025) | Uses a broader basket that appears to include a wider set of end uses and may blend DIY purchases with adjacent home improvement spending, which can lift the total even if DIY participation is not explicitly isolated. |
| Industry Publisher B | USD 0.88 T (2025) | Leans toward a narrower retail-style definition with simplified category coverage, and the price progression logic is less transparent, which can compress the base-year value depending on how inflation and channel mix are treated. |
The spread in the table mainly reflects how each publisher treats DIY versus assisted work, and whether the market is measured as a full project spend pool or as a tighter retail basket. By keeping the inputs tied to housing and renovation indicators, and then pressure-testing the DIY share and pricing assumptions through primary discussions, the final number stays traceable to clear drivers and can be repeated when the same signals update.
Key Questions Answered in the Report
What is the size of the DIY home improvement market in 2026, and how fast is it growing?
The DIY home improvement market size is estimated USD 0.93 trillion in 2026 and is projected to reach USD 1.29 trillion by 2031 at a 6.87% CAGR.
Which product categories are leading and which are growing the fastest in the DIY home improvement space?
Building Materials led with 48.33% of 2025 revenue, while Flooring and Tiles is the fastest growing category with a 7.76% CAGR through 2031.
How are channels shifting in the DIY home improvement market?
DIY home improvement stores held 68.74% of 2025 sales, and online channels are expanding at an 8.27% CAGR 2031, with about half of online orders at The Home Depot fulfilled from stores for speed and cost control.
Which regions contribute the most, and which are growing the fastest in DIY home improvement?
North America captured 39.35% of 2025 revenue, while Asia-Pacific is the fastest-growing region at a 7.87% CAGR through 2031.
What macro forces are driving steady demand in the DIY home improvement market?
An aging housing stock, owners’ willingness to renovate in place, and policy-linked energy upgrades are key structural drivers that support stable project volumes.
How are leading retailers strengthening competitive moats in DIY home improvement?
They are scaling omnichannel fulfillment, broadening marketplaces, investing in Pro logistics, and deploying AI for markdowns and personalization to lift conversion and protect margins.