
Market Overview
| Study Period | 2020 - 2031 |
|---|---|
| Market Size (2026) | USD 54.25 Billion |
| Market Size (2031) | USD 58.35 Billion |
| Growth Rate (2026 - 2031) | 1.47 % |
| Fastest Growing Market | Asia Pacific |
| Largest Market | Asia-Pacific |
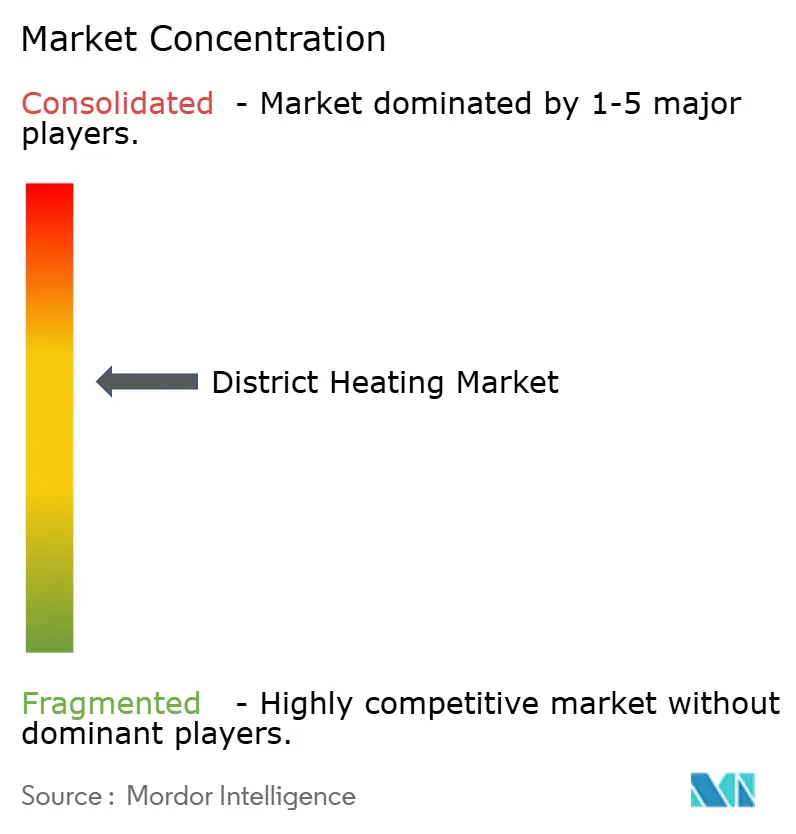
| Market Concentration | Medium |
Major Players
*Disclaimer: Major Players sorted in no particular order Image © Mordor Intelligence. Reuse requires attribution under CC BY 4.0. |
|
District Heating Market Analysis by Mordor Intelligence
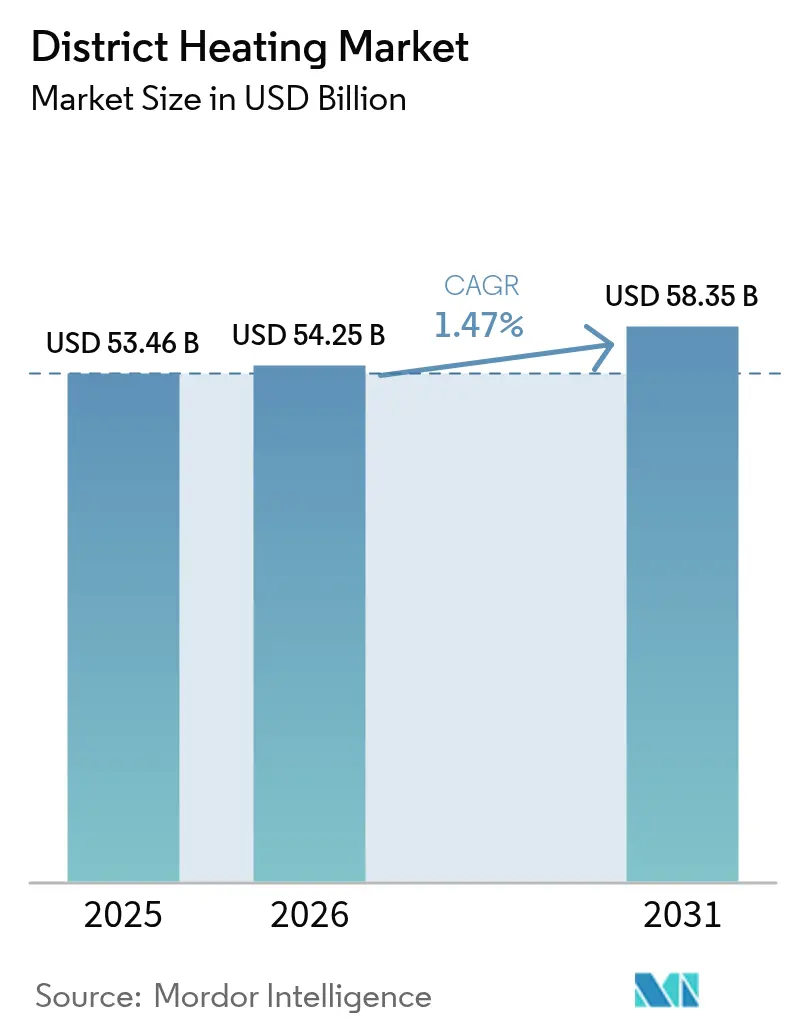
The district heating market size was valued at USD 53.46 billion in 2025 and estimated to grow from USD 54.25 billion in 2026 to reach USD 58.35 billion by 2031, at a CAGR of 1.47% during the forecast period (2026-2031). Behind this modest headline number, the district heating market is undergoing a structural realignment toward lower-temperature networks, waste-heat recovery and digital optimization. Demand is rising as data-center heat reuse projects, clean-heat regulations and industrial electrification converge, while traditional combined heat and power (CHP) assets search for new revenue models. Natural-gas reliance remains high, yet incremental gains from biomass, geothermal and solar are changing asset-planning priorities. Competitive intensity is moderate because municipal utilities, private operators and specialist energy-service companies coexist, each shaping investment cycles according to local policy signals and capital-cost profiles.
Key Report Takeaways
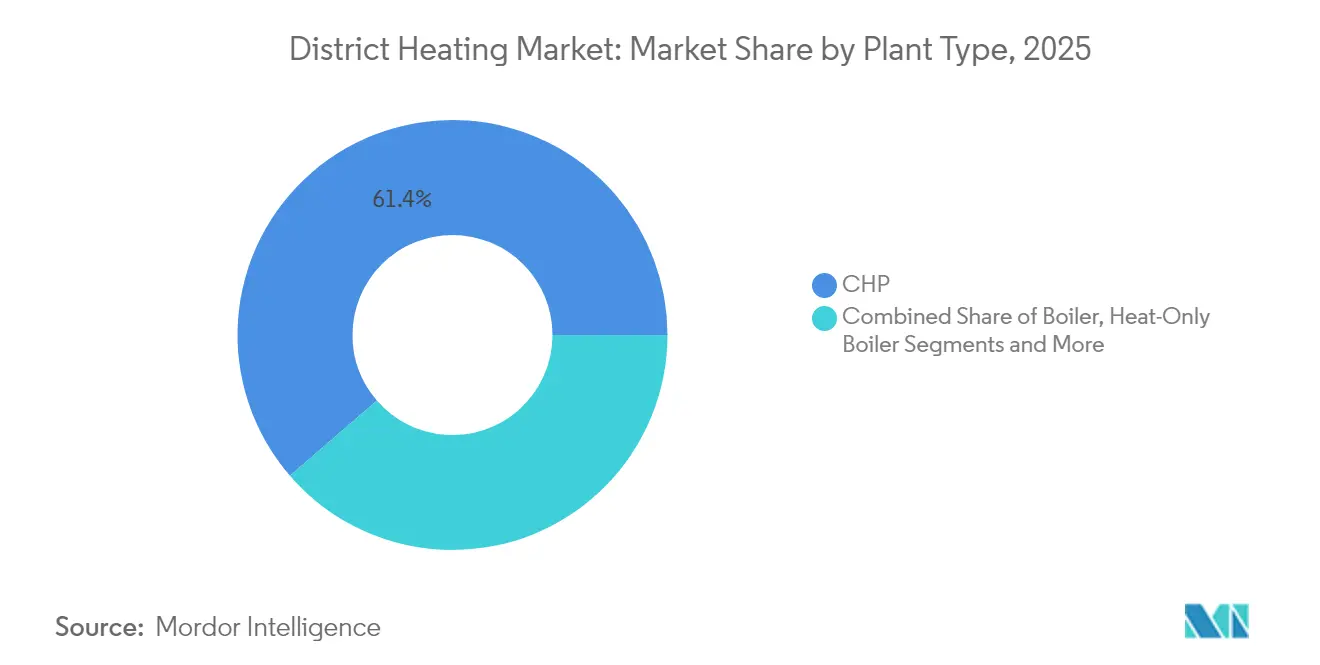
- By plant type, CHP plants led with 61.35% of the district heating market share in 2025, while waste-heat recovery units are projected to post the fastest 4.57% CAGR through 2031.
- By heat source, natural gas accounted for 44.10% of the district heating market size in 2025; renewables are expected to expand at a 5.42% CAGR to 2031.
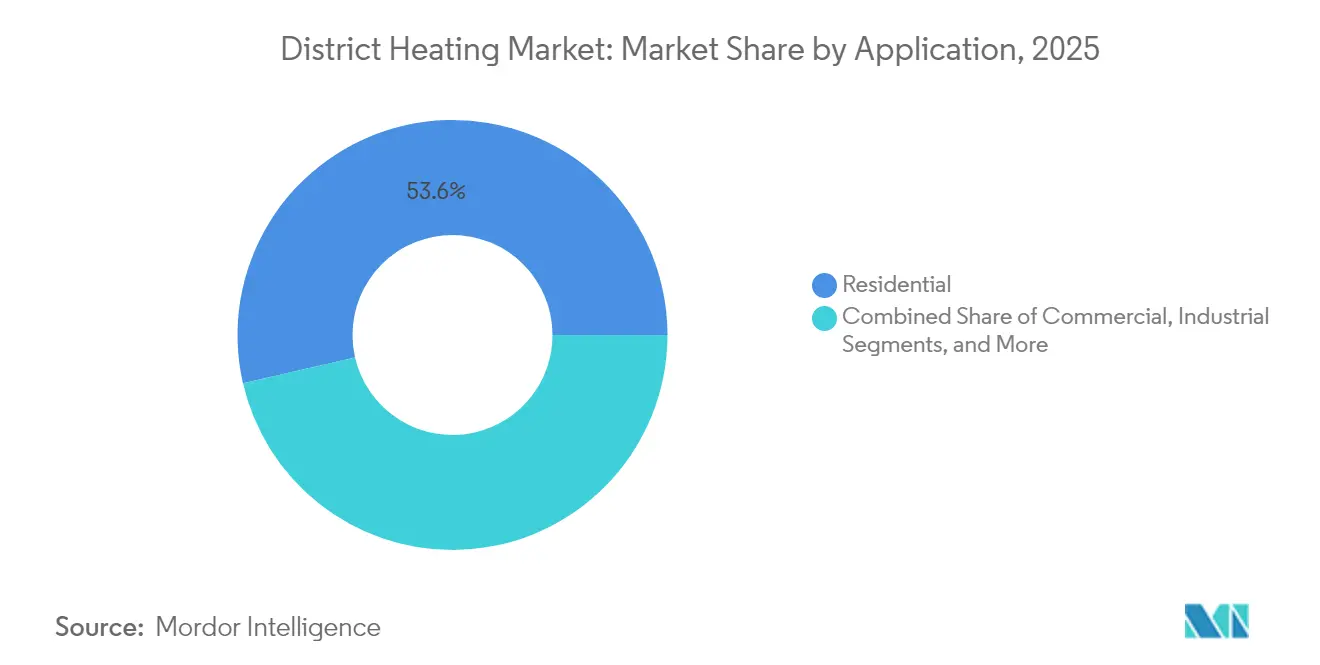
- By application, the residential segment held 53.60% of the district heating market size in 2025, whereas the industrial segment is set to grow at a 2.52% CAGR through 2031.
- By geography, Europe dominated the district heating market with the largest revenue share in 2025, and Asia-Pacific is forecast to register the quickest growth rate to 2031.
Note: Market size and forecast figures in this report are generated using Mordor Intelligence’s proprietary estimation framework, updated with the latest available data and insights as of 2026.
Market Trends and Insights
Drivers Impact Analysis of District Heating Market*
| DRIVER | (~) % IMPACT ON CAGR FORECAST | GEOGRAPHIC RELEVANCE | IMPACT TIMELINE |
|---|---|---|---|
| Mandated phase-out of fossil boilers across EU boosting retrofits | 0.7% | Europe, with spillover effects in UK and Switzerland | Medium term (2-4 years) |
| China's ultra-low-emission CHP conversions | 0.5% | China, with technology transfer to Southeast Asia | Medium term (2-4 years) |
| Municipal waste-to-energy integration in Nordic and Benelux cities | 0.4% | Nordic countries, Netherlands, Belgium | Short term (≤ 2 years) |
| 4-/5-Generation low-temperature networks using data-center waste heat | 0.3% | North America, Europe, with emerging applications in Singapore and Japan | Long term (≥ 4 years) |
| Geothermal heat tenders in Turkey & Hungary cutting LCOH < €25/MWh | 0.2% | Turkey, Hungary, Italy, with expansion to Central Europe | Medium term (2-4 years) |
| Off-site industrial process-heat PPAs in petro-chemical clusters | 0.1% | US Gulf Coast, EU Rotterdam-Antwerp cluster, Singapore | Medium term (2-4 years) |
| Source: Mordor Intelligence | |||


Mandated Phase-out of Fossil Boilers Across EU Boosting Retrofits
The European Union’s accelerated ban on oil and gas boilers is funneling retrofit demand into the district heating market.[1]European Commission, “Overview of District Heating and Cooling Markets and Regulatory Frameworks,” dbdh.org Member states aim to connect more than 40 million additional households by 2030, reducing stranded-asset risk for legacy gas grids. Retrofit programs are especially appealing in dense cities where individual heat pumps face space constraints. New rules compel large data centers to feed excess heat into municipal grids, enhancing load diversity and revenue security. Utilities in Denmark, Germany and France are therefore prioritizing low-temperature network expansion to satisfy building-owner obligations and to tap EU Innovation Fund grants for carbon-neutral heat.
China's Ultra-low-emission CHP Conversions
China’s clean-heating policy is steering the district heating market toward a hybrid portfolio of electric boilers, heat pumps and low-emission CHP facilities. Pilot projects in Hebei and Shandong demonstrate particulate-matter cuts near 90% compared with earlier coal units, while grid-connected heat pumps improve capacity-factor utilization of renewable power. The low-coal scenario outlined by academic research suggests electric technologies could supply 34% of China’s district-heat load by 2030, unlocking equipment exports to Southeast Asia.[2]Princeton University, “Diversifying China’s Urban Heating Systems Will Reduce Risk of Carbon Lock,” research.princeton.edu Provincial authorities are therefore bundling rooftop solar and thermal-storage incentives with district-heat licenses to align air-quality targets and peak-shaving goals.
Municipal Waste-to-energy Integration in Nordic & Benelux Cities
Circular-economy policy frameworks position waste-to-energy plants as anchor heat sources for city networks. Odense, Copenhagen, Amsterdam, and Leuven now transform waste disposal costs into heat revenue streams, generating local jobs and mitigating imported-fuel exposure.[3]Agora Energiewende, “Boosting the Clean Heat Market,” agora-energiewende.org Community-owned models secure social licence, and public procurement rules pre-qualify waste heat for renewable-energy certificates, trimming payback periods. The district heating market therefore benefits from predictable cashflow and faster permitting compared with greenfield gas infrastructure. Replication potential is high because modern flue-gas treatment keeps emissions below EU Industrial Emissions Directive thresholds.
4th and 5th-generation low-temperature networks using data-center waste heat
Digital-infrastructure growth is producing abundant low-grade heat that was previously vented. Next-generation networks operate under 70 °C, reducing line losses and allowing direct integration of 25–35 °C server-rack exhaust, with heat pumps lifting temperatures for domestic-hot-water delivery. Projects in Berlin, Helsinki and Dublin illustrate new revenue channels for data-center owners, who can offset cooling expenses while district-heating operators secure guaranteed baseload. As global data-center electricity demand could double by 2030, the district heating market is set to capture a parallel rise in recoverable thermal energy, driving investment in smart valves, digital twins and stratified storage tanks.
Restraints Impact Analysis of District Heating Market*
| RESTRAINTS | (~) % IMPACT ON CAGR FORECAST | GEOGRAPHIC RELEVANCE | IMPACT TIMELINE |
|---|---|---|---|
| High grid-connection fees (less than €800/kW) in low-density U.S. regions | -0.2% | United States, primarily in suburban and rural areas | Short term (≤ 2 years) |
| Uncertain gas-price-cap regimes in Eastern Europe affecting CHP economics | -0.15% | Eastern Europe, particularly Poland, Czech Republic, and Hungary | Medium term (2-4 years) |
| Skilled-labour shortages delaying low-temperature retrofits | -0.1% | Germany, United Kingdom, with emerging impacts in France and Italy | Medium term (2-4 years) |
| Heat-user lock-in perceptions limiting green-bond financing | -0.05% | Global, with pronounced effects in emerging markets | Long term (≥ 4 years) |
| Source: Mordor Intelligence | |||
High grid-connection fees in low-density U.S. regions
New district-heating lines in suburban America face connection fees above €800/kW, undermining project feasibility where density is low. Fragmented state regulations and lack of federal incentives amplify financial risk, slowing adoption despite high decarbonization potential. Few municipal utilities possess the balance-sheet strength to underwrite long-tenor loans without revenue guarantees. The Climate Catalyst Program in California has begun to de-risk data-center heat-reuse schemes, but broader policy harmonization is required to transplant those gains to the Midwest and Northeast. Without a clear tariff model, prospective customers hesitate, dampening network build-out beyond campus and military installations.
Uncertain gas-price-cap regimes in Eastern Europe affecting CHP economics
Temporary gas-price caps shield consumers but create planning ambiguity for CHP operators that dominate district networks in Poland and Hungary. Capital-intensive retrofits to biomass or electrified boilers are postponed because payback periods cannot be modeled under volatile cap extensions. A Wärtsilä study indicates potential savings of EUR 3.8 billion by 2032 if price-signals align with flexible district-heat dispatch, yet regulatory clarity remains elusive. Until predictable market-based pricing is restored, lenders will demand higher risk premia, slowing modernization and dampening the district heating market’s transition pace in the region.
*Our forecasts treat driver/restraint impacts as directional, not additive. The impact forecasts reflect baseline growth, mix effects, and variable interactions.
District Heating Market Segment Analysis
By Plant Type:
Waste-heat recovery reshapes economicsWaste-heat recovery stations are forecast to expand at a 4.57% CAGR from 2026-2031, well above the overall district heating market. Project economics benefit from avoided primary-fuel costs and new corporate-power-purchase-agreement models that monetise decarbonization attributes. In contrast, CHP retained 61.35% of the district heating market share in 2025, anchoring the district heating market size for baseload supply and grid-balancing services. Asset operators are now pairing thermal storage with CHP to shift run-times toward peak-price hours and to accommodate surplus renewable generation. Heat-only boiler houses hold niche value for peak-shaving and for small networks where full CHP cycles are uneconomic.
The district heating market sees heightened interest in modular heat-pump clusters and data-center tie-ins, which reduce distribution temperatures and enable flexible, multi-vector configurations. Industrial sites appreciate these systems for simultaneous process cooling and steam-raising, while municipalities gain resilience from supply diversification. Standardised skid designs shorten construction cycles and unlock Build-Own-Operate-Transfer contracts attractive to infrastructure funds. Over the forecast period, integration of stratified buffer tanks is expected to smooth diurnal load swings, reducing operational expenditure and permitting higher variable-renewable-energy penetration.


By Heat Source:
Renewables lead decarbonization effortsRenewables are projected to be the fastest-growing component of the district heating market, delivering a 5.42% CAGR and adding geothermal doublets, agro-biomass boilers and solar-thermal fields to existing grids. European cities are bundling geothermal drilling risk into national guarantee funds, cutting financing costs and accelerating project sanction. Solar-thermal growth is propelled by 28 large fields commissioned in 2023 alone, adding 139 MWth to the district heating market size for clean heat. Natural gas, while still holding 44.10% of the district heating market size in 2025, faces carbon-price escalation and methane-leak scrutiny.
Industrial waste heat is emerging as a bridge resource, filling gaps until deeper renewable integration materialises. Economics depend on pipeline distance and temperature lift, but rising carbon prices improve payback. Nuclear-based heat using small modular reactors garners policymaker interest for process-steam applications yet remains contingent on siting approvals. Overall, heat-source diversification lowers geopolitical exposure and aligns with EU taxonomy rules that will increasingly shape capital flows into the district heating industry.
By Application:
Industrial sector drives innovationIndustrial demand is projected to be the quickest-growing application, with a 2.52% CAGR, powered by rising carbon-border-adjustment pressures on goods with embedded emissions. Chemical, pulp-and-paper and food-processing sites deploy large-capacity heat pumps that cut fuel bills up to 70% and supply return heat to nearby communities. District-scale hydrogen electrolysers also elevate waste-heat availability. Residential customers nevertheless remain the backbone, accounting for 53.60% of the district heating market share in 2025 and providing stable year-round baseload that underpins debt-service covenants.
Commercial and public buildings contribute mixed load profiles that help flatten demand curves. Municipalities now integrate building-renovation grants with network expansions, reducing volumetric demand while enhancing financial viability through higher connection density. Mixed-use real-estate developments increasingly stipulate readiness for low-temperature district heating in zoning approvals, future-proofing projects against tightening building-emission codes. These application-level shifts collectively reinforce the resilience of the district heating market across economic cycles.
By Temperature Regime:
Low-temperature networks unlock new heat sourcesLow-temperature grids operating below 70 °C are emerging as the most dynamic technology tier within the district heating market because they can absorb heat that was previously unusable, such as 25–35 °C server-rack exhaust from data centers. Fourth- and fifth-generation schemes cut distribution losses, reduce pumping energy and simplify customer-side installations that no longer need high-pressure components. Municipalities see additional value in pairing these networks with large water-tank or pit-storage units that shift heat captured at off-peak hours into morning and evening demand windows, improving asset utilization without burning extra fuel. Lower flow temperatures also reduce corrosion rates inside legacy pipes, extending asset life and trimming maintenance budgets.
The successful Berlin “Das Neue Gartenfeld” project illustrates how data-center operators and utilities share investment and revenue when low-temperature return lines carry up to 8 MW of reused heat to 10,000 residents. Nordic cities are following a similar path, encouraged by regulations that oblige facilities larger than 1 MW electrical load to demonstrate heat-reuse feasibility, turning compliance costs into a predictable income stream. Equipment suppliers now offer modular heat-pump skids sized for 0.5–5 MW that can be installed curbside, accelerating rollout timelines and easing financing. As more jurisdictions cap boiler temperatures in new buildings, developers view connection readiness to low-temperature grids as a future-proof amenity that enhances property value. Collectively, these factors position low-temperature networks as a cornerstone of next-decade growth in the district heating market.
Geography Analysis
North America District Heating Market
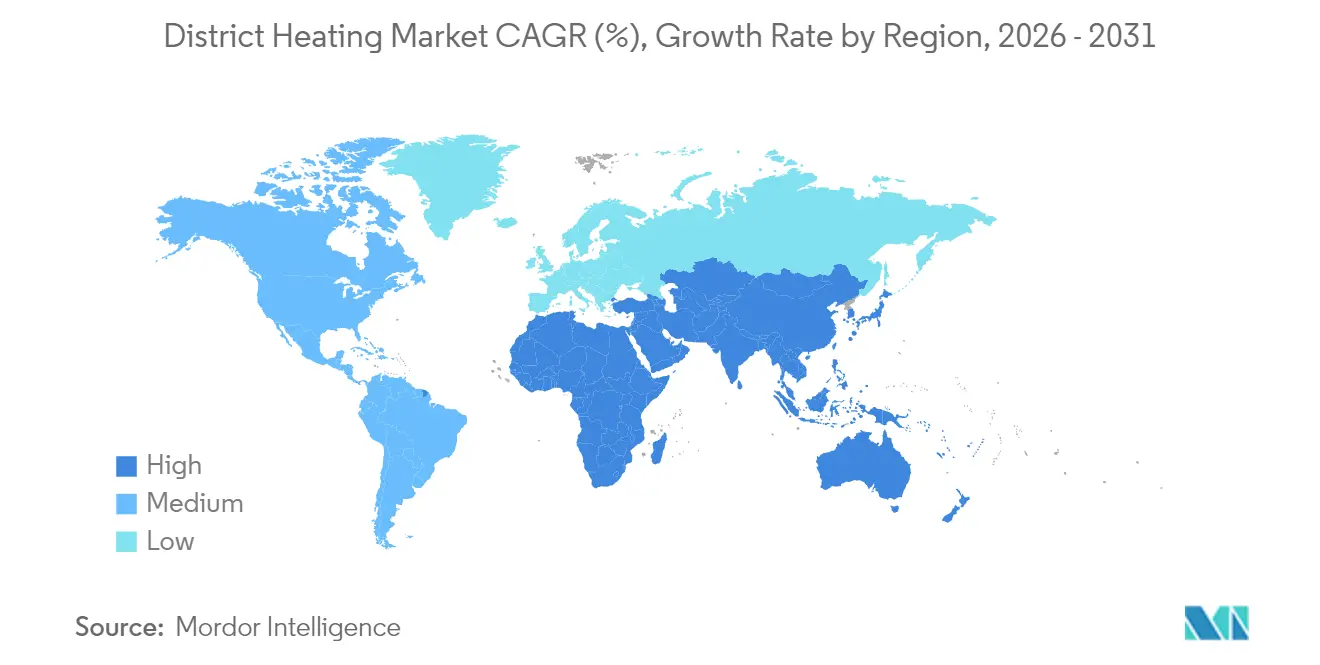
North America’s district heating market is pivoting from campus-based steam networks to mixed-temperature systems that recover industrial and data-center waste heat. Projects such as the Bellingham Waterfront redevelopment in Washington showcase heat networks four times more efficient than legacy gas boilers. Yet the region grapples with high grid-connection fees that dampen suburban uptake, highlighting the need for harmonised incentives and tariff reform to unlock broader potential. California’s new statute qualifying data-center heat capture for state finance exemplifies progressive policy carving out new corridors of growth.
Europe District Heating Market
Europe continues to command the largest share of the district heating market owing to extensive legacy pipework and ambitious decarbonization mandates. Denmark illustrates best practice, with 63% of its data centers planning surplus-heat offtake agreements. Germany targets 50% renewable and recycled heat in its grids by 2030, stimulating demand for biomass gasifiers, geothermal, and large-scale solar-thermal parks. Ownership diversity—municipal in Denmark, private in the Netherlands—yields heterogeneous investment models but collectively sustains technology leadership and export capability.
APAC, Europe and Oceania District Heating Market
Asia-Pacific, anchored by China, offers the strongest volumetric growth prospects for the district heating market. Market-oriented reforms have lifted total-factor productivity among Chinese heating enterprises by up to 7.4% since 2003, setting the stage for cleaner fuel substitution. Japan and South Korea pursue dense urban networks that capitalise on high load factors, while Turkey and New Zealand pilot deep-geothermal feeds. Regional policy now links air-quality targets with renewables uptake, encouraging integrated planning that accelerates network expansion and modernisation.

Regulatory Landscape
Policy is tightening around emissions intensity, system efficiency, and planning for urban heat infrastructure, with Europe setting the pace. Under the EU Energy Efficiency Directive (EU 2023/1791), from 1 January 2025 Member States must require heating and cooling systems above 5 MW to qualify as Efficient District Heating and Cooling (EDHC) or to prepare a transformation plan, shifting operator focus from incremental retrofits to documented decarbonization roadmaps.
At the same time, the EU is tightening support pathways for fossil equipment: Directive (EU) 2024/1275 prohibits Member States from granting financial incentives for stand-alone fossil-fuel boilers in buildings from 1 January 2025 (with limited hybrid exceptions). From 1 January 2026, EDHC systems face a 150 g GHG per kWh of heat and cold output threshold, which reinforces investment in lower-temperature networks, waste-heat recovery, and electrified heat production. In the United Kingdom, the Department for Energy Security and Net Zero has outlined heat network zoning implementation, including plans to establish a Heat Network Zoning Authority by end-2026, with Ofgem administering a rights and powers regime through secondary legislation, moving heat networks closer to utility-style regulation and standardized build-out obligations.
Value Chain Analysis
The district heating value chain runs from heat production (CHP, boilers, large heat pumps, waste-to-energy and waste-heat recovery), to distribution infrastructure (pre-insulated pipes, pumping stations, thermal storage, substations), to end-use connection layers (heat exchangers, meters, valves and building energy management). Municipal utilities and private operators typically anchor network ownership and customer contracting, while EPC contractors and specialized engineering consultants design and deliver network expansions, conversions from steam to low-temperature hot water, and the integration of new heat sources such as industrial and data-center waste heat.
Digital and automation suppliers increasingly sit alongside mechanical equipment vendors, offering IoT telemetry, distributed control systems, and optimization software to manage multi-source dispatch and keep operating temperatures lower. TIM Enterprise and GETEC, for instance, commissioned a Rozzano, Italy project to recover residual data-center heat for district heating supply to more than 5,000 households, widening the pool of usable thermal inputs. On the operations side, Valmet announced automation delivery for Helen Ltd’s Patola air-to-water heat pump plant in Helsinki, highlighting how DCS and advanced controls have become important for integrating large electrified assets and maintaining hydraulic stability as networks add heat pumps, electric boilers and variable waste-heat streams.
Competitive Landscape
The district heating market features a balanced mix of municipal utilities, multinational energy majors and infrastructure funds cultivating long-duration cashflows. Publicly owned Danish operators emphasise community dividends and long-term tariff stability, whereas private Dutch entities focus on operational excellence and tech-enabled optimisation. Market consolidation is driven by infrastructure-fund appetite for inflation-linked revenue; recent acquisitions in Northern Europe and the UK demonstrate growing institutional confidence in heat-network returns.
Strategic alliances anchor many headline projects. Vattenfall manages 5,600 km of pipe and 9.9 GW of capacity across four countries, leveraging city partnerships to phase out coal and adopt biomass and waste-heat sources. Data-center operators form joint ventures with utilities to monetise server-rack exhaust; these collaborations yield new recurring income and reduce cooling costs. Technology suppliers specialise in digital twins, advanced plate heat exchangers and pit-thermal-storage systems, carving niche leadership and exporting know-how to emerging markets.
Competitive differentiation increasingly revolves around system-control software and flexible-financing packages rather than commodity heat sales alone. Operators offering turnkey waste-heat integration, tariff-design advisory and performance-contracting structures secure premium margins. The district heating industry is therefore migrating toward platform plays where hardware, software and finance intertwine, raising entry barriers for purely fuel-based competitors and rewarding innovation and partnership agility.
District Heating Industry Leaders
-
Vattenfall AB
-
ENGIE SA
-
Fortum Oyj
-
Ørsted A/S
-
Danfoss A/S
- *Disclaimer: Major Players sorted in no particular order
District Heating Market Companies Covered in this Report
- Vattenfall AB
- ENGIE SA
- Fortum Oyj
- Ørsted A/S
- Danfoss A/S
- Veolia Environnement SA
- Statkraft AS
- NRG Energy Inc.
- Keppel Corporation Ltd.
- SP Group
- Korean District Heating Corp.
- Copenhagen Energy
- Logstor A/S
- Vital Energi Ltd.
- Alfa Laval AB
- Ramboll Group A/S
- Shinryo Corporation
- FVB Energy Inc.
- FortisBC Energy Inc.
- Kelag Waerme GmbH
- Empower Energy Solutions (Dubai)
- Helen Oy

Market Opportunities and Future Outlook
A key opportunity is converting legacy, fuel-heavy systems into low-temperature, multi-source networks that can absorb wastewater heat, waste-to-energy output, and data-center waste heat, while reducing distribution losses. This is reflected in 2026 project activity: Enercity AG began construction of a 30 MW wastewater-based heat pump in Hanover backed by EUR 22.5 million of federal funding, and later announced a 50 MW power-to-heat plant in the same city. Together, these initiatives support the case for electrified heat and grid-flexibility services within district heating portfolios.
Network digitalization and advanced control also represent investable whitespace, especially for large systems coordinating multiple heat sources and temperature regimes. Veolia Warsaw partnered with Gradyent in April 2026 to deploy an end-to-end digital twin across its district heating system, supporting temperature and pressure optimization and multi-source coordination at scale. In parallel, long-horizon pipe programs and zoning-linked build-outs keep demand steady for pre-insulated piping, civil works, and customer connection hardware, as seen in Denmark where NCC signed a contract under the Värmeplan 2030 program in Herlev covering 46 km of distribution pipe for 1,700 households. Public-sector modernization programs are likewise expanding the addressable base for low-temperature conversions and chilled-water integration, as demonstrated by the Government of Canada launching the National Capital Region District Energy System in Ottawa and Gatineau with 200 MW heating and 150 MW cooling capacity using a modernized low-temperature hot-water and electric chiller configuration.
Recent Industry Developments in District Heating Market
- May 2026: Fortum started heat production at large-scale heat pump plants in Kolabacken and Hepokorpi, Finland, recovering waste heat from Microsoft data centers. The move links data center growth directly to district heating supply and reduces reliance on combustion-based heat during periods of high fuel price volatility.
- April 2026: The City of Paris awarded a 25-year concession for the Paris district heating network through a newly formed SEMOP involving Dalkia, Eiffage, and RATP, anchored by a EUR 3.4 billion investment program. Long-duration concessions of this scale reinforce the role of public-private governance models for network decarbonization and pipework modernization in dense European cities.
- May 2025: Partners Group acquired a district-heating platform in Northern Europe, highlighting continued infrastructure-fund participation in heat networks. The transaction supports consolidation dynamics and brings additional balance-sheet capacity for large retrofit programs tied to renewable and waste-heat integration.


District Heating Market Report Scope and Research Methodology
Market Definition and Coverage
For this report, the district heating market covers commercial activity tied to producing usable heat at centralized plants and delivering it through a piped network to multiple buildings for space and water heating.
Scope exclusions: We exclude on-site building boilers that do not supply a shared network and also exclude standalone district cooling systems where cooling is not sold as part of the heat network.
Segments Covered in This Report
-
By Plant Type
- Boiler
- Combined Heat and Power (CHP)
- Heat-Only Boiler
- Waste-Heat Recovery Plants
-
By Heat Source
- Coal
- Natural Gas
-
Renewables
- Biomass
- Geothermal
- Solar Thermal
- Industrial Waste-Heat
- Oil and Petroleum Products
- Nuclear (SMR-based heat)
-
By Distribution Temperature Tier
- High Temperature (> 100 °C)
- Medium Temperature (80–100 °C)
- Low Temperature (< 80 °C, 4G/5G)
-
By Network Type
- Closed-Loop
- Open-Loop
-
By Plant Capacity
- less than equals to 50 MWth
- 51–200 MWth
- 201–500 MWth
- greater than equals to 500 MWth
-
By Ownership Model
- Public Utility
- Private Utility
- Public-Private Partnership
-
By Application
- Residential
- Commercial
- Industrial
- Public and Institutional
-
By Geography
-
North America
- United States
- Canada
- Mexico
-
South America
- Brazil
- Argentina
- Rest of South America
-
Europe
- Germany
- Sweden
- Denmark
- Finland
- United Kingdom
- France
- Rest of Europe
-
Asia-Pacific
- China
- Japan
- South Korea
- India
- Rest of Asia-Pacific
-
Middle East
- Saudi Arabia
- United Arab Emirates
- Turkey
- Rest of Middle East
-
Africa
- South Africa
- Egypt
- Rest of Africa
-
North America
Data Sources, Market Sizing, and Validation
Desk Research
We start by mapping district heating demand and supply using public energy and heat statistics, then align those flows to how networks are built and operated across major regions. Common inputs include the International Energy Agency, national energy ministries and statistical offices, Eurostat for heat and energy balances, and the UN Comtrade database for trade flows of key equipment.
On the system side, we also review district heating association publications and regulator releases, such as network expansion plans and decarbonization roadmaps, plus peer-reviewed studies on heat losses, low-temperature networks, and waste heat integration. Company annual reports, investor decks, and project announcements are used to sanity check capacity additions and heat-source shifts across observed timelines. Where needed, we also reference paid company financials and intelligence subscriptions, an import-export shipment-level database, and a patent database to clarify ownership structures, equipment trends, and commercialization pace. The sources listed here are illustrative only, and additional public references were used for data collection, validation, and research clarification.
Primary Interviews and Surveys
Next, we speak with utilities, municipal network operators, engineering and construction stakeholders, and large heat customers to confirm network build-out timing and realistic utilization levels. For a global market like this, we balanced responses across APAC, EMEA, and the Americas so region-level assumptions on tariffs, fuel switching, and retrofit pace could be checked before totals were finalized.
Distribution of primary research fieldwork respondents
| Company type | Respondent position | Region |
|---|---|---|
| Top tier: 27% | CXOs: 12% | APAC: 38% |
| Mid tier: 53% | Functional/Unit leaders: 41% | EMEA: 37% |
| Smaller Players: 20% | Managers: 47% | Americas: 25% |
Market-Sizing & Forecasting
A top-down model is built by reconstructing district heat demand from energy-balance heat consumption, then filtering it through district heating penetration, network coverage, and typical delivered-heat pricing to convert into market value. To keep the totals grounded, we corroborate them with selective bottom-up checks, including sampled network operator revenue, installed capacity ranges for CHP and heat-only boilers, and simple volume times average tariff calculations for a set of representative systems.
Key inputs that move the model include connected building stock, delivered heat volumes (GJ or MWh), tariff levels and indexation rules, fuel mix shifts toward gas, biomass, and waste heat, average network heat losses, and the rollout pace of low-temperature networks and heat pumps. When a country series is missing, we fill gaps using regional analogs and transparent proxy logic, then verify with interview checks to avoid unrealistic jumps.
For forecasting, we run scenario analysis and then narrow to the most likely path after discussions with experts on policy support, retrofit timelines, and fuel price pass-through behavior. The outlook is translated into annual market values by applying expected tariff progression and utilization changes to the projected delivered-heat volumes.
Data Validation & Update Cycle
Each stage is cross-checked against independent signals, including published heat-network volumes, announced plant additions, and observed tariff movements, so outliers can be flagged early. If a country result looks inconsistent with its connected load or fuel mix trajectory, we re-check assumptions and, when needed, re-contact stakeholders to confirm what changed.
Before sign-off, the model and key assumptions go through multiple analyst reviews, with variance checks across regions so the totals reconcile with underlying drivers. Reports are refreshed annually, and interim updates are made when material events occur, including policy changes, major network expansion approvals, or fuel supply disruptions. Right before delivery, a final analyst pass is completed so clients receive the most current view.
Mordor Intelligence's District Heating Market Size Measured Against Other Published Estimates
Published market sizes for district heating often do not match because the scope is not consistent, and different price bases and update timing can add additional spread. In our checks, the largest differences typically come from whether a figure counts only heat-network revenues or also includes broader district energy items.
Some external estimates appear to bundle district heating with adjacent district energy services and a wider set of network-related spending, which can inflate the value even if delivered heat volumes are similar. For Mordor Intelligence, the count is limited to district heating as a delivered-heat market, with validation anchored in heat volumes, network reach, and realistic tariffs by region so the USD total ties back to observable demand signals.
Benchmark comparison
| Source | Market Size | Gaps in Research Methodology |
|---|---|---|
| Mordor Intelligence | USD 54.25 B (2026) | |
| Global Consultancy A | USD 174.45 B (2025) | Uses a much broader value pool that can reflect wider district energy system spending and related services alongside heat delivery, and the year reference differs, which together lifts the reported total. |
| Industry Publisher B | USD 179.77 B (2026) | Often reported as a larger district energy style market, with less transparent separation between heat-network revenue and adjacent infrastructure or plant value, which can push the number upward even when the core heat market is similar. |
The table shows that most of the gap is explained by scope and what is being monetized, not by growth expectations alone. By keeping the sizing tied to delivered heat volumes, network coverage, and tariff logic that can be rechecked, the estimate remains traceable and easier to replicate when assumptions are updated.


Key Questions Answered in the Report
What is the current size of the district heating market?
The district heating market size is USD 54.25 billion in 2026 and is projected to reach USD 58.35 billion by 2031.
Which plant type holds the largest share?
Combined heat and power plants captured 61.35% of the district heating market share in 2025.
Where is the fastest growth expected geographically?
Asia-Pacific, led by China, is forecast to record the highest growth as urban demand and clean-heating mandates accelerate network build-outs.
How are data centers influencing the district heating market?
Data-center waste-heat recovery is expanding next-generation low-temperature networks, cutting cooling costs for operators and supplying clean heat to surrounding communities.
Which heat source segment is growing quickest?
Renewables, including biomass, geothermal and solar-thermal, are forecast to grow at a 5.42% CAGR, outpacing all other heat sources through 2031.
What limits district-heating expansion in North America?
High grid-connection fees exceeding €800/kW in low-density areas and fragmented state regulations remain the primary barriers to large-scale rollout.
Page last updated on:


 Your data is secure and never sold or shared.


