
Distribution Feeder Automation System Market Size and Share
Market Overview
| Study Period | 2021 - 2031 |
|---|---|
| Market Size (2026) | USD 5.56 Billion |
| Market Size (2031) | USD 7.92 Billion |
| Growth Rate (2026 - 2031) | 7.32 % |
| Fastest Growing Market | Asia Pacific |
| Largest Market | North America |
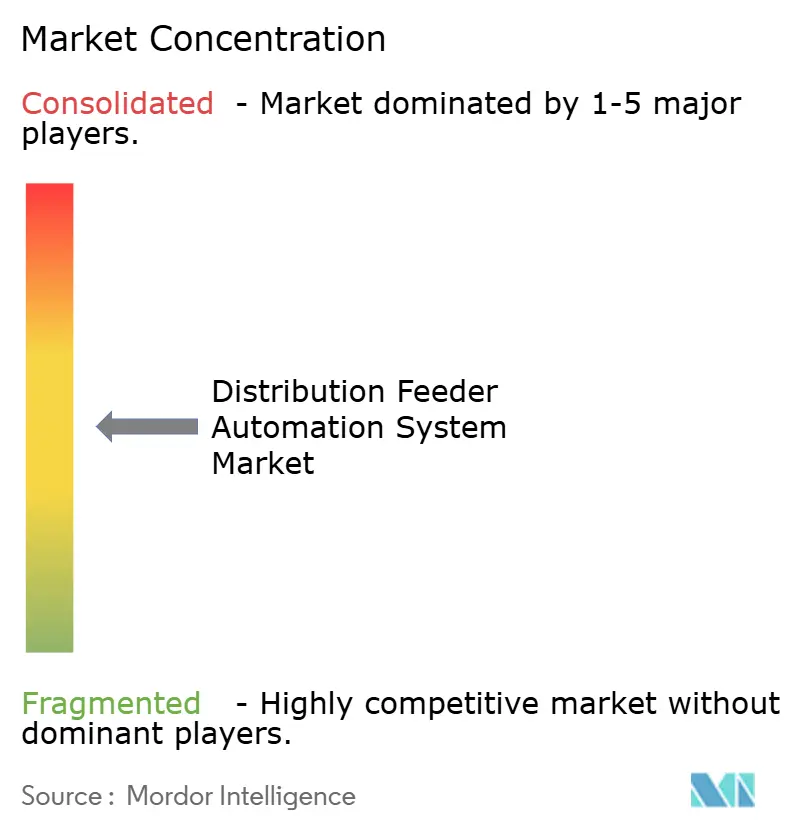
| Market Concentration | Medium |
Major Players *Disclaimer: Major Players sorted in no particular order Image © Mordor Intelligence. Reuse requires attribution under CC BY 4.0. | |
Distribution Feeder Automation System Market Analysis by Mordor Intelligence
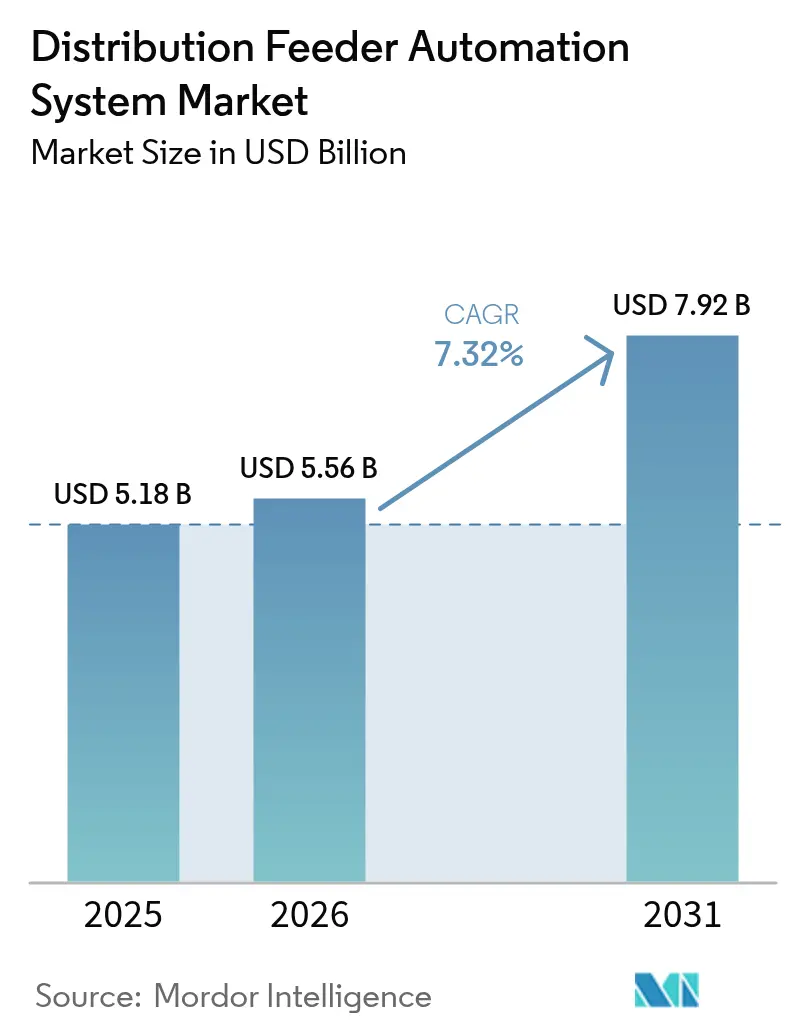
The Distribution Feeder Automation System Market size is expected to grow from USD 5.18 billion in 2025 to USD 5.56 billion in 2026 and is forecast to reach USD 7.92 billion by 2031 at 7.32% CAGR over 2026-2031.
Regulatory mandates that force utilities to modernize aging assets, the cost advantage of AI-powered fault-prediction analytics, and unprecedented public funding for climate-resilient grids combine to create sustained demand. North America remains the revenue leader, yet Asia-Pacific’s double-digit expansion rate indicates an impending geographic rebalancing. Utilities are increasingly prioritizing software-centric solutions that extend the value of installed hardware, while a surge of mergers among electrical distributors indicates that scale and technology integration now dictate competitive advantage.
Key Report Takeaways
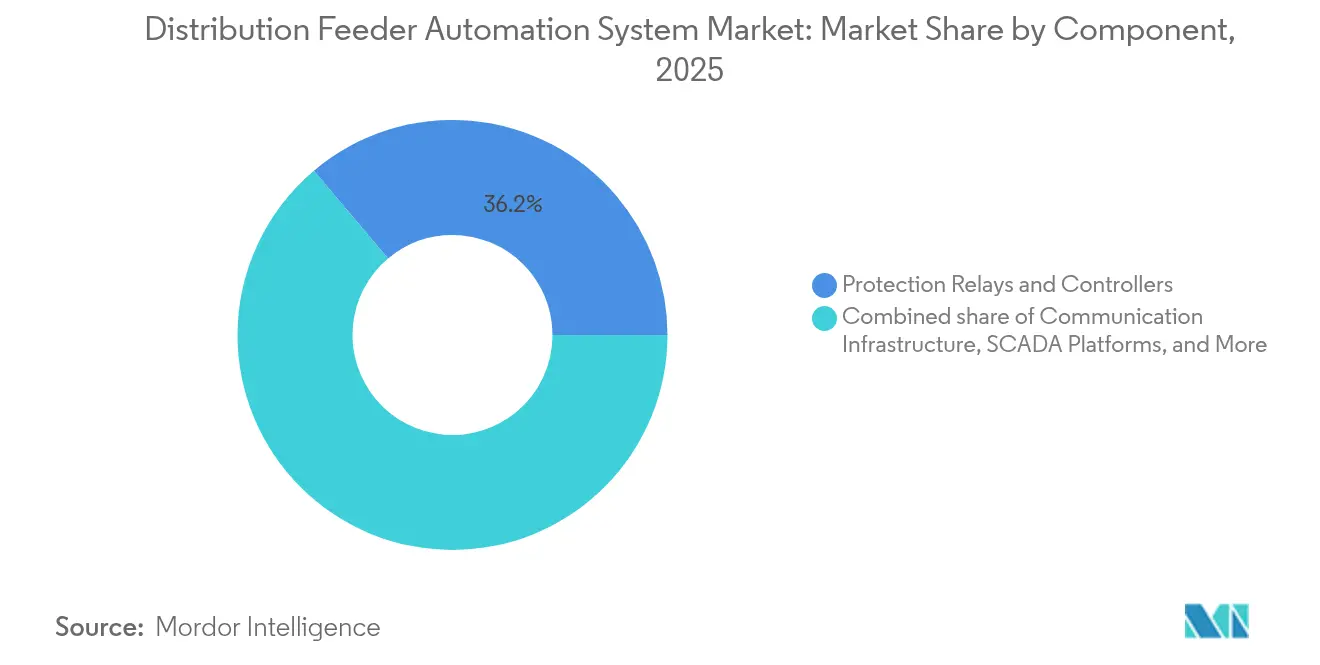
- By component, protection relays and controllers commanded a 36.15% market share of the distribution feeder automation system in 2025; communication infrastructure is projected to expand at a 10.6% CAGR through 2031.
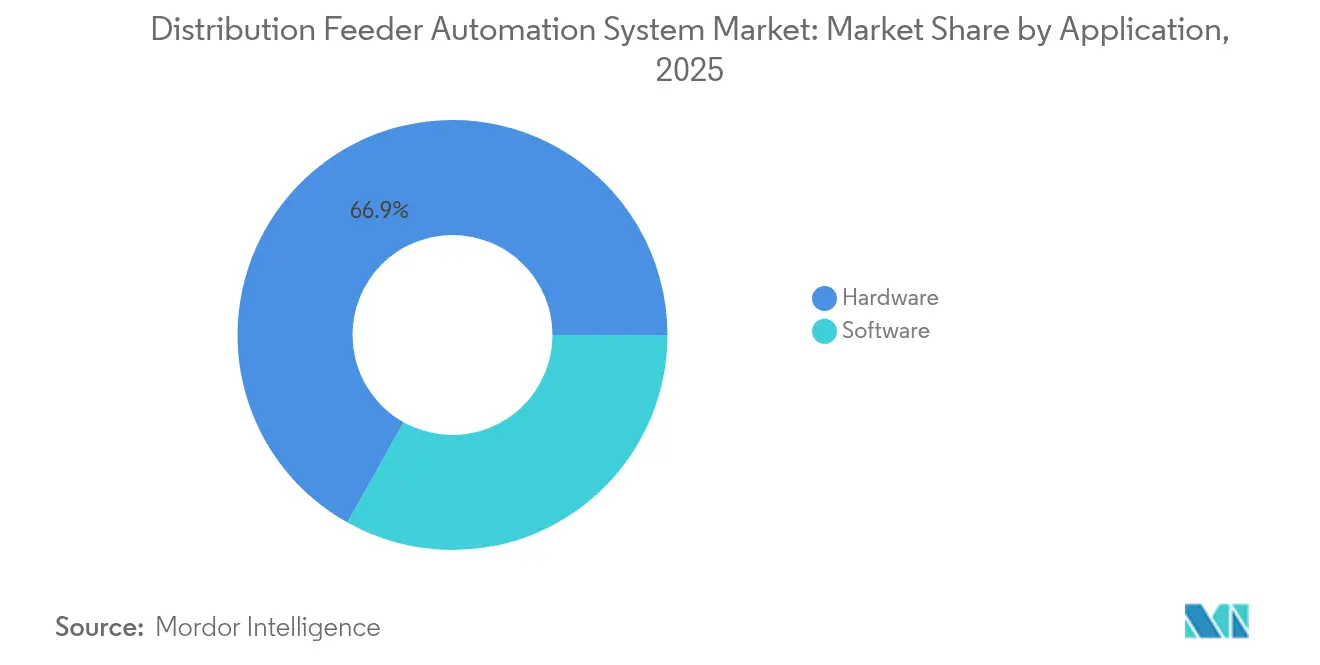
- By application, hardware accounted for 66.88% of the distribution feeder automation system market size in 2025, whereas software solutions are projected to advance at a 9.6% CAGR through 2031.
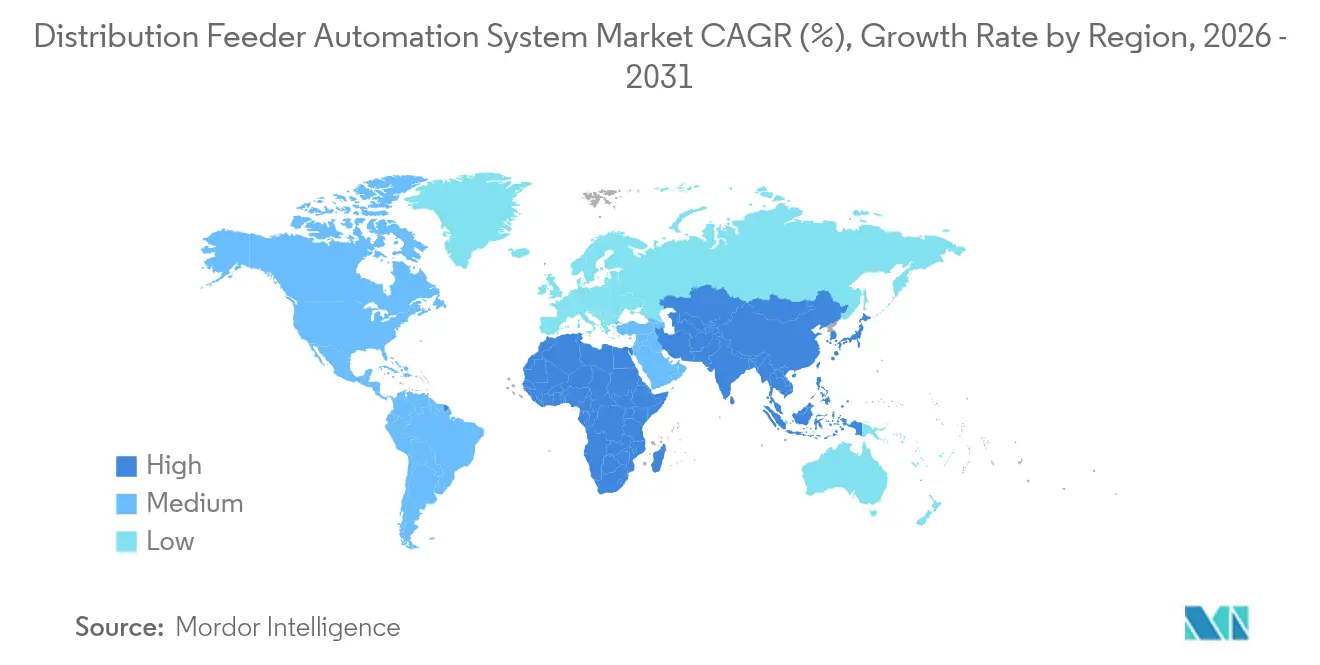
- By geography, North America led with a 31.75% revenue share in 2025, while the Asia-Pacific region is forecast to post the fastest growth of 10.1% CAGR between 2026 and 2031.
Note: Market size and forecast figures in this report are generated using Mordor Intelligence’s proprietary estimation framework, updated with the latest available data and insights as of 2026.
Market Trends and Insights
Drivers Impact Analysis of Distribution Feeder Automation System Market*
| Driver | (~) % Impact on CAGR Forecast | Geographic Relevance | Impact Timeline |
|---|---|---|---|
| Rapid grid-modernization mandates | +1.8% | North America, EU, emerging APAC | Medium term (2-4 years) |
| Rising penetration of distributed generation (DER) | +1.5% | APAC and North America | Long term (≥ 4 years) |
| Ageing feeder infrastructure replacement cycles | +1.2% | North America, EU | Long term (≥ 4 years) |
| Utility-led digital-substation retrofit programs (OT-IT convergence) | +1.0% | Global developed markets | Medium term (2-4 years) |
| Surge in climate-resilient grid investment funds | +0.9% | Climate-vulnerable regions | Short term (≤ 2 years) |
| AI-driven fault-prediction analytics adoption | +0.7% | North America, EU, expanding APAC | Medium term (2-4 years) |
| Source: Mordor Intelligence | |||
Rapid Grid-Modernization Mandates
Federal and multilateral programs now channel record sums into grid resilience, providing utilities with budget certainty to invest in distribution feeder automation system projects. The U.S. Grid Resilience State and Tribal Formula Grant program alone disbursed USD 1.3 billion in 2024 to harden distribution networks against extreme weather.[1]U.S. Department of Energy, “Grid Resilience State and Tribal Formula Grants,” energy.gov European utilities face binding decarbonization targets that require annual distribution spending to double to EUR 67 billion (USD 73.7 billion) by 2050.[2]Eurelectric, “Power Sector Accelerates Distribution Grid Investment,” eurelectric.org Early adopters in both regions demonstrate fewer outages and lower operating costs, motivating lagging peers to accelerate procurement. Mandated spending translates into multi-year revenue visibility for suppliers and compresses utilities’ deferral options. Hardware vendors that bundle software analytics are more likely to qualify for competitive funding, as regulators increasingly measure reliability outcomes.
Rising Penetration of Distributed Generation (DER)
Solar, wind, and behind-the-meter storage are turning formerly passive distribution circuits into dynamic, two-way networks. California projects USD 4.28 billion in annual utility savings once its Integrated DER Management System scales statewide.[3]California Energy Commission, “Integrated DER Management System Savings Analysis,” energy.ca.gov The variability of DER output forces utilities to adopt advanced coordination algorithms that conventional automation cannot handle. As a result, software-driven schedulers and real-time optimizers gain traction across the distribution feeder automation system market. Suppliers capable of orchestrating thousands of inverters simultaneously win contracts in solar-rich regions, while hardware-only vendors risk commoditization.
Ageing Feeder Infrastructure Replacement Cycles
Distribution assets in the United States have an average service life of 40 years, and more than 79,000 substations require modernization to support digital operations. Utilities now pair asset renewal with automation upgrades to avoid locking in another multi-decade cycle of limited functionality. FirstEnergy’s USD 1.42 billion program in Pennsylvania exemplifies this bundling strategy, with spending on automated reclosers and advanced metering occurring concurrently with conductor replacements. Concentrated replacement demand in developed economies raises the prospect of supply bottlenecks, favoring suppliers that have already expanded production capacity.
Utility-Led Digital-Substation Retrofit Programs (OT-IT Convergence)
Substations that once hosted isolated protection devices now operate as data hubs feeding enterprise analytics platforms. Global digital substation revenue climbed from USD 7.3 billion in 2023 to USD 8.03 billion in 2024. IEC 61850 enables plug-and-play interoperability; however, rollouts can add cybersecurity complexity, inflating project costs by up to 30% if not managed effectively. Automation vendors with embedded security expertise capture a premium because utilities cannot afford prolonged vulnerability windows.
Restraints Impact Analysis of Distribution Feeder Automation System Market*
| Restraint | (~) % Impact on CAGR Forecast | Geographic Relevance | Impact Timeline |
|---|---|---|---|
| Inter-operability challenges across legacy protocols | -1.2% | North America | Medium term (2-4 years) |
| High capex for rural feeder automation | -0.8% | Developing economies | Long term (≥ 4 years) |
| Cyber-security liability & compliance costs | -0.6% | Developed markets | Short term (≤ 2 years) |
| Prolonged utility procurement cycles in developing economies | -0.4% | APAC, MEA, Latin America | Long term (≥ 4 years) |
| Source: Mordor Intelligence | |||
Inter-operability Challenges Across Legacy Protocols
Utilities often operate DNP3, IEC 61850, and proprietary protocols on the same circuit, doubling system-integration spend and slowing deployments. North American grids are most affected because of the historical reliance on DNP3, which complicates migration. Compatibility gaps increase vendor lock-in and hinder the distribution feeder automation system market from reaching full competitive tendering, adding up to 20 months to average project timelines.
High Capex for Rural Feeder Automation
Low customer densities drive per-meter costs above urban benchmarks by up to 60%. Ameren Missouri’s rural modernization program required tailored radio solutions that consumed nearly half of the total project budgets. Recovering costs through rates is politically challenging, so some utilities defer rural automation until unit prices decline or external grants become available. Technology providers that offer modular, low-maintenance devices are best positioned to close the rural viability gap.
*Our forecasts treat driver/restraint impacts as directional, not additive. The impact forecasts reflect baseline growth, mix effects, and variable interactions.
Distribution Feeder Automation System Market Segment Analysis
By Component:
Communication Infrastructure Drives Connectivity RevolutionThe protection relays and controllers accounted for 36.15% of the market size in 2025, while the communication infrastructure is forecast to grow at a 10.6% CAGR through 2031. Utilities are increasingly viewing bandwidth and latency as strategic levers that unlock, which allow utilities to blanket circuits without triggering major capital budget expenditures, thereby leveraging the potential of software applications. Hitachi Energy’s private LTE and mesh-radio portfolios illustrate how dedicated networks ensure deterministic performance even during massive outage events. In parallel, 5G pilots by Honeywell and Verizon validate that public networks can securely carry supervisory traffic at scale. The competitive field, therefore, spans telecom carriers, industrial-wireless specialists, and traditional automation OEMs racing to bundle connectivity with edge devices.
Despite sustained relay demand tied to mandatory protection standards, price competition and long replacement cycles cap growth. Sensors and intelligent electronic devices benefit from falling unit costs that let utilities blanket circuits without triggering major capital-budget approvals.


By Application:
Software Intelligence Reshapes Hardware DominanceHardware retained a 66.88% distribution feeder automation system market share in 2025 because physical assets—such as reclosers, sectionalizers, and voltage regulators—remain essential. Yet, software revenue is expanding at a 9.6% CAGR, twice the pace of hardware, as utilities shift from asset count to asset intelligence. Schneider Electric’s One Digital Grid Platform claims to cut outage minutes by 40% and shorten DER interconnection reviews by 25%—metrics that regulators value when approving rate recovery. Subscription pricing converts formerly lumpy capital expenditures into predictable operating expenditures, aligning with investor expectations for stable cash flows.
Edge computing further blurs boundaries: devices now embed micro-services that filter data locally, reducing backhaul traffic by 70% in some pilots. Hardware-centric vendors thus acquire or partner with cloud developers to maintain or strengthen their market positions. Over the forecast period, utilities are expected to allocate more than one-third of new automation budgets to analytics, cybersecurity, and platform integration.
Geography Analysis
North America Distribution Feeder Automation System Market
North America generated 31.75% of global revenue in 2025, driven by the USD 2.2 billion Grid Resilience and Innovation Partnerships awards, which increased automation expenditures in 18 states. Canadian provinces add momentum through aggressive wildfire-mitigation investments, while Mexico upgrades feeders to accommodate cross-border solar exports. Regulatory frameworks that permit performance-based returns encourage utilities to pilot AI diagnostics and adaptive protection logic earlier than other regions.
APAC Distribution Feeder Automation System Market
The Asia-Pacific represents the fastest-growing distribution feeder automation system market, advancing at a 10.1% CAGR, as China, India, and Japan collectively outspend their developed peers. China’s State Grid committed 600 billion yuan (USD 84 billion) in 2024 for ultra-high voltage and distribution intelligence, dwarfing any single-country program. India’s USD 478.58 billion power-sector pipeline, along with 1.25 trillion rupees (USD 15 billion) earmarked for smart meters, creates a sustained order volume for at least five years. Meanwhile, Japanese utilities have pledged nearly EUR 1 trillion (USD 1.1 trillion) under the Green Transformation Plan to strengthen networks supporting data center growth. Such scale advantages lower component costs globally.
Europe Distribution Feeder Automation System Market
Europe maintains steady adoption on the back of binding climate directives. The requirement to double annual distribution spending to EUR 67 billion secures demand even if regional economies slow. Projects such as Hitachi Energy’s collaboration with TransnetBW in Germany and its € 80 million transformer expansion in Spain underscore supplier confidence. Dynamic Line Rating pilots demonstrate that grids can gain 20-40% extra capacity without requiring new conductors, making advanced sensors an attractive option for cost-constrained regulators.
South America and MEA Distribution Feeder Automation System Market
South America and the Middle East & Africa display emerging potential; however, currency risks and limited sovereign credit profiles slow large-scale rollouts. Localized manufacturing incentives in Brazil and Saudi Arabia aim to cut equipment costs by up to 25%, improving project viability.

Regulatory Landscape
Distribution feeder automation programs are increasingly shaped by reliability, interoperability, and data-exchange requirements embedded in standards and planning obligations. In the United States, the Department of Energy (DOE) continues to anchor modernization priorities through Office of Electricity initiatives, including the March 2026 DOE Office of Electricity Strategic Plan, which emphasizes resilience and automated reliability enhancements to address load growth from data centers and manufacturing, and the draft 2026 National Transmission Needs Study released in July 2026 that highlights system constraints and infrastructure needs that feed into distribution automation investments.
In Europe, operational and data-exchange expectations for distribution systems that interface with transmission are reinforced through ACER Recommendation 01-2025 (DR NC), which sets out automated response and information exchange considerations for connected systems. At the technical layer, utilities and vendors are aligning feeder automation designs to updated and newly approved standards, including IEEE 1815.2-2025 for DNP3 communications profiles with DER, and IEEE 2413.2-2026 (approved March 2026) that defines a reference architecture for power distribution IoT. In the United Kingdom, DESNZ actions and related code and specification work, including mid-to-late 2026 compliance timing for a tariff data specification in the Retail Energy Code to support smart appliance interoperability, further raise the emphasis on standardized data handling and secure digital integration across distribution networks.
Competitive Landscape
The distribution feeder automation system market is moderately fragmented, with ABB, Schneider Electric, and Siemens leveraging decades of installed hardware while making decisive moves into cloud software. Supplier consolidation accelerated in 2024 when 20 electrical distributors—11 from the Electrical Wholesaling Top 100—changed hands, signaling a race for channel reach and inventory control. ABB’s purchase of the Gamesa Electric power-conversion unit added 40 GW of serviceable installed base and deepened renewable integration expertise. Schneider Electric invested USD 700 million to launch its AI platform, betting that analytics will anchor long-term service contracts. Siemens aligns with EnergyHub to integrate DER management into its automation stack, targeting utilities that seek single-vendor accountability.
White-space opportunities cluster around edge-based AI and cybersecurity. Start-ups offering transformer-level vibration sensing or feeder-breaker self-healing algorithms attract utility pilots because they promise measurable reductions in outages without incurring heavy capital expenditures. Incumbents respond through venture arms and minority stakes, hedging against disruption. Asian manufacturers primarily compete on cost and local content, whereas global buyers prioritize interoperability and security certifications, which limits the risk of commoditization in the near term.
Distribution Feeder Automation System Industry Leaders
ABB Ltd.
General Electric Company
Schneider Electric SA
Siemens AG
Eaton Corporation Inc
- *Disclaimer: Major Players sorted in no particular order
Distribution Feeder Automation System Market Companies Covered in this Report
- ABB Ltd
- Schneider Electric SE
- Siemens AG
- Eaton Corporation plc
- General Electric Co.
- Schweitzer Engineering Laboratories Inc.
- G&W Electric Company
- Moxa Inc.
- Trilliant Holdings Inc.
- Cisco Systems Inc.
- S&C Electric Company
- Toshiba Energy Systems & Solutions
- Hitachi Energy Ltd.
- Landis+Gyr AG
- Itron Inc.
- Advanced Control Systems (Indra)
- Arteche Group
- NOJA Power Switchgear Pty Ltd
- Mitsubishi Electric Corporation
- Honeywell Process Solutions
Read Analysis of Distribution Feeder Automation System Companies

Market Opportunities and Future Outlook
Opportunities are concentrated where utilities must connect field automation to software platforms that maintain an accurate, real-time network model and can coordinate DER and new loads. This shift is visible in vendor platform launches and utility IT/OT integration efforts, including GE Vernova launching GridOS for Distribution in February 2026 to unify real-time operations, DER management, and network modeling, and FirstEnergy completing an ArcGIS Utility Network and ADMS modernization integration in July 2026 to improve real-time operational updates. These deployments create a clear path for vendors that can package feeder automation hardware with network model management, integration services, and cybersecurity controls that reduce multi-vendor interoperability burdens.
Standards activity is also expanding the technical runway for grid-edge sensing, distribution IoT, and communications profiles, which broadens addressable projects beyond traditional recloser and sectionalizer upgrades. IEC TR 63353:2026 (published February 2026) outlines architecture and functional requirements for IoT applications in power distribution management, while IEEE work such as IEEE 2413.2-2026 and IEEE 1854-2025 strengthens guidance around distribution IoT reference architectures and smart distribution applications (including CVR verification). On the demand side, planning mandates are becoming more specific: a DOE compilation released in January 2025 notes that around 20 US states have adopted legislated or regulatory requirements for distribution system planning, often specifying at least a 10-year horizon, which widens the pipeline for feeder-level automation, communications backhaul, and sensor rollouts needed to support DER integration and electrification.
Recent Industry Developments in Distribution Feeder Automation System Market
- June 2026: Schneider Electric introduced the Automation Processor 310 (AP310) and Edge Communication Node (ECN) to advance its Foxboro Software Defined Automation platform. The launch reinforces the shift toward software-defined and edge-enabled architectures, shaping how utilities and integrators design communications and control layers around feeder and substation automation.
- February 2026: Schneider Electric and ETAP launched a physics-based digital twin solution integrated with Schneider Electric's One Digital Grid Platform and EcoStruxure ArcFM Web for utility asset management. Linking design and operational models supports ADMS, planning, and outage workflows, pushing feeder automation projects toward tighter GIS-ADMS-data platform integration.
- November 2024: LUMA Energy reported deployment of more than 9,000 grid automation devices and continued implementation of automatic switching feeder automation systems across Puerto Rico's distribution circuits. The scale of device deployment and feeder switching automation underscores how resilience-driven programs can accelerate adoption of field automation hardware and supporting communications networks.


Distribution Feeder Automation System Market Report Scope and Research Methodology
Market Definition and Coverage
For this methodology, the market covers systems and solutions used to automate monitoring, protection, control, and communication on electricity distribution feeders, so utilities can detect faults, isolate issues, and restore service faster.
Scope exclusions: Transmission automation and generation-side control systems are excluded, and the sizing does not count unrelated grid IT that is not deployed for feeder-level automation.
Segments Covered in This Report
- By Component
- Protection Relays and Controllers
- Sensors and Intelligent Electronic Devices
- Communication Infrastructure
- SCADA/HMI Platforms
- By Application
- Software
- Hardware
- By Geography
- North America
- United States
- Canada
- Mexico
- Europe
- Germany
- United Kingdom
- France
- Italy
- NORDIC Countries
- Russia
- Rest of Europe
- Asia-Pacific
- China
- India
- Japan
- South Korea
- ASEAN Countries
- Rest of Asia-Pacific
- South America
- Brazil
- Argentina
- Rest of South America
- Middle East and Africa
- Saudi Arabia
- United Arab Emirates
- South Africa
- Egypt
- Rest of Middle East and Africa
- North America
Data Sources, Market Sizing, and Validation
Desk Research
Desk research started with public grid reliability and investment signals that indirectly anchor demand for feeder automation, and then we mapped those signals to likely solution adoption. We reviewed sources such as the US Energy Information Administration (EIA) for distribution network context, the US Department of Energy smart grid materials for program direction, and the International Energy Agency (IEA) for broader electricity network investment trends.
To translate those signals into market inputs, we also referenced sources such as IEEE publications for feeder automation use cases, International Electrotechnical Commission (IEC) standards pages for protection and communication practices, and US Federal Energy Regulatory Commission (FERC) orders and filings that influence utility automation roadmaps. Company filings, investor presentations, utility tender documents, and credible press were used to confirm rollout timing and solution bundles. A paid subscription focused on company financials and intelligence was used selectively to normalize reporting lines. These are illustrative examples, and many other public sources were used to collect data, validate assumptions, and clarify open questions.
Primary Interviews and Surveys
Primary interviews and structured surveys were used to pressure test the adoption curve for feeder automation functions and to confirm what is actually included in project scopes at the feeder level. We covered utility engineering and operations roles, system integrators, and component suppliers, and discussions were spread across APAC, EMEA, and the Americas so regional upgrade cycles and procurement styles were not overgeneralized.
Distribution of primary research fieldwork respondents
| Company type | Respondent position | Region |
|---|---|---|
| Top tier: 29% | CXOs: 17% | APAC: 37% |
| Mid tier: 49% | Functional/Unit leaders: 39% | EMEA: 36% |
| Smaller Players: 22% | Managers: 44% | Americas: 27% |
Market-Sizing & Forecasting
The core model uses a top-down and bottom-up blend, starting with a top-down build where distribution grid automation spending is reconstructed through utility capex direction, smart grid program rollouts, and the typical equipment and software mix seen in feeder-level deployments. That spend pool is then allocated to feeder automation system building blocks using shares that were checked in interviews, and the results are built by region before being consolidated to a global total.
To keep the sizing grounded, we corroborate totals with selective bottom-up approximations, such as sampled project values from tenders, typical device counts per feeder section (reclosers, sectionalizers, relays, sensors), and indicative ASP ranges for communication infrastructure and SCADA/HMI platform layers. When public disclosures do not separate feeder automation from broader distribution automation, we apply scope filters based on documented project language, then re-check the implied unit economics so the totals do not drift.
For forecasting, scenario analysis is used because adoption depends on policy push, outage performance targets, and utility budget cycles, which can shift quickly. Key inputs we track include distribution reliability improvement programs (for example, SAIDI and SAIFI targets), growth in distributed energy resource interconnections that raise monitoring needs, utility investment plans for distribution networks, modernization of feeder communication networks, and replacement cycles for protection relays and controllers. Assumptions are finalized after expected deployment pace is reviewed with practitioners, and we keep at least one downside and one upside case to avoid fitting a single growth path.
Data Validation & Update Cycle
Validation is done in steps so the final number is not driven by one data series. We compare model outputs against independent signals such as utility spending direction, project awards, and the implied mix of hardware, software, and communication layers, and then anomalies are reviewed at a regional level before sign-off.
If a variance appears, we re-check definitions, currency conversion timing, and the adoption shares used for each solution block, and we re-contact selected experts when a large program change could move the curve. Reports refresh annually, with interim updates when material events change deployment pace or pricing, and before delivery an analyst performs a fresh pass so clients receive the latest updated view.
Mordor Intelligence's Distribution Feeder Automation System Market Size Compared Against Other Published Estimates
Published market sizes for feeder automation often do not match because the line between feeder automation and broader distribution automation is not drawn the same way, and because some estimates blend adjacent grid software with on-feeder equipment. Differences also come from how vendors are mapped to this market, what is counted as a system versus a component, and whether the year used is a calendar year or a shifted fiscal year.
Tender award values, utility investment-plan disclosures, and device-per-feeder rollout checks are the evidence points that tie Mordor Intelligence to feeder-level deployments when sizing the market at USD 5.56 B (2026). Gaps typically widen when a study counts full distribution automation platforms, includes substation automation spend, or assumes faster ASP expansion for sensors and communication layers without re-validating against recent bids and procurement pacing.
Benchmark comparison
| Source | Market Size | Gaps in Research Methodology |
|---|---|---|
| Mordor Intelligence | USD 5.56 B (2026) | |
| Global Consultancy A | USD 4.54 B (2023) | Uses an earlier base year and a narrower capture of system scope, and it appears to undercount communication infrastructure and SCADA/HMI layers that are frequently bundled in feeder automation programs. |
| Industry Publisher B | USD 4.80 B (2025) | Blends feeder automation with selected distribution automation line items, and the split between software and hardware is not clearly tied back to feeder project scope language or recent utility tender benchmarks. |
The spread in the table mainly comes from where each publisher draws the line between feeder automation systems and adjacent distribution automation spending, and from the year and pricing assumptions used. By anchoring the scope to feeder deployments and checking the output against observable program and tender signals, we end up with a balanced number that can be traced through clear inputs and repeatable steps.


Key Questions Answered in the Report
What is the current value of the distribution feeder automation system market?
The distribution feeder automation system market size is valued at USD 5.56 billion in 2026 and is projected to reach USD 7.92 billion by 2031.
Which region leads the market today?
North America holds the largest 31.75% revenue share, supported by extensive federal grid-resilience funding.
Which region is growing the fastest?
Asia-Pacific is forecast to rise at a 10.1% CAGR through 2031 because of massive investments by China, India, and Japan.
Which component segment is expanding most rapidly?
Communication infrastructure is growing at an 10.6% CAGR as utilities prioritize robust connectivity for real-time data exchange.
How are utilities addressing aging infrastructure?
They combine replacement programs with automation upgrades, exemplified by FirstEnergy’s USD 1.42 billion modernization plan approved in 2024.
Why is software gaining share in this industry?
AI-powered analytics and edge intelligence help utilities cut outage minutes and integrate distributed generation, driving software’s 9.6% CAGR growth trajectory.
Page last updated on:


 Your data is secure and never sold or shared.


