
Disability Devices Market Size and Share
Market Overview
| Study Period | 2020 - 2031 |
|---|---|
| Market Size (2026) | USD 23.69 Billion |
| Market Size (2031) | USD 31.14 Billion |
| Growth Rate (2026 - 2031) | 5.62 % |
| Fastest Growing Market | Asia-Pacific |
| Largest Market | North America |
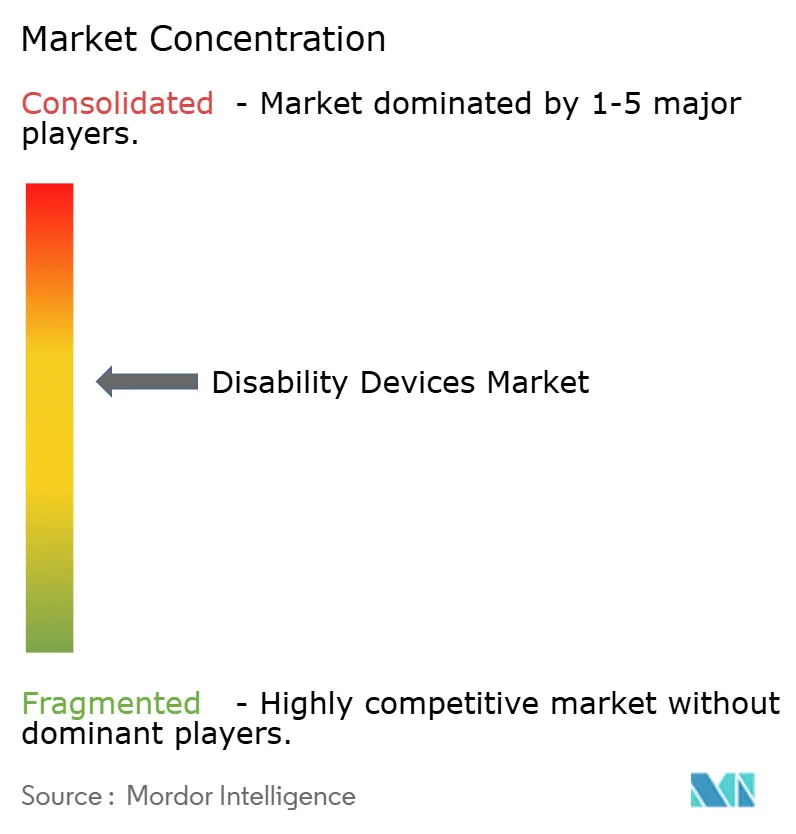
| Market Concentration | Medium |
Major Players *Disclaimer: Major Players sorted in no particular order Image © Mordor Intelligence. Reuse requires attribution under CC BY 4.0. | |
Disability Devices Market Analysis by Mordor Intelligence
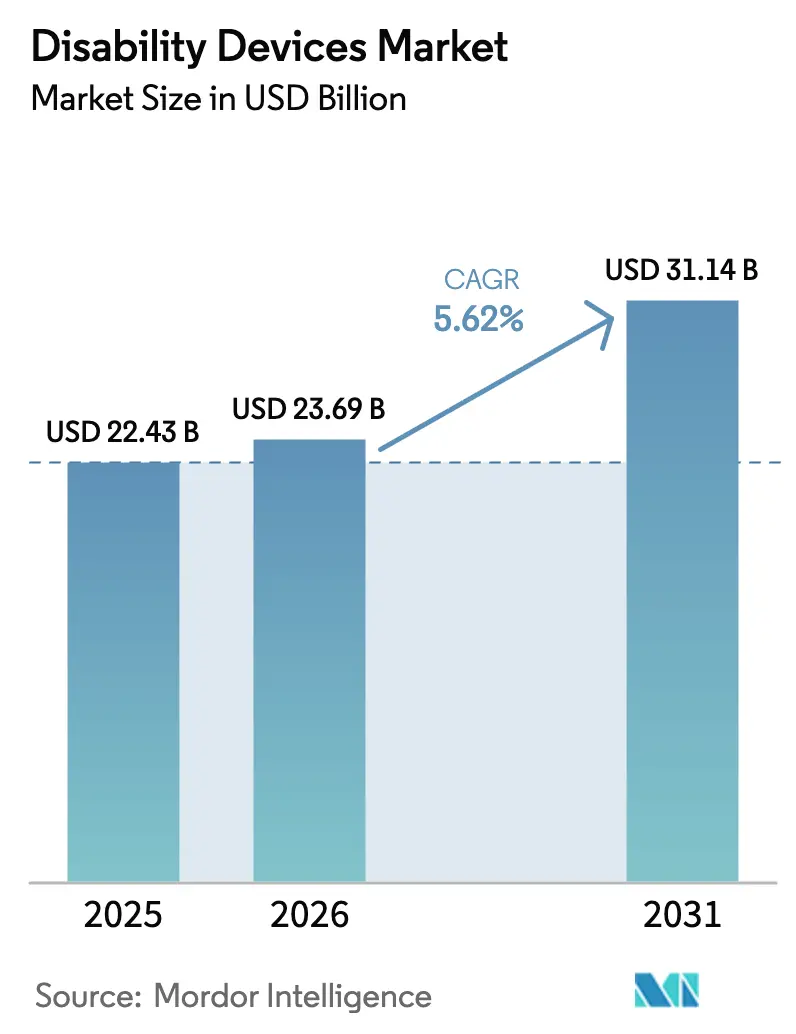
The disability devices market size is expected to grow from USD 22.43 billion in 2025 to USD 23.69 billion in 2026 and is forecast to reach USD 31.14 billion by 2031 at a 5.62% CAGR over 2026-2031. The market is witnessing a shift from institutional procurement to direct-to-consumer channels, driven by aging populations seeking personalized and connected solutions that support independent living across homes, workplaces, and educational environments. Technological advancements, including sensor fusion, additive manufacturing, and IoT connectivity, are transforming traditional mechanical aids into advanced data platforms. These platforms enable remote monitoring, predictive maintenance, and recurring revenue opportunities for vendors. Reimbursement reforms, such as Medicare's relaxed regulations for over-the-counter hearing aids and Europe's harmonized benefit ceilings, are reducing out-of-pocket expenses and expanding the addressable market. Increased venture capital investments in neuro-prosthetic startups and the rapid adoption of AI by established players are accelerating innovation cycles, compressing product development timelines, and challenging legacy product features. However, challenges such as affordability gaps, a shortage of specialists, and interoperability issues within smart-home ecosystems are restraining adoption in low- and middle-income regions.
Key Report Takeaways
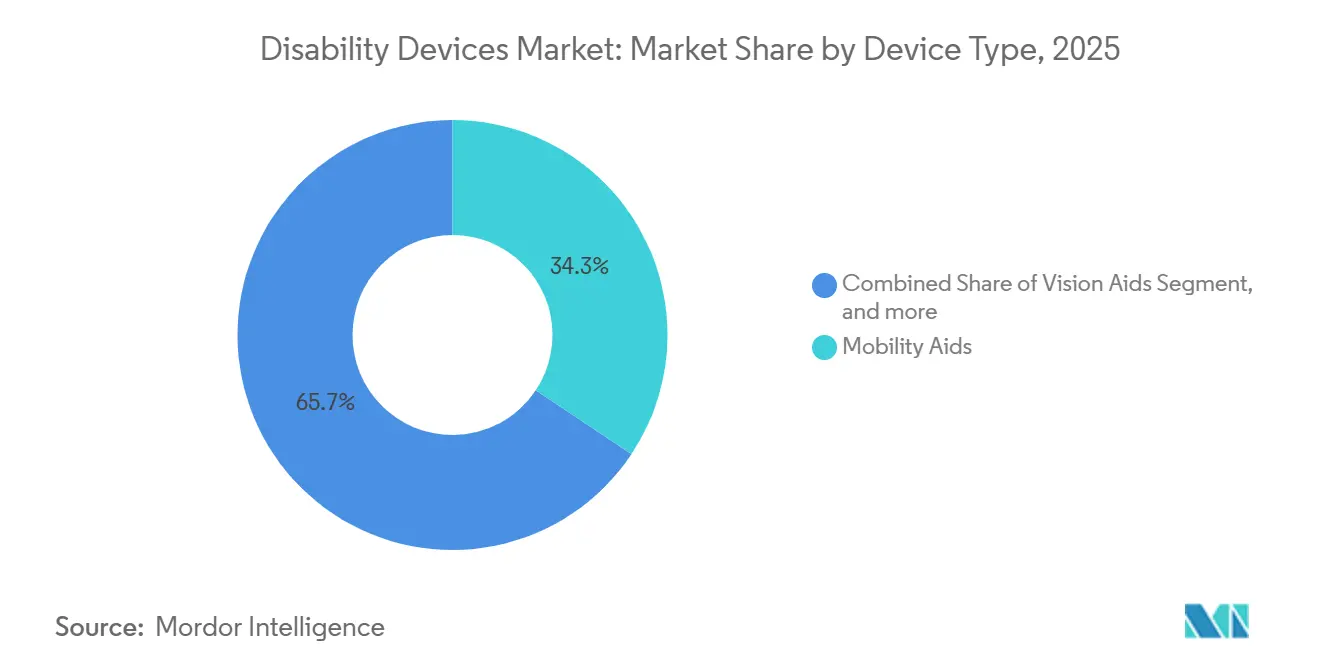
- By device type, Mobility Aids led with a 34.34% market share of the disability devices market in 2025, while Communication Aids are forecast to expand at a 7.54% CAGR through 2031.
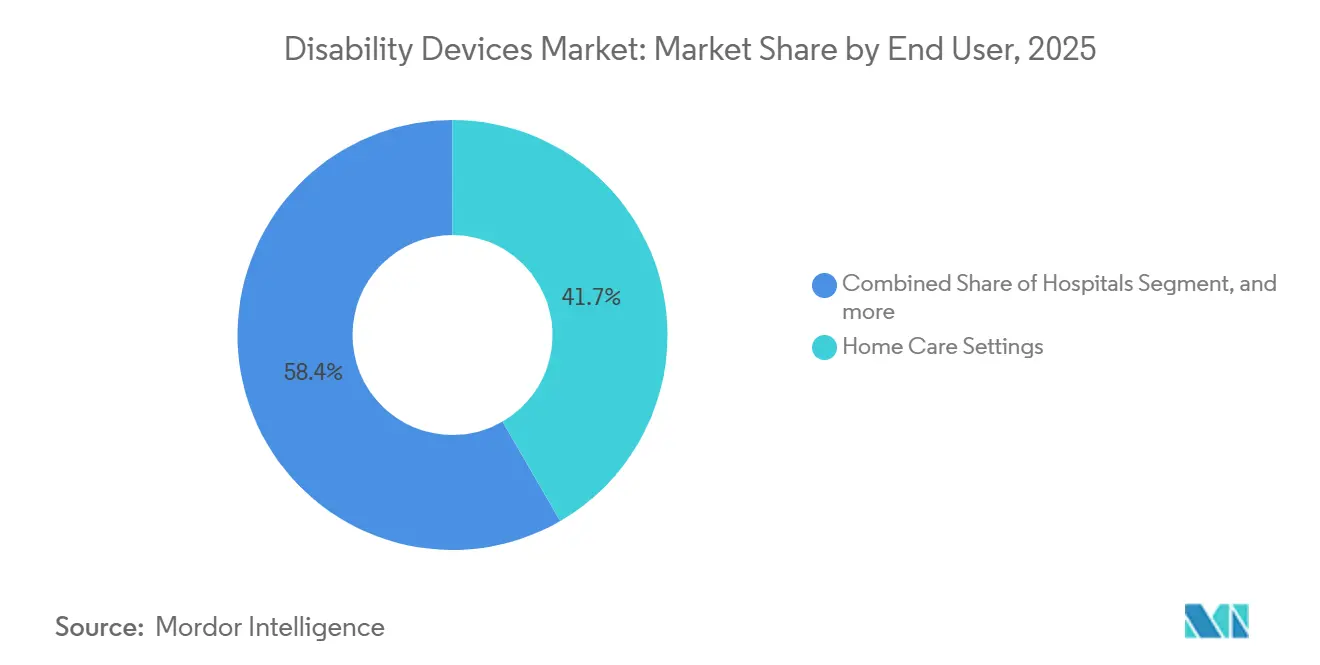
- By end user, Home Care Settings accounted for 41.65% of the disability devices market in 2025; Educational Institutions are projected to hold the highest CAGR of 7.87% from 2026 to 2031.
- By distribution channel, Retail Pharmacies and Durable Medical Equipment stores captured 52.45% of 2025 revenue, whereas E-Commerce Platforms are poised for an 8.22% CAGR through 2031.
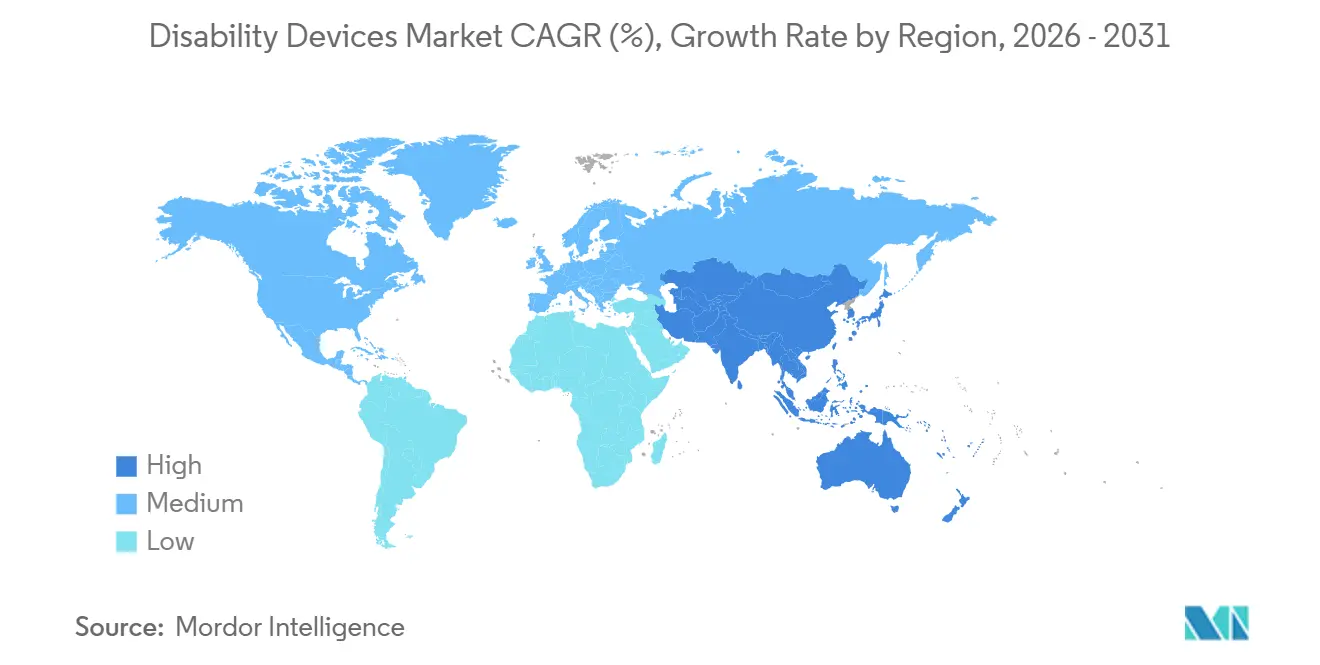
- By geography, North America accounted for 43.54% of global revenue in 2025; the Asia-Pacific region is projected to have the fastest growth at a 6.43% CAGR through 2031.
Note: Market size and forecast figures in this report are generated using Mordor Intelligence’s proprietary estimation framework, updated with the latest available data and insights as of January 2026.
Market Trends and Insights
Drivers Impact Analysis of Disability Devices Market*
| Driver | (~) % Impact on CAGR Forecast | Geographic Relevance | Impact Timeline |
|---|---|---|---|
| Increasing Prevalence of Age-Related Disabilities | +1.2% | Global, with concentration in Japan, Germany, Italy | Long term (≥ 4 years) |
| Favorable Government Reimbursement Policies for Assistive Technologies | +0.9% | North America, Western Europe, Australia | Medium term (2-4 years) |
| Rapid Advancements in Assistive Sensor and IoT Integration | +1.1% | North America, APAC technology hubs (South Korea, Taiwan, Singapore) | Medium term (2-4 years) |
| Growing Adoption of 3D-Printed Personalized Prosthetics | +0.7% | Global, early adoption in U.S., Germany, Netherlands | Short term (≤ 2 years) |
| Expansion of Universal Design Mandates in Emerging Economies | +0.8% | India, China, Brazil, Southeast Asia | Long term (≥ 4 years) |
| Venture Capital Funding Surge in Neuro-Prosthetic Start-Ups | +0.5% | North America, Europe | Short term (≤ 2 years) |
| Source: Mordor Intelligence | |||
Increasing Prevalence of Age-Related Disabilities
Population aging is the strongest structural driver for the disability devices market. The World Health Organization projects that the global 60-plus cohort will reach 2.1 billion by 2050, with approximately 70% of adults over 70 experiencing clinically significant hearing loss. Japan’s super-aged profile (29% of citizens already over 65) illustrates rising device intensity; roughly 1.2 million hearing aids were dispensed nationwide in 2025, nearly double the per-capita rate observed in the United States[1]Ministry of Health, Labour and Welfare, “Annual health statistics,” mhlw.go.jp. Multiple comorbidities among older adults (stroke, osteoarthritis, diabetic neuropathy) are accelerating demand for multimodal platforms that combine fall detection, medication reminders, and emergency communication. Vendors capable of bundling such capabilities within a single interface are therefore best positioned to capture wallet share. Over the long term, demographic momentum ensures a stable baseline growth rate of at least 1.2 percentage points, contributing to the overall CAGR.
Favorable Government Reimbursement Policies for Assistive Technologies
Coverage expansion is widening access to premium devices. In the United States, Medicare processed more than USD 8 billion in Durable Medical Equipment, Prosthetics, Orthotics, and Supplies claims in 2025, and its 2024 rule change allowing over-the-counter hearing aids priced below USD 1,500 cut beneficiary out-of-pocket spending by roughly 40%. Germany’s statutory insurers reimburse up to EUR 1,500 (USD 1,650) every six years for hearing aids, while France covers 60% of prosthetic costs up to EUR 2,500 (USD 2,750)[2]Bundesministerium für Gesundheit, “Assistive device reimbursement guidelines,” bmg.bund.de. Such reimbursement ceilings establish price bands and compel manufacturers to develop tiered product portfolios that align with payer thresholds. ISO 13485 certification increasingly serves as a gatekeeper for market entry, nudging small innovators toward strategic partnerships with established contract manufacturers.
Rapid Advancements in Assistive Sensor and IoT Integration
Sensor fusion and low-power wireless chips are converting passive aids into connected endpoints. Ottobock’s Genium X4 knee logs over 50 gait parameters per stride and transmits data via Bluetooth for remote alignment adjustments. Smart wheelchairs equipped with LiDAR and ultrasonic arrays now autonomously detect obstacles and record utilization metrics for predictive maintenance. Despite these gains, less than 15% of connected aids sold in 2025 were Matter-compatible, forcing users to juggle multiple proprietary apps and fragmenting user experience[3]Connectivity Standards Alliance, “Matter specification,” csa-iot.org. Regulatory bodies have begun to respond—the U.S. Food & Drug Administration issued draft cybersecurity guidance for connected medical devices in 2025—but a universally accepted data-exchange protocol remains elusive, tempering the full 1.1 percentage-point growth potential.
Growing Adoption of 3D-Printed Personalized Prosthetics
Additive manufacturing is reducing lead times and lowering production costs for custom prosthetics by as much as 60%, according to a 2024 study in the Journal of Prosthetics and Orthotics. Global revenue for 3D-printed limbs reached the USD 1.5 billion threshold in 2025 and is expanding at a mid-teen CAGR as material prices fall and open-source limb libraries proliferate. Clinics can now deliver a transtibial socket within hours, improving patient comfort and reducing abandonment rates. Regulatory ambiguity persists; custom devices are Class I exempt. Yet, load-bearing 3D-printed implants may still require 510(k) clearance, creating a short-term (≤ 2 years) window where early adopters gain a share before formal U.S. and EU guidelines crystallize.
Restraints Impact Analysis of Disability Devices Market*
| Restraint | % Impact on CAGR Forecast | Geographic Relevance | Impact Timeline |
|---|---|---|---|
| High Upfront Cost of Advanced Assistive Devices | -0.8% | Global, acute in Sub-Saharan Africa, South Asia, Latin America | Medium term (2-4 years) |
| Limited Insurance Coverage in Low- and Middle-Income Countries | -0.6% | Sub-Saharan Africa, South Asia, Southeast Asia | Long term (≥ 4 years) |
| Interoperability Gaps Between Legacy Aids and Smart Home Ecosystems | -0.4% | North America, Western Europe, urban APAC | Short term (≤ 2 years) |
| Shortage of Trained Assistive Technology Specialists | -0.5% | Rural North America, Sub-Saharan Africa, Central Asia | Medium term (2-4 years) |
| Source: Mordor Intelligence | |||
High Upfront Cost of Advanced Assistive Devices
Premium aids remain expensive relative to household income in many regions. Microprocessor-controlled transfemoral limbs cost USD 50,000 to USD 100,000, while cochlear implant systems cost USD 30,000 to USD 50,000 before surgical fees. The World Health Organization estimates that 90% of people needing assistive technology lack access, primarily due to the high cost. Even in high-income markets, Medicare coinsurance requires beneficiaries to cover 20% of DMEPOS costs, translating to a range of USD 3,000-6,000 for a power wheelchair. This expense is driving a secondary market for refurbished devices, but liability concerns and lack of standard quality protocols continue to constrain supply.
Limited Insurance Coverage in Low- and Middle-Income Countries
In markets where health insurance penetration is below 20%, out-of-pocket payments are the norm. India’s Assistance to Disabled Persons scheme reimburses only INR 10,000 (approximately USD 120) for hearing aids, which is far below the entry-level import prices. National assistive-technology budgets are scarce; a 2024 WHO survey showed only 35% of low-income countries maintain dedicated funding lines, and fewer than 10% keep a priority product list aligned with WHO recommendations. The result is a bifurcated disability device market, where urban middle-class consumers buy online via installment plans, while rural populations rely on charitable donations.
*Our forecasts treat driver/restraint impacts as directional, not additive. The impact forecasts reflect baseline growth, mix effects, and variable interactions.
Disability Devices Market Segment Analysis
By Device Type:
Communication Aids Sustain Fastest MomentumCommunication Aids are expected to register a 7.54% CAGR from 2026 to 2031, reflecting the mainstreaming of augmentative and alternative communication platforms within classrooms and offices. The disability devices market size for Communication Aids is forecast to surpass USD 6 billion by 2031, as speech-generating devices integrate eye-tracking, natural language processing, and cloud-based vocabulary updates. Tobii Dynavox reported a 22% year-over-year increase in shipments in 2024, following its partnership with North American school districts. Mobility Aids, despite holding 34.34% of the disability devices market share in 2025, are transitioning from manual wheelchairs to sensor-rich power models that self-navigate narrow corridors and curb cuts. Permobil’s M5 Corpus, launched late 2024, exemplifies the shift with LiDAR-based collision avoidance and GPS routing.
Demand for Hearing Aids remains buoyant as over-the-counter devices, priced at USD 200-1,500 per pair, widen access. Sonova’s Sphere Infinio, the first hearing aid with an on-board AI speech-enhancement chip, delivers a 10-decibel improvement in background noise environments and extends battery life to 36 hours. Vision Aids are evolving from legacy magnifiers to AI-enabled wearables such as OrCam MyEye that translate text and identify faces. Daily living aids, dominated by adaptive utensils and bright pill dispensers, retain fragmentation but gain traction in aging-in-place scenarios, where Bluetooth medication reminders help lower hospital readmissions.


By End User:
Education Surges on Universal-Design MandatesEducational Institutions are projected to achieve a 7.87% CAGR through 2031, driven by inclusive learning mandates that require schools and universities to implement assistive technologies as part of individualized education programs. In 2025, U.S. public schools allocated approximately USD 1.2 billion toward assistive devices, including eye-gaze tablets, text-to-speech software, and adjustable desks. Home Care Settings, which accounted for 41.65% of the disability devices market revenue in 2025, continue to expand due to home-health reimbursements favoring durable medical equipment over long-term care placements. Ambulatory Care Centers are gaining traction as preferred locations for prosthetic fittings, supported by insurers shifting procedures away from hospitals to reduce costs. Long-Term Care Facilities face financial constraints, with 62% of U.S. nursing homes still relying on manual wheelchairs. In the corporate sector, workplace adoption of assistive tools remains limited but strategic, as companies integrate these technologies into diversity and inclusion budgets under the Americans with Disabilities Act's reasonable-accommodation provisions.
By Distribution Channel:
Online Platforms Gain SpeedE-Commerce Platforms are forecast to achieve an 8.22% CAGR during 2026-2031, accelerating as telehealth portals and subscription models simplify device discovery and replenishment. Amazon’s dedicated disability aids storefront hosts more than 50,000 SKUs and offers two-day delivery for Prime members. Specialist portals, such as Rehabmart and Allegro Medical, integrate insurance verification and virtual seating assessments, enabling wheelchair purchases without requiring on-site visits. Retail Pharmacies and Durable Medical Equipment stores still command 52.45% of 2025 revenue because they manage Medicare billing and equipment servicing. Nonetheless, direct-to-consumer portals from Sonova, Cochlear, and Ottobock are eroding brick-and-mortar margins by providing remote fitting tutorials and doorstep delivery. Competitive-bidding reforms enacted by the Centers for Medicare & Medicaid Services in 2024 now allow mail-order suppliers to compete for DMEPOS contracts, legitimizing e-commerce fulfillment for reimbursed orders.
Geography Analysis
North America Disability Devices Market
North America contributed 43.54% of disability devices market revenue in 2025, underpinned by Medicare’s USD 8 billion annual DMEPOS spend and the Department of Veterans Affairs’ prosthetic benefits for 9 million veterans. High per-capita health expenditure, robust billing codes, and the FDA’s expedited Technology Certification pathway speed time to market for breakthrough aids. Growth is moderating, however, as urban penetration plateaus and reimbursement models shift toward value-based contracting, which rewards functional outcomes instead of device volume.
APAC Disability Devices Market
The Asia-Pacific region is expected to record the fastest growth, with a 6.43% CAGR through 2031, as China, Japan, and India confront rapid demographic aging. China’s population aged 60 and above reached 280 million in 2025 and is expected to surpass 400 million by 2035, prompting increased municipal procurement of ramps and tactile paving under the Barrier-Free Environment Construction Law. Japan subsidizes up to 90% of device costs for low-income seniors, making it the world’s highest per-capita consumer of hearing aids. India reimburses up to 50% of aid costs for households below the poverty line, though caps limit access to advanced imports. Smart-device penetration is lower than in the West, but volume growth from cost-engineered manual aids offsets the mix.
EMEA and South America Disability Devices Market
Europe accounted for 28% of 2025 revenue. Reimbursement differs by nation; Germany offers EUR 1,500 per hearing aid every six years, while France covers 60% of prosthetic costs up to EUR 2,500. The Medical Device Regulation raises compliance costs yet improves traceability and post-market vigilance. The Middle East, Africa, and South America collectively accounted for approximately 10% of sales, largely due to low insurance penetration and fragmented supply chains. Brazil’s Inclusion Law mandates workplace accommodations, but enforcement outside major cities remains patchy.

Regulatory Landscape
The disability devices market operates within medical-device frameworks that increasingly converge on ISO 13485-aligned quality systems and more stringent post-market controls for connected products. In the United States, the FDA implemented the Quality Management System Regulation (QMSR) in February 2026, aligning quality requirements more closely with ISO 13485:2016, and continued to update its recognized consensus standards list used in premarket reviews. The FDA also issued final guidance in May 2026 on the content of human factors information in marketing submissions, reinforcing usability and risk-control expectations for devices used in home care and direct-to-consumer settings.
In Europe, MDR and IVDR compliance remains an access gate, with added steps intended to standardize notified-body assessments. In May 2026, the European Commission adopted Implementing Regulation (EU) 2026/977, which sets uniform requirements for conformity assessments by notified bodies under MDR and IVDR. EUDAMED capability rollouts continue to expand digital reporting and traceability requirements, including modules tied to safety and clinical performance documentation. In Great Britain, the MHRA’s post-market surveillance requirements came into force in June 2025, shaping how manufacturers and distributors support compliance.
Value Chain Analysis
The value chain covers component and material suppliers (metals, polymers, batteries, sensors, and connectivity modules), device OEMs and specialized contract manufacturers, and software and cloud service providers for connected aids. Downstream, procurement and sales flow through DME stores, retail pharmacies, direct-to-consumer portals, and e-commerce marketplaces. Hearing, vision, and communication aids increasingly incorporate software, firmware, and cybersecurity workflows alongside mechanical and electro-mechanical manufacturing, which elevates the importance of ISO 13485-compliant quality systems and validated supplier qualification across electronics, firmware, and accessories.
Manufacturing is concentrated in established medical-device and electronics hubs. China plays a major role in low-to-mid-end output and export-oriented production, while higher-acuity systems, including implantable hearing solutions and microprocessor-controlled prosthetics, depend on more specialized supply chains and clinical support networks. For bulky mobility devices, logistics and cross-border distribution remain a meaningful cost driver. Disruption exposure, including the 2023-2024 Red Sea shipping crisis, underscored lead-time and freight sensitivity. On the demand side, procurement is split between institutional purchasing (hospitals, rehabilitation centers, and long-term care) and a growing direct-to-consumer mix, where remote fitting, virtual assessments, and after-sales service networks influence brand choice and lifetime value.
Competitive Landscape
In 2025, the top ten manufacturers (Sonova, Demant, Cochlear, GN Store Nord, Ottobock, Permobil, Invacare, Pride Mobility, Sunrise Medical, and Drive DeVilbiss) accounted for 45-50% of global revenue, with no single company exceeding a 12% share. Established hearing-aid manufacturers are countering competition from low-cost over-the-counter entrants by integrating advanced features. For example, Sonova's Sphere Infinio incorporates real-time AI, teleaudiology, and rechargeable batteries. In 2024, Ottobock partnered with Microsoft Azure to integrate cloud analytics into prosthetic limbs, enhancing recurring service revenue opportunities. Venture-backed disruptors such as Synchron, Precision Neuroscience, and Paradromics raised over USD 200 million in 2024, advancing implantable brain-computer interfaces that could potentially replace traditional aids for patients with paralysis. Patent grants for assistive technology innovations increased by 18% year-over-year in 2024, reflecting sustained research and development (R&D) momentum. However, interoperability remains a key challenge. In 2025, fewer than 15% of power wheelchairs supported the Matter protocol, highlighting a significant opportunity for companies capable of bridging smart-home standards.
Disability Devices Industry Leaders
Cochlear Limited
GF Health Products
Invacare Corporation
Sunrise Medical
Ottobock
- *Disclaimer: Major Players sorted in no particular order
Disability Devices Market Companies Covered in this Report
- Advanced Bionics LLC
- Cochlear
- Demant
- Drive DeVilbiss Healthcare
- GF Health Products
- GN Store Nord
- Invacare
- MED-EL
- Merits Health Products
- Meyra
- Ottobock
- Permobil AB
- Pride Mobility Products
- ReSound GN
- Sivantos Inc. (Signia)
- Sonova
- Starkey Hearing Technologies
- Sunrise Medical
- Whisper
- Widex A/S

Market Opportunities and Future Outlook
A near-term whitespace is emerging around market-shaping programs that standardize product specifications, service delivery, and financing for assistive technologies. This is most visible in underpenetrated low- and middle-income settings, where affordability and specialist shortages are binding constraints. The WHO process to update the Priority Assistive Products List (APL), including a May 2025 Technical Advisory Group meeting, and the May 2026 public review of the draft global road map toward universal access to assistive technology (WHO-GATE 5P framework) provide concrete anchors for vendors and distributors to align portfolios with defined priority products and quality requirements. That alignment supports manufacturers with tiered offerings (entry, reimbursable, premium connected) to compete through standardized specifications and scalable service models, rather than one-off tenders.
India illustrates policy-driven demand creation as stakeholders call for a National Assistive Technology Policy to reduce fragmentation across ministries and strengthen provision networks. This type of framework supports broader deployment of hearing, vision, mobility, and communication aids beyond major metros, where retail and e-commerce already concentrate choice. On the innovation side, product platforms that combine connectivity, rechargeable power, and upgradeable software are expanding across hearing and implant-adjacent categories, with regulatory clearance activity such as Cochlear receiving FDA clearance for the Osia 3 Sound Processor in 2026. At the same time, clinically validated neuroprosthetic research, including Nature Medicine reporting on an iBCI-enabled double neural bypass system in 2026, points to a longer-horizon opportunity for higher-acuity solutions that bridge assistive and restorative functionality, with implications for specialist channels, reimbursement evidence generation, and post-market performance monitoring.
Recent Industry Developments in Disability Devices Market
- July 2026: Cochlear received FDA clearance for the Osia 3 Sound Processor as a major upgrade to the Osia System, introducing a rechargeable lithium-ion battery and enhanced connectivity. The clearance expands premium hearing options for implant-adjacent solutions and highlights the emphasis on regulatory-ready design and post-market support in the hearing-aids ecosystem.
- December 2025: Invacare America (ASL division) launched the iON Integrated Drive Control System for power wheelchairs. The product targets user independence by integrating driving controls into a unified interface, aligning with the market shift toward sensor-rich, feature-differentiated mobility aids. The launch also supports direct engagement with prescribers and complex rehab technology channels where configuration and service capabilities influence vendor selection.
- April 2024: GF Health Products acquired substantially all assets of Transfer Master Products, expanding its footprint in hi-low adjustable beds used in home care and institutional settings. The transaction broadened manufacturing and product coverage in a category closely tied to aging-in-place and caregiver-support needs. It also adds scale advantages in sourcing, distribution, and service for large durable equipment.


Disability Devices Market Report Scope and Research Methodology
Market Definition and Coverage
The disability devices market covers assistive devices used by people with functional limitations to support mobility, hearing, vision, communication, and daily living activities. Our sizing reflects device revenues sold through healthcare and consumer channels across major regions.
Scope exclusions: services, caregiving labor, facility operating costs, and non-device digital-only apps are excluded from this market sizing.
Segments Covered in This Report
- By Device Type
- Vision Aids
- Braille Devices
- Screen Readers & Magnifiers
- Smart Glasses & Wearables
- Hearing Aids
- Behind-The-Ear
- In-The-Ear
- Bone-Anchored
- Mobility Aids
- Manual Wheelchairs
- Power Wheelchairs
- Mobility Scooters
- Prosthetics & Orthotics
- Communication Aids
- Daily Living Aids
- Other Device Types
- Vision Aids
- By End User
- Home Care Settings
- Hospitals
- Ambulatory Care Centers
- Rehabilitation Centers
- Long-Term Care Facilities
- Educational Institutions
- Workplace Settings
- By Distribution Channel
- Retail Pharmacies & DME Stores
- E-Commerce Platforms
- Direct-To-Customer (Company Owned)
- Geography
- North America
- United States
- Canada
- Mexico
- Europe
- Germany
- United Kingdom
- France
- Italy
- Spain
- Rest Of Europe
- Asia-Pacific
- China
- Japan
- India
- Australia
- South Korea
- Rest Of Asia-Pacific
- Middle East And Africa
- GCC
- South Africa
- Rest Of Middle East And Africa
- South America
- Brazil
- Argentina
- Rest Of South America
- North America
Data Sources, Market Sizing, and Validation
Desk Research
Desk research was used to map the demand pool and to keep definitions consistent across countries and care settings. We relied on public health and demographic indicators and cross-checked them with disability prevalence signals, aging profiles, and care delivery patterns.
Sources used included non-paywalled references such as the World Health Organization, the World Bank, the United Nations population statistics, OECD health statistics, and national health agencies such as the CDC and similar public bodies in other countries. We also reviewed peer-reviewed rehabilitation and assistive-technology journals, trade and customs summaries, and publicly available reimbursement and coding guidance where it was relevant for device adoption. For company-level grounding, we used annual reports, investor presentations, and earnings commentary, supported by a paid subscription that aggregates company financials, news, and patent activity for faster cross-checking. These desk sources are illustrative only, and many other public references were reviewed to collect, validate, and clarify data points during the study.
Primary Interviews and Surveys
Primary work focused on validating what is actually purchased, by whom, and through which channel, since the same device can be funded very differently across countries. We spoke with a mix of manufacturers, distributors, clinicians, rehabilitation specialists, procurement teams, and channel operators to confirm pricing bands, replacement cycles, and how new features are being adopted across settings.
Because this is a global market, we also tested assumptions across APAC, EMEA, and the Americas so the final model reflects both high-coverage markets and regions with faster growth but uneven access.
Distribution of primary research fieldwork respondents
| Company type | Respondent position | Region |
|---|---|---|
| Top tier: 37% | CXOs: 13% | APAC: 49% |
| Mid tier: 42% | Functional/Unit leaders: 38% | EMEA: 29% |
| Smaller Players: 21% | Managers: 49% | Americas: 22% |
Market-Sizing & Forecasting
We built the market using a top-down approach where disability prevalence, age mix, and care-setting utilization are translated into an addressable user pool, which is then adjusted by device penetration and typical replacement timing. To keep the totals realistic, the outputs were corroborated with selective bottom-up checks, such as sampled average selling price ranges times estimated unit volumes by major device groups, followed by channel checks across retail, e-commerce, and direct-to-customer mixes.
Key inputs used in the model included the share of elderly population, reported disability rates, adoption differences between home care and institutional settings, reimbursement coverage and out-of-pocket share signals, and observed pricing tiers for high-volume products like mobility aids, hearing aids, and vision aids. Where direct unit signals were weak, gaps were handled through proxy indicators such as procedure volumes linked to rehabilitation pathways, import patterns for relevant device categories, and interview-based adjustments to replacement cycles.
For forecasting, scenario analysis was used to reflect how coverage expansion, consumer direct purchasing, and technology feature uptake can change adoption rates at different speeds across regions. Those scenarios were kept grounded by primary feedback on expected pricing pressure, mix shift toward higher-feature devices, and realistic rollout timelines in public health systems.
Data Validation & Update Cycle
Model outputs were checked against independent signals, then reviewed for variances at the region and device-group level before final sign-off. We stress-tested growth rates against macro indicators like aging trends and healthcare spend direction, and we re-contacted sources when unusual jumps showed up in pricing, penetration, or channel mix.
Each report is refreshed annually, and interim updates are made when material events occur, such as major reimbursement changes or notable regulatory actions that can move demand. Before delivery, an analyst completes a final pass to make sure the latest public information is reflected in the narrative and the market numbers.
Mordor Intelligence's Disabiltiy Devices Market Estimate Compared With Other Published Estimates
Published market sizes for disability devices often vary because the product basket and the counted revenue stream are not defined the same way, even when the titles look similar. Differences also come from what year is treated as the current estimate, how pricing is averaged across premium and basic devices, and how quickly assumptions are refreshed.
Personal care services and home nursing spend sit outside Mordor Intelligence's scope, which is one reason some broader assistive-market figures land higher even when they cite similar demand drivers. In addition, some publishers blend adjacent consumer electronics into communication aids, or they apply uniform global price curves without adjusting for reimbursement limits and channel mix, which can shift totals up or down depending on the base year and currency timing.
Benchmark comparison
| Source | Market Size | Gaps in Research Methodology |
|---|---|---|
| Mordor Intelligence | USD 23.69 B (2026) | |
| Trade Journal A | USD 28.50 B (2024) | Uses a broader assistive-technology frame that commonly includes paid services and some non-device solutions, and it anchors sizing to an earlier base year that can inflate comparisons if pricing is not normalized across regions. |
| Industry Publisher B | USD 31.40 B (2023) | Blends wider vulnerable-group assistive spending with device revenue, and it tends to apply a single global growth curve that can miss reimbursement-led price ceilings and channel mix shifts by country. |
Overall, the spread is largely explained by what is counted as a device market versus a wider assistive-spend market, and by the choice of base year. Our approach stays traceable to a clear user pool, realistic penetration and replacement timing, and pricing bands that were repeatedly checked across channels and regions, which helps keep the estimate reproducible and consistent year to year.


Key Questions Answered in the Report
How large is the disability devices market in 2026?
The disability devices market size is USD 23.69 billion in 2026, and it is forecast to reach USD 31.14 billion by 2031.
Which device category is growing the fastest?
Communication Aids are expanding the quickest, posting a projected 7.54% CAGR through 2031 as augmentative and alternative communication tools gain mainstream adoption.
Which end-user segment will see the highest growth?
Educational Institutions are expected to record a 7.87% CAGR through 2031 due to universal-design mandates and individualized education programs.
What region is expected to lead growth?
Asia-Pacific is projected to achieve the fastest 6.43% CAGR, driven by China’s and Japan’s aging populations and supportive government programs.
What is the main barrier to wider adoption?
High upfront costs for advanced devices, such as microprocessor prosthetics and cochlear implants, remain the primary obstacle, especially in low-income regions.
How are online channels affecting sales?
E-Commerce Platforms are growing at an 8.22% CAGR, enabled by virtual consultations, insurance verification, and subscription models for consumables.
Page last updated on:


 Your data is secure and never sold or shared.


