
Dimethylformamide Market Size and Share
Market Overview
| Study Period | 2020 - 2031 |
|---|---|
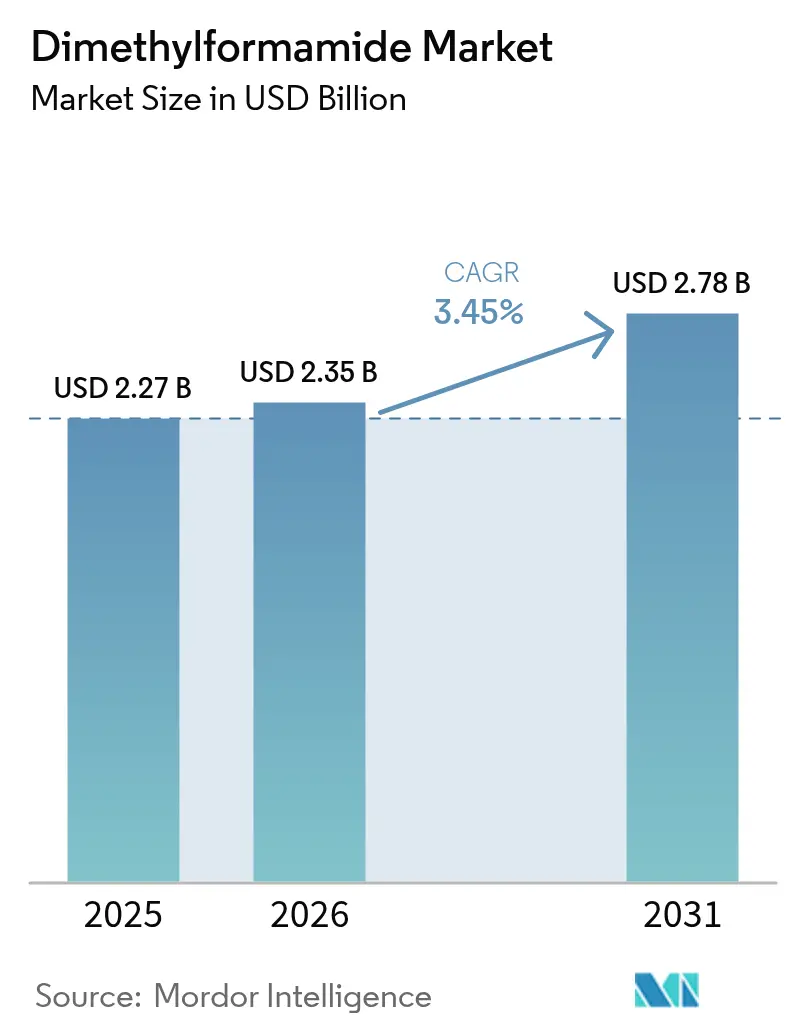
| Market Size (2026) | USD 2.35 Billion |
| Market Size (2031) | USD 2.78 Billion |
| Growth Rate (2026 - 2031) | 3.45 % |
| Fastest Growing Market | Asia-Pacific |
| Largest Market | Asia-Pacific |
| Market Concentration | Medium |
Major Players *Disclaimer: Major Players sorted in no particular order Image © Mordor Intelligence. Reuse requires attribution under CC BY 4.0. | |
Dimethylformamide Market Analysis by Mordor Intelligence
Dimethylformamide market size in 2026 is estimated at USD 2.35 billion, growing from 2025 value of USD 2.27 billion with 2031 projections showing USD 2.78 billion, growing at 3.45% CAGR over 2026-2031. Adoption remains resilient as dimethylformamide’s (DMF’s) polar aprotic nature enables efficient polymer dissolution, peptide synthesis, and high-performance battery electrolyte formulation. Expansion in Asia-Pacific’s chemical base, particularly new DMF capacity in India, reinforces regional supply security even as North America’s single-producer structure exposes buyers to concentration risk. Demand tailwinds also emerge from flexible OLED films and lithium-ion battery electrolytes, where DMF’s low viscosity and strong coordination with Li ions enhance device efficiency. Regulatory scrutiny in Europe is accelerating purification investments and research into greener alternatives rather than triggering abrupt declines, allowing incumbents to preserve margins through specialty grades and vertical integration.
Key Report Takeaways
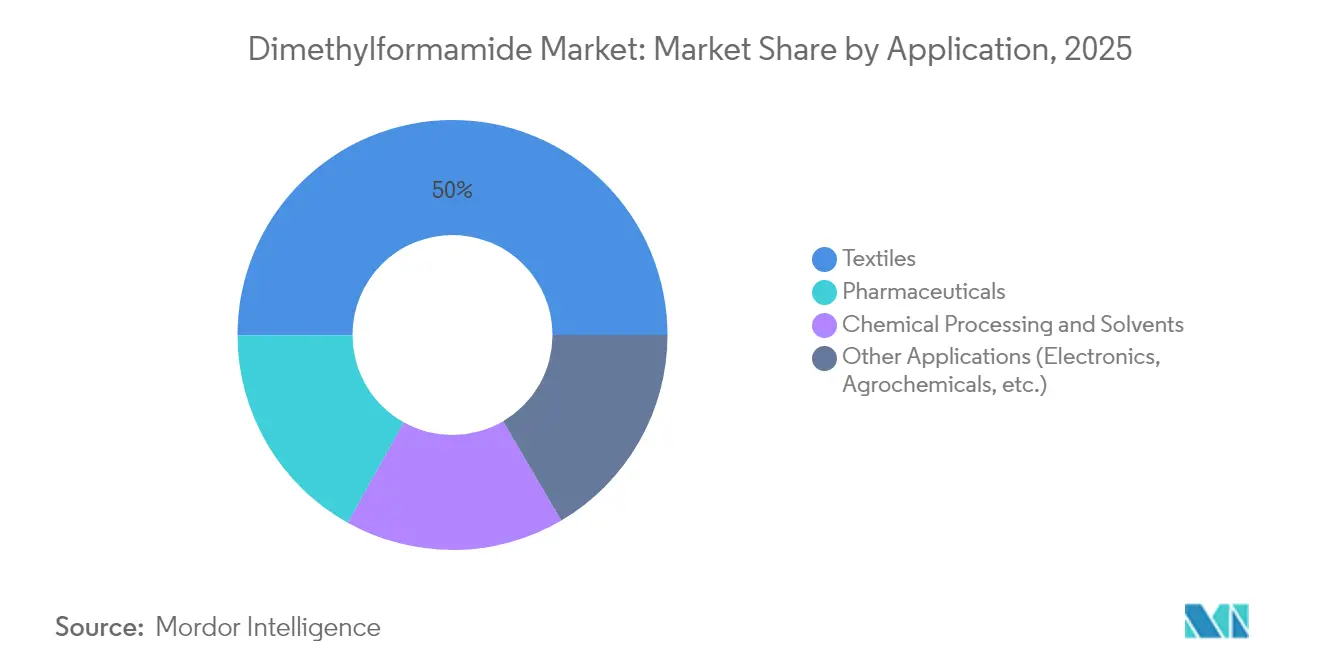
- By application, textiles retained 50.02% of dimethylformamide market share in 2025 while pharmaceuticals posted the fastest 4.42% CAGR through 2031.
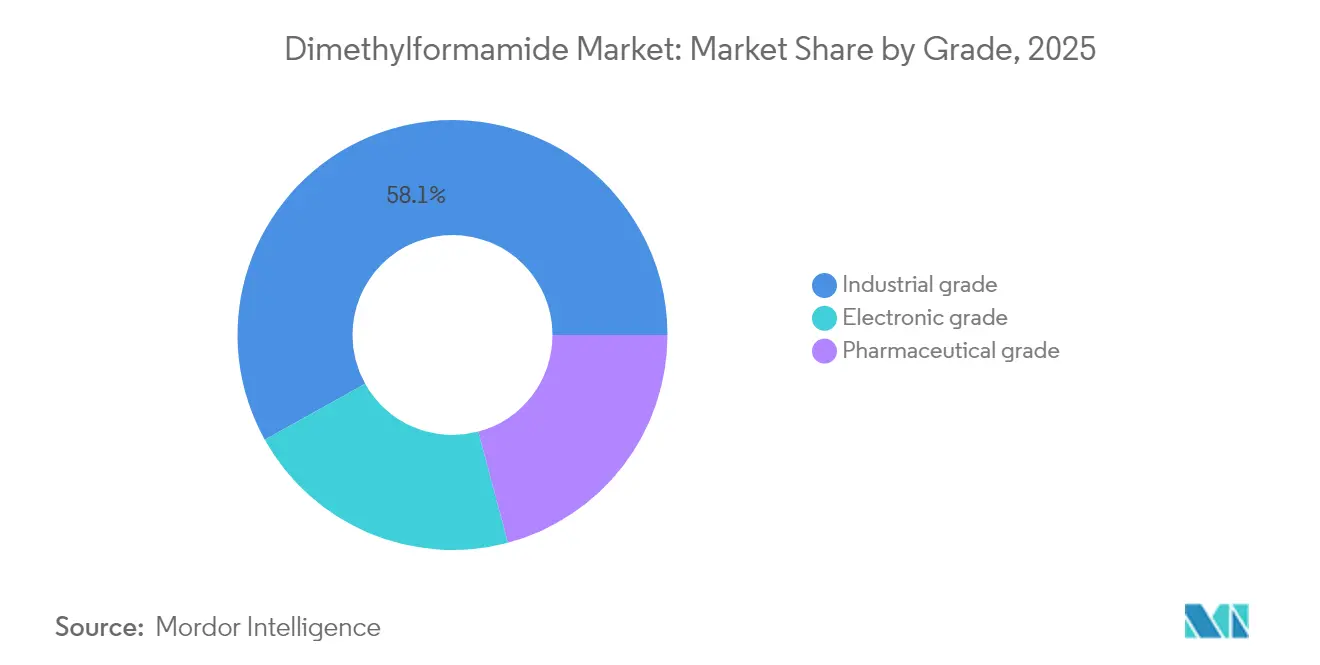
- By grade, industrial-grade captured 58.10% of the dimethylformamide market size in 2025; electronic-grade is projected to grow at a 4.88% CAGR to 2031.
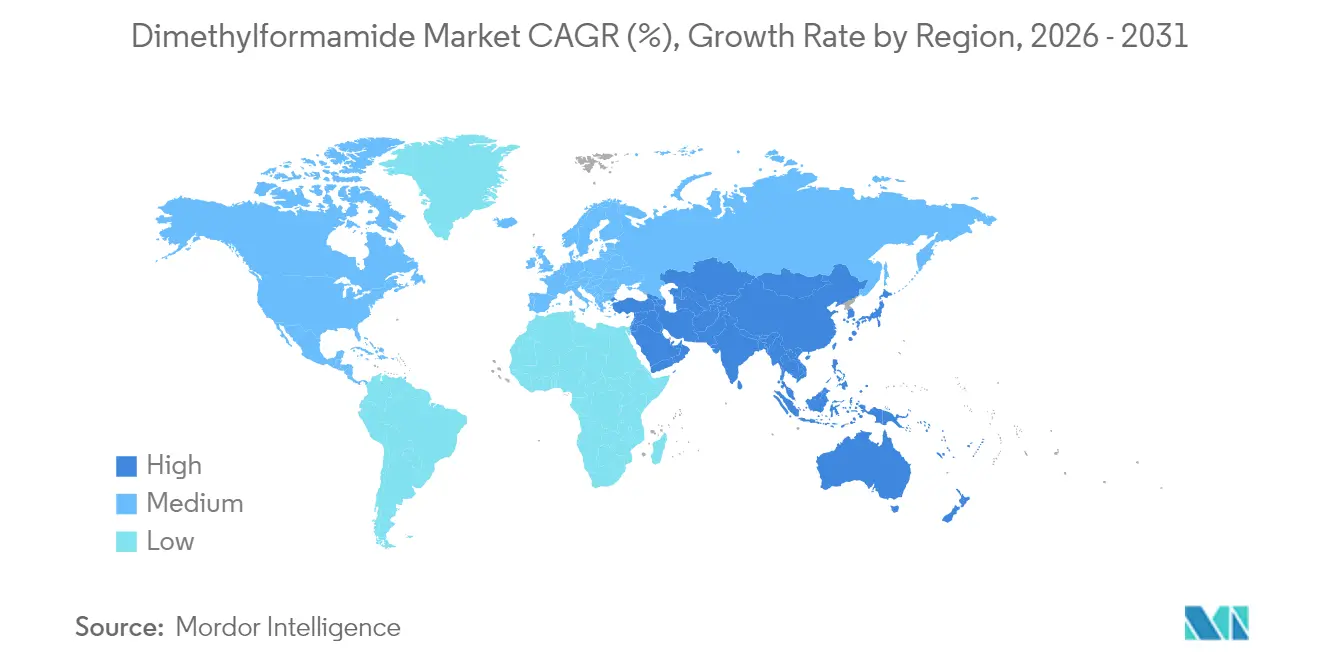
- By geography, Asia-Pacific commanded 68.65% revenue share of the dimethylformamide market in 2025, and the region is set to expand at 3.88% CAGR through 2031.
Note: Market size and forecast figures in this report are generated using Mordor Intelligence’s proprietary estimation framework, updated with the latest available data and insights as of 2026.
Market Trends and Insights
Drivers Impact Analysis of Dimethylformamide Market*
| Driver | (~) % Impact on CAGR Forecast | Geographic Relevance | Impact Timeline |
|---|---|---|---|
| Growing demand from the pharmaceutical sector | +1.2% | Global, notably India & China | Medium term (2-4 years) |
| Expanding industrial solvent applications | +0.8% | Asia-Pacific core, spill-over to North America | Long term (≥ 4 years) |
| High-performance lithium-ion battery electrolytes | +0.9% | Global, early gains in China & South Korea | Short term (≤ 2 years) |
| Rapid growth of flexible OLED & photovoltaic films | +0.7% | Asia-Pacific & North America | Medium term (2-4 years) |
| Rising polyurethane production needs | +0.6% | Global | Long term (≥ 4 years) |
| Source: Mordor Intelligence | |||
Growing Demand from the Pharmaceutical Sector
Peptide synthesis and active pharmaceutical ingredient (API) manufacturing rely on DMF as a clean, low-water solvent that supports high product yields. India has expanded API output under domestic incentive schemes, elevating DMF consumption in Hyderabad and Vizag clusters. Leading producers now market peptide-grade DMF with ultra-low amine content, an attribute that minimizes side reactions during chain elongation[1]. Multinational contract manufacturers have responded with multi-million-euro investments in continuous purification units, reinforcing dependable supply for oncology and diabetes therapies. While greener solvent trials are under way, slow regulatory validation in good-manufacturing-practice settings means demand remains robust through the medium term.
Increasing Industrial Applications of DMF as Solvent
DMF’s strong solvency power, high flash point, and thermal stability make it indispensable for polyurethane coatings, synthetic leather, and acrylonitrile polymer spinning. Bio-based polyurethanes formulated with lignin derivatives show improved tensile strength when processed in DMF baths. Petroleum refiners also maintain DMF usage for aromatics extraction because switching would require costly re-engineering of solvent recovery units.
Growth of High-Performance Lithium-Ion Battery Electrolytes Using DMF Blends
Electrochemical studies illustrate that DMF co-solvation reduces viscosity and raises ionic conductivity in propylene-carbonate electrolyte systems, delivering stable discharge at –20 °C . PVDF-based gel electrolytes retain 94% capacity after 1,000 cycles when trace DMF modifies polymer crystallinity. Korean cathode makers now specify battery-grade DMF below 10 ppm moisture to prevent hydrofluoric acid formation during cycling, boosting solvent premiums over industrial grades.
Rapid Expansion of Flexible OLED & Photovoltaic Films Requiring DMF Cleaning Baths
Perovskite solar cells achieve power conversion efficiencies above 15% when lead halide precursors are dissolved in DMF-rich solvent systems that yield defect-free films. Similarly, polymer light-emitting diodes double luminous efficiency after DMF post-treatments create favorable interfacial dipoles. As display fabs migrate to foldable substrates, DMF’s low surface tension enables uniform coating of micro-thin layers across curved panels produced in South Korea and Japan.
Restraints Impact Analysis of Dimethylformamide Market*
| Restraint | (~) % Impact on CAGR Forecast | Geographic Relevance | Impact Timeline |
|---|---|---|---|
| Health-related hazards linked to DMF | -0.8% | Global, especially EU & North America | Short term (≤ 2 years) |
| Competition from alternative solvents | -0.6% | Global | Medium term (2-4 years) |
| High production cost | -0.4% | Global | Long term (≥ 4 years) |
| Source: Mordor Intelligence | |||
Health Related Hazards Associated with Dimethylformamide
Clinical evidence connects chronic DMF exposure to liver toxicity, prompting strict workplace exposure limits. The US National Institute for Occupational Safety and Health designates 500 ppm as immediately dangerous, while the EU caps inhalation exposure at 6 mg/m³[2]. Fabric-coating plants have adopted closed-loop solvent recovery and real-time vapor monitoring, yet compliance investments raise operating costs and encourage evaluation of lower-toxicity substitutes.
Competition from Alternative Solvents
Green-chemistry programmes have catalogued over 130 candidate replacements, ranging from γ-valerolactone to dimethyl sulfoxide. Certain perovskite cell lines now pilot 1,3-dimethyl-2-imidazolidinone, while propylene carbonate trials in butadiene extraction satisfy efficiency and regulatory criteria. Adoption speed varies: high-purity electronics and pharmaceutical users resist substitution because trace differences in polarity or boiling point can derail yields, whereas commodity coatings migrate sooner if cost parity is achieved.
*Our forecasts treat driver/restraint impacts as directional, not additive. The impact forecasts reflect baseline growth, mix effects, and variable interactions.
Dimethylformamide Market Segment Analysis
By Application:
Textile Dominance Faces Pharmaceutical DisruptionTextile production captured 50.02% of 2025 dimethylformamide market share, centred on acrylic fiber wet-spinning where DMF dissolves acrylonitrile polymers efficiently. Despite perennial volume, fast-fashion sustainability targets and solvent-recovery mandates temper incremental growth. Conversely, pharmaceuticals deliver the highest 4.42% CAGR through 2031, buoyed by peptide-drug pipelines and Asia-based API capacity expansions. The dimethylformamide market size tied to chemical processing and solvents remains stable as polyurethane coatings and petroleum aromatics separation offset gradual declines in legacy synthetic leather. Electronics applications, from battery electrolyte blends to OLED cleaning, introduce an avenue of diversified value, cushioning cyclical swings in textiles.
Continued pharmaceutical momentum reflects an aging global population and rising chronic disease incidence. Contract development and manufacturing organizations (CDMOs) in Europe and Asia increasingly demand peptide-grade DMF certified for ultra-low amine and acid content, reinforcing supplier emphasis on high-margin purification technology. Chemical intermediates also rely on DMF for formylation reactions and as a reaction medium in specialty agrochemical synthesis, extending the solvent’s relevance beyond headline sectors. Collectively, these dynamics enable the dimethylformamide market to balance regulation-induced headwinds in consumer fabrics with upside from life-science innovation.

By Grade:
Industrial Applications Drive Volume While Electronics Demand PremiumIndustrial-grade DMF supplied 58.10% of global volume in 2025, underpinning core textile spinning, synthetic leather, and polyurethane coatings where specification thresholds are less stringent. Even as recyclers reclaim solvent streams and alternative blends nibble at share, the segment remains a backbone for mid-tier producers because cost sensitivity dominates purchasing decisions. The electronic-grade category, though smaller, grows at a 4.88% CAGR thanks to surging semiconductor fab investments and the rapid scaling of electric-vehicle battery plants. Here, the dimethylformamide market size revolves around sub-ppm water content and metal ion controls that command pricing premiums.
Continuous electrodeionization and multi-stage distillation allow producers to achieve resistivity and impurity thresholds demanded by lithography and cathode-active-material synthesis. Pharmaceutical-grade DMF, occupying the highest value tier, addresses stringent GMP protocols, necessitating extensive analytical documentation and trace impurity certificates. Suppliers leveraging integrated production with captive methanol and formic acid assets hedge against feedstock volatility, consolidating bargaining power in this specialty bracket. Industrial-grade players, meanwhile, focus on improving solvent-recovery loops to comply with tightening emission norms while defending margins.
Geography Analysis
APAC Dimethylformamide Market
Asia-Pacific controlled 68.65% of dimethylformamide market share in 2025, with China’s massive acrylic fiber capacity, broad chemical complex integration, and swelling battery materials demand leading consumption. Balaji Amines’ forthcoming 30,000-ton DMF unit in Maharashtra underlines India’s intent to localize critical raw materials amid talent-rich pharmaceutical clusters. South Korea and Japan add premium pull through OLED fabs and solid-state battery pilots, requiring electronic-grade volumes that lift overall regional ASPs. Regulatory convergence toward stricter VOC emissions is progressing, yet large integrated sites leverage economies of scale to retrofit scrubbing and solvent-recovery systems without hampering supply.
North America Dimethylformamide Market
North America maintains second position, yet production is concentrated in one West Virginia facility operated by Belle Chemical. This concentration exposes the region to outage risk, amplified by rising petrochemical integration initiatives in the US Gulf Coast. On the demand side, pharmaceutical complexes in the Northeast and Midwest remain steady consumers, while EV battery supply chains emerging in Michigan and Tennessee offer upside to electronic-grade shipments.
Europe Dimethylformamide Market
Europe faces the most stringent workplace exposure environment, with REACH restricting DMF inhalation to 6 mg/m³ and dermal uptake to 1.1 mg/kg/day. Germany’s sophisticated chemical infrastructure still relies on DMF for high-performance polyimide membranes, although R&D programmes jointly funded by industry and academia are testing bio-derived lactones as drop-in substitutes. The regional transition is gradual, enabling incumbent producers to maintain specialty sales while investing in process-safety upgrades.
MEA and South America Dimethylformamide Market
South America and the Middle East & Africa together account for a modest slice of the dimethylformamide market. Brazil’s petrochemical hubs in São Paulo leverage DMF for polyurethane coatings on grain-storage facilities, while Saudi Arabia integrates DMF into downstream value chains at new chemical parks aligned with Vision 2030. Limited domestic production in these regions necessitates imports, and currency swings remain a key variable influencing landed cost competitiveness.
Value Chain Analysis
The DMF value chain starts with upstream feedstocks used to produce dimethylamine (DMA) and carbon monoxide (CO), typically sourced from methanol and ammonia value chains for DMA and from syngas-based routes for CO. Industrial DMF is predominantly manufactured via direct carbonylation of DMA with CO under moderate pressure and elevated temperature using a base catalyst. A secondary route uses aminolysis of methyl formate. Producers then tailor output into industrial, electronic, and pharmaceutical/peptide grades through multi-stage distillation and impurity control, with higher grades requiring tighter moisture and amine specifications and more intensive QA documentation.
Downstream, DMF is distributed in bulk and drums through chemical distributors and direct supply contracts to textile wet-spinning and synthetic leather producers, chemical processors (including aromatics extraction), and specialty users in pharmaceuticals and electronics. Asia-Pacific anchors the supply base, with Chinese capacity concentrated in provinces such as Shandong, Zhejiang, and Jiangsu, and trade flows supporting import-dependent regions such as Europe under tighter REACH compliance. Common bottlenecks include short-notice safety and environmental audits at chemical facilities that interrupt output, and logistics constraints such as port congestion (noted in northern Chinese ports in mid-2025) that can delay both feedstock movement and finished DMF shipments. These dynamics tend to favor backward-integrated producers and customers with diversified sourcing plus recycling and solvent-recovery loops.
Competitive Landscape
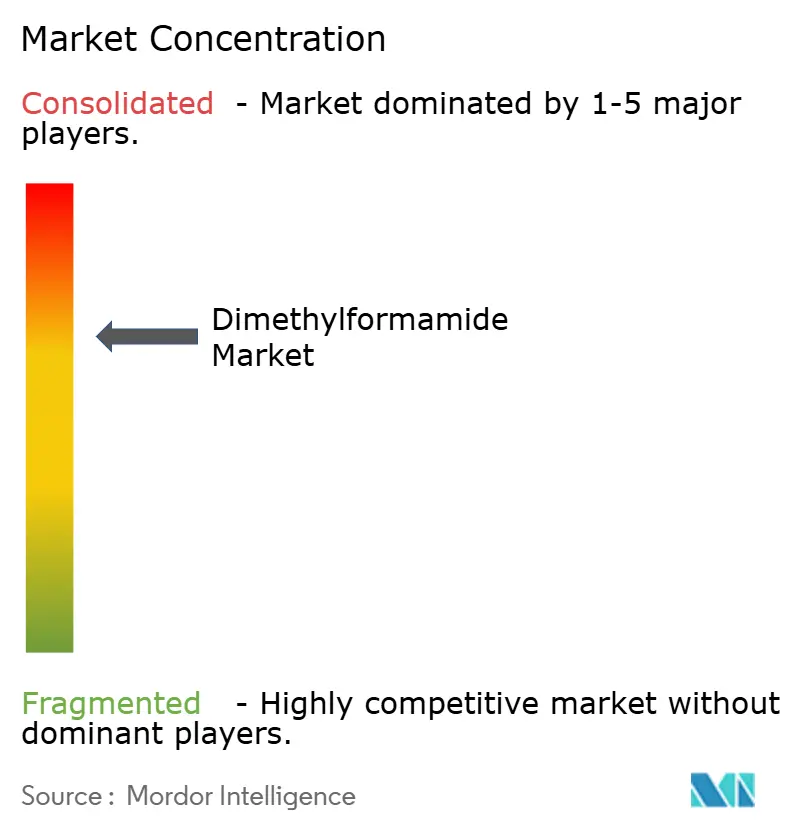
The market is moderately concentrated, with BASF, Eastman Chemical Company, and Mitsubishi Gas Chemical Company Inc. leveraging vertically integrated assets. BASF’s Verbund strategy ensures cost efficiency across solvent lines, while Eastman targets life-science clients with peptide-grade innovations and low-amine DMF. Mitsubishi’s advanced electrodeionization technology supports electronic-grade supply for Japanese and Taiwanese semiconductor makers. Chinese firms like Luxi Chemical Group and Shandong Hualu-Hengsheng offer competitive volumes but face environmental audits and stricter regulations, impacting availability. Industry-wide, companies are adopting circular-economy practices, including solvent recycling and renewable energy use. From 2024-2025, capacity expansions, purification technology acquisitions, and green-solvent R&D partnerships will drive growth. Regulatory compliance will intensify competition, favoring producers capable of capital upgrades, while smaller players may exit or shift to less-regulated solvents.
Dimethylformamide Industry Leaders
-
Shandong Hualu Hengsheng Chemical Co. Ltd
-
BASF
-
Eastman Chemical Company
-
Luxi Chemical Group Co., Ltd.
-
Mitsubishi Gas Chemical Company Inc.
- *Disclaimer: Major Players sorted in no particular order
Dimethylformamide Market Companies Covered in this Report
- Arclin
- Ashland
- Balaji Amines
- BASF
- Chemanol
- Eastman Chemical Company
- Jiangsu Saida Chemical Co., Ltd.
- Jiutian Chemical Group Ltd.
- Luxi Chemical Group Co., Ltd.
- Mitsubishi Gas Chemical Company Inc.
- Pon Pure Chemicals Group
- Shandong Hualu-Hengsheng Chemical Co., Ltd.
- Shandong Jinmei Riyue Industry Co., Ltd.
- Zhejiang Jiangshan Chemical Co., Ltd.
Market Opportunities and Future Outlook
Supply resilience and localization outside China is a key whitespace area, particularly where buyer exposure to single-site or import-dependent sourcing is high. In North America, capacity concentration increases the value of incremental domestic output and multi-grade capability. Arclin has stated an investment program to expand DMF production at its Belle, West Virginia facility, targeting end-2026 operations and doubling capacity, which supports procurement diversification for regional textiles, chemical processing, and higher-spec users. In Asia-Pacific, ongoing expansion in India and entrenched consumption in China continue to support opportunities for integrated producers and distributors that can provide steady volume, alongside solvent-recovery solutions for textile and coatings customers managing VOC controls.
A second opportunity is premiumization around higher-purity DMF for electronics and pharmaceutical manufacturing, where moisture and trace impurity specifications create qualification barriers and support longer-term supply agreements. Demand in lithium-ion battery materials (PVDF processing and electrolyte formulation) and flexible OLED or photovoltaic film processing favors electronic-grade and low-moisture product offerings, while peptide synthesis and API manufacturing sustain pharmaceutical and peptide-grade requirements. Separately, EU REACH restrictions on DMF, including the December 2025 extension to dry and wet spinning of synthetic fibers, create near-term needs for compliance services (exposure control, monitoring, and documentation) and reformulation work. Suppliers that pair DMF with stewardship support and validated lower-emission handling systems can defend share in regulated end uses even as substitution screening expands in research settings.
Recent Industry Developments in Dimethylformamide Market
- May 2026: Eastman Chemical Company implemented a price increase for dimethylformamide (DMF) in the Americas effective May 1, 2026. The move followed earlier adjustments and indicated continued cost pass-through in amines-related chains, tightening budgeting for downstream buyers in pharmaceuticals, coatings, and battery materials that use DMF as a solvent.
- April 2026: Eastman Chemical Company implemented a DMF price increase in the Americas effective April 1, 2026. The action reflected ongoing input and operating-cost pressures and reinforced the need for multi-sourcing and contract structures that manage solvent cost volatility for high-purity and industrial users.
- August 2024: Arclin announced plans to expand DMF production at its Belle, West Virginia facility, with the project targeting operational readiness by 2026. By adding domestic capacity in a concentrated regional supply landscape, the investment supports supply security for US customers and improves flexibility to serve multiple end uses with differentiated grades.
Dimethylformamide Market Report Scope and Research Methodology
Market Definition and Coverage
This market covers the value of dimethylformamide (DMF) sold as a solvent and chemical intermediate across end-use manufacturing, counted at the point where DMF is supplied to external customers and reported in USD.
Scope exclusions: Captive or in-process DMF that is produced and consumed within the same site without an external sale is not counted.
Segments Covered in This Report
- By Application
- Chemical Processing and Solvents
- Pharmaceuticals
- Textiles
- Other Applications (Electronics, Agrochemicals, etc.)
- By Grade
- Industrial grade
- Electronic grade
- Pharmaceutical grade
- By Geography
- Asia Pacific
- China
- India
- Japan
- South Korea
- Rest of Asia Pacific
- North America
- United States
- Canada
- Mexico
- Europe
- Germany
- United Kingdom
- France
- Italy
- Rest of Europe
- South America
- Brazil
- Argentina
- Rest of South America
- Middle East and Africa
- Saudi Arabia
- South Africa
- Rest of Middle-East and Africa
- Asia Pacific
Data Sources, Market Sizing, and Validation
Desk Research
Desk research starts with building a clean fact base on where DMF demand comes from and how supply is shaped, before revenue sizing. We mostly used public reference points such as US EPA chemistry and risk pages, ECHA substance dossiers, UN Comtrade trade statistics, USITC tariff and import tables, and open publications from groups like the International Energy Agency for broader industrial activity context.
We also reviewed producer disclosures that are openly available, including annual reports, investor presentations, and plant announcements carried by reputable chemical-industry press, to map capacity changes and utilization signals. Where the public trail was thin, we used paid company-financial intelligence and a shipment-level import-export database to cross-check trade-flow direction and price ranges. These examples are illustrative, and we referred to other public sources as well during data collection, validation, and research clarification.
Primary Interviews and Surveys
Primary work was used to verify what DMF grades are actually sold into each use case, and to pressure-test price movement and utilization assumptions that are hard to confirm from public sources alone. We spoke with a mix of manufacturers, distributors, and downstream buyers in textiles, pharma, and chemical processing, and we kept coverage balanced across the main consuming regions to avoid missing local supply or trade constraints.
Distribution of primary research fieldwork respondents
| Company type | Respondent position | Region |
|---|---|---|
| Top tier: 31% | CXOs: 13% | APAC: 42% |
| Mid tier: 52% | Functional/Unit leaders: 31% | EMEA: 37% |
| Smaller Players: 17% | Managers: 56% | Americas: 21% |
Market-Sizing & Forecasting
For the core model, we sized the market using a top-down build that reconstructs the DMF demand pool from end-use activity and observed trade patterns, then converts that demand into revenue using region-level pricing. Once that structure was in place, we used selective bottom-up approximations, including sampled supplier roll-ups, distributor channel checks, and an average selling price times volume cross-check, to ensure totals were not drifting.
Inputs were chosen because they can be tracked over time with reasonable effort. Key examples include DMF import and export volumes by major countries, operating-rate signals for DMF-linked capacity, price direction for key feedstocks that influence DMF pricing, end-use output indicators in textiles and synthetic leather, and pharma and chemical manufacturing activity trends that affect solvent consumption. When some country splits were not directly visible, we handled gaps using trade proxies and consumption shares validated through interviews, then rebalanced so regional totals still matched the global control.
Forecasting was done using scenario analysis supported by regression checks on the most explanatory drivers, followed by expert review to keep assumptions realistic. Where the driver outlook differed by region, we applied region-specific growth paths and rolled them up to the global result.
Data Validation & Update Cycle
Outputs were checked against independent signals like trade balance logic, known capacity additions, and whether implied prices stayed within credible ranges for the year being modeled. If a region showed a sharp jump that could not be explained by capacity, imports, or end-use pull, we revisited assumptions and re-engaged primary contacts to confirm what changed.
A multi-step internal review is followed so calculation steps are consistent across countries, and key inputs are challenged before sign-off. The model is refreshed at least annually, and an interim update is triggered when a material event occurs, such as a major plant shutdown, new capacity start-up, or a policy change affecting solvent use. Before delivery, the analyst team does a final pass to ensure the latest public data points have been incorporated.
Mordor Intelligence's Dimethylformamide Market Size Compared Against Other Published Estimates
Published DMF market numbers often vary because different studies do not count the same transaction points, and they also pick different base years and price logic. Some estimates lean more on a single set of end-use assumptions, while others rely more on trade and supply signals, which can move the total up or down.
The biggest differences usually come from whether captive consumption is included, how grades are treated when DMF is used as a processing aid, and the way currency conversion and inflation are applied across regions. In our case, the 2026 value ties to external sales and is reconciled with capacity and trade checks, which helps explain why the 2024-centric revenue builds used by some publishers land lower or higher, a scope choice applied by Mordor Intelligence.
Benchmark comparison
| Source | Market Size | Gaps in Research Methodology |
|---|---|---|
| Mordor Intelligence | USD 2.35 B (2026) | |
| Global Research Publisher A | USD 1.48 B (2024) | Uses a 2024 base year with a steeper growth profile and may apply a tighter definition of DMF demand that leans on select end-use industries, which can undercount solvent consumption in processing uses. |
| Industry Research Publisher B | USD 2.45 B (2024) | Reports a higher 2024 value that may reflect broader inclusion of internal consumption and a different pricing progression method across regions, which can lift the revenue total even when volume signals are similar. |
The spread in the table mainly comes down to the year chosen for the anchor value and whether the counted volumes are only external sales or also include internal usage, followed by how regional prices are rolled forward. By keeping the calculation tied to observable trade and supply signals and then validating the implied demand with interviews, we keep a practical trail from assumptions to the final number.
Key Questions Answered in the Report
What is the current size of the dimethylformamide market and how large is it expected to be by 2031?
The market stands at USD 2.35 billion in 2026 and is forecast to reach USD 2.78 billion by 2031.
Why does Asia-Pacific hold the largest share of dimethylformamide demand?
China’s dominant acrylic-fiber capacity, India’s upcoming 30,000-ton plant, and robust electronics manufacturing give the region 68.65% share and a 3.88% CAGR outlook.
Which application is expected to grow the fastest?
Pharmaceuticals lead with a 4.42% CAGR, driven by peptide-synthesis and API capacity expansion in India and China.
What key regulations influence market dynamics in Europe and North America?
EU REACH caps workplace DMF exposure at 6 mg/m³ inhalation and 1.1 mg/kg/day dermal, while US NIOSH sets a 10 ppm TWA limit, prompting investments in closed-loop recovery and greener solvent research.