
Digital Trust Market Size and Share
Market Overview
| Study Period | 2020 - 2031 |
|---|---|
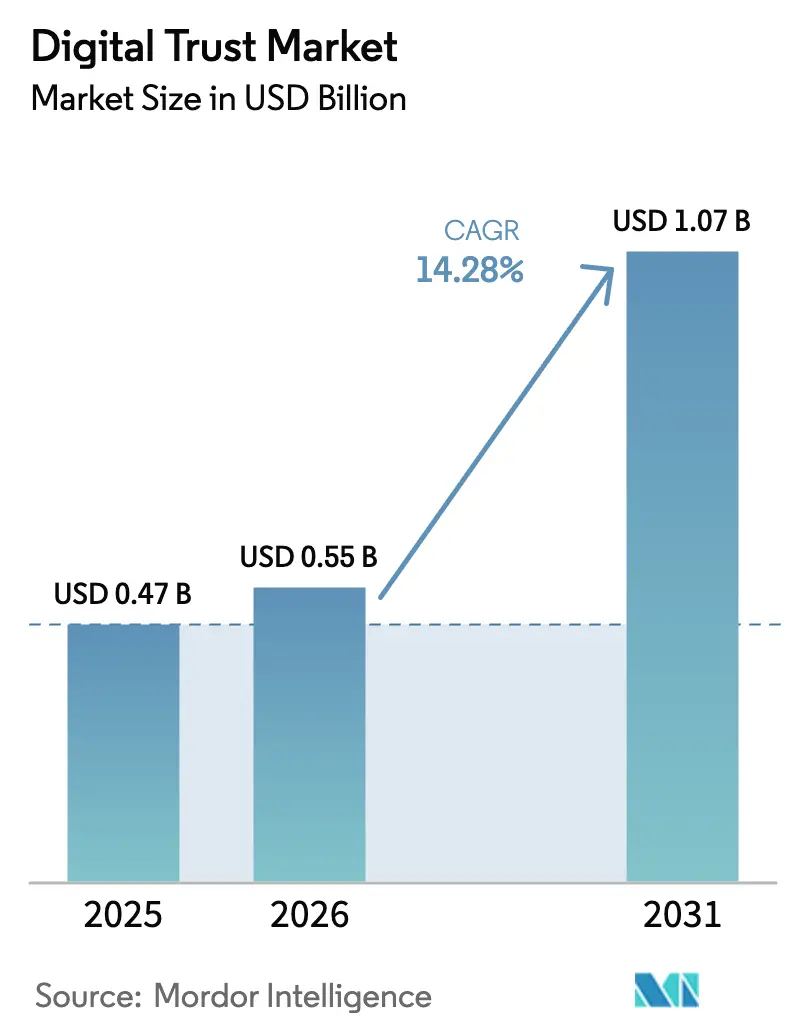
| Market Size (2026) | USD 0.55 Billion |
| Market Size (2031) | USD 1.07 Billion |
| Growth Rate (2026 - 2031) | 14.28% CAGR |
| Fastest Growing Market | Asia Pacific |
| Largest Market | North America |
| Market Concentration | Low |
Major Players *Disclaimer: Major Players sorted in no particular order Image © Mordor Intelligence. Reuse requires attribution under CC BY 4.0. | |
Digital Trust Market Analysis by Mordor Intelligence
The digital trust market size is projected to be USD 471.96 billion in 2025, USD 550.58 billion in 2026, and reach USD 1,073.18 billion by 2031, growing at a CAGR of 14.28% from 2026 to 2031. A sharp rise in data-breach losses, the spread of zero-trust architecture, and proliferating privacy laws are converging to turn identity-centric controls into board-level priorities. Organizations are moving from perimeter tools to continuous authentication in response to 80% of 2024 breaches involving stolen credentials, while regulators have tightened disclosure windows to as short as four business days. At the same time, cloud migration is accelerating the consolidation of identity providers, and artificial intelligence is being weaponized by both attackers and defenders, reshaping vendor roadmaps toward ML-powered detection. Demand is therefore bifurcating enterprises still purchase platform licenses, but the fastest revenue growth is coming from managed services that integrate threat intelligence, automated response, and compliance reporting.
Key Report Takeaways
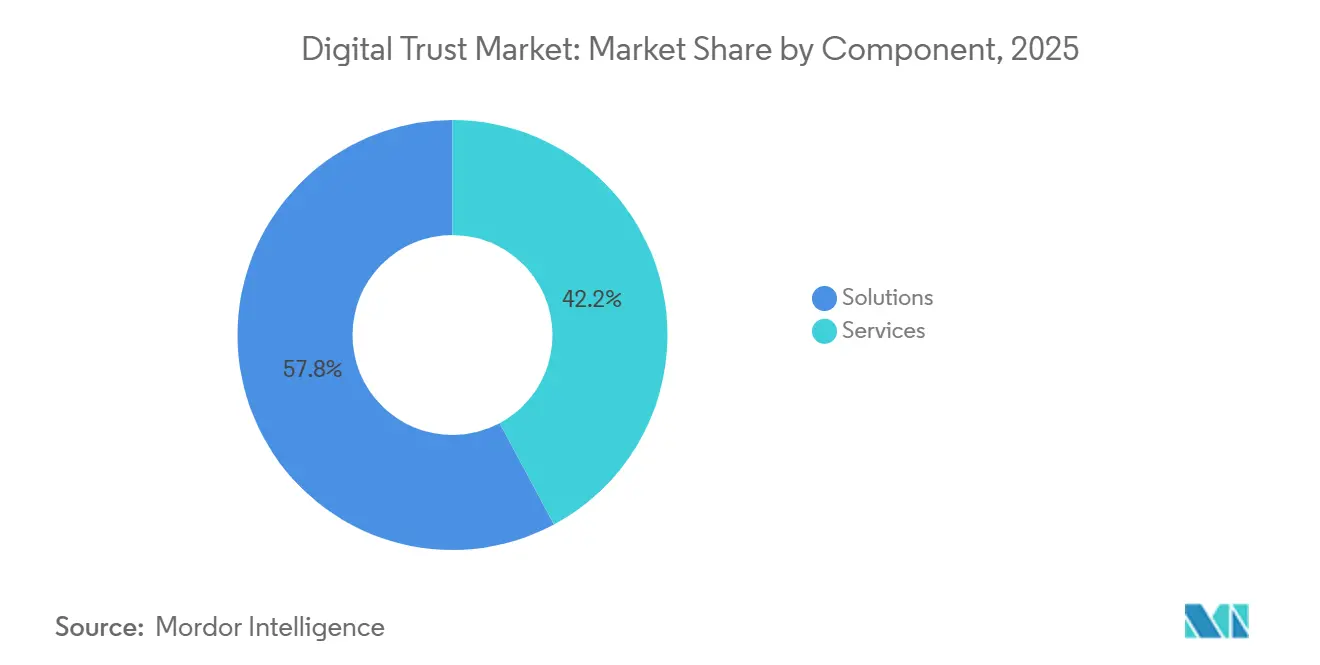
- By component, solutions held 57.82% revenue share of the digital trust market in 2025, while services are advancing at a 14.99% CAGR through 2031.
- By deployment mode, cloud-based offerings commanded 71.37% of 2025 spending, and they are expanding at a 14.76% CAGR to 2031.
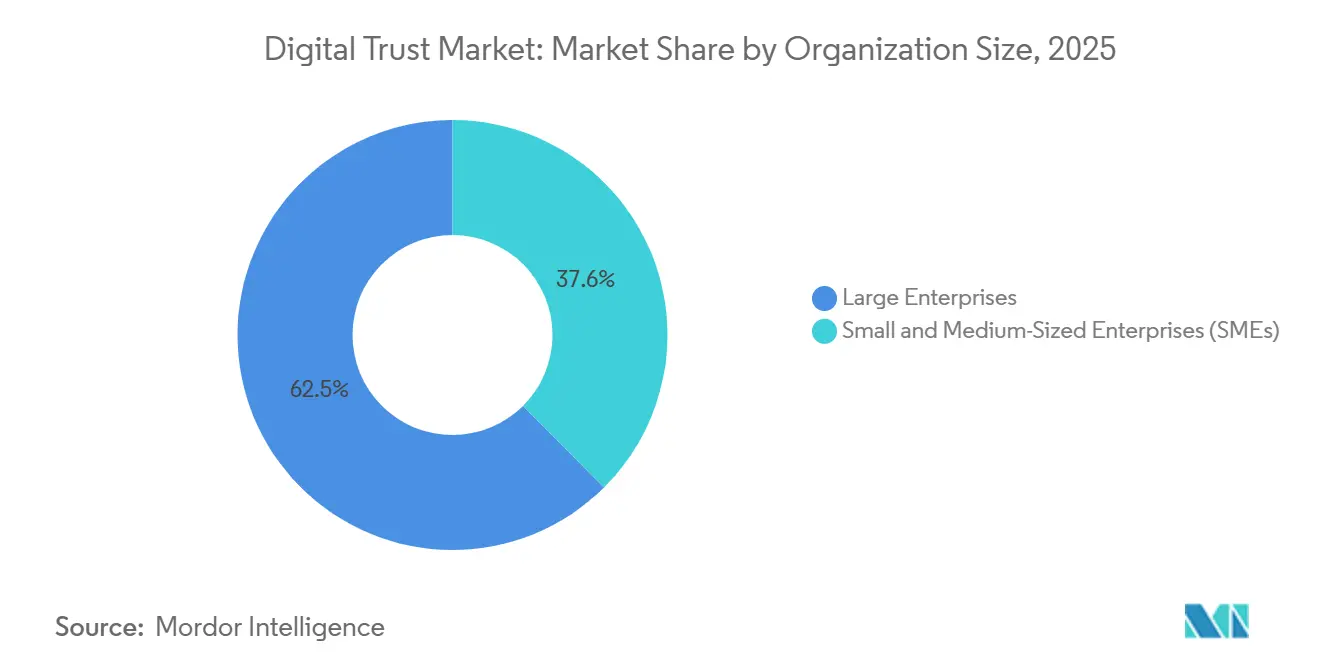
- By organization size, large enterprises accounted for 62.45% of 2025 outlays, whereas small and medium-sized enterprises are scaling adoption at a 14.86% CAGR.
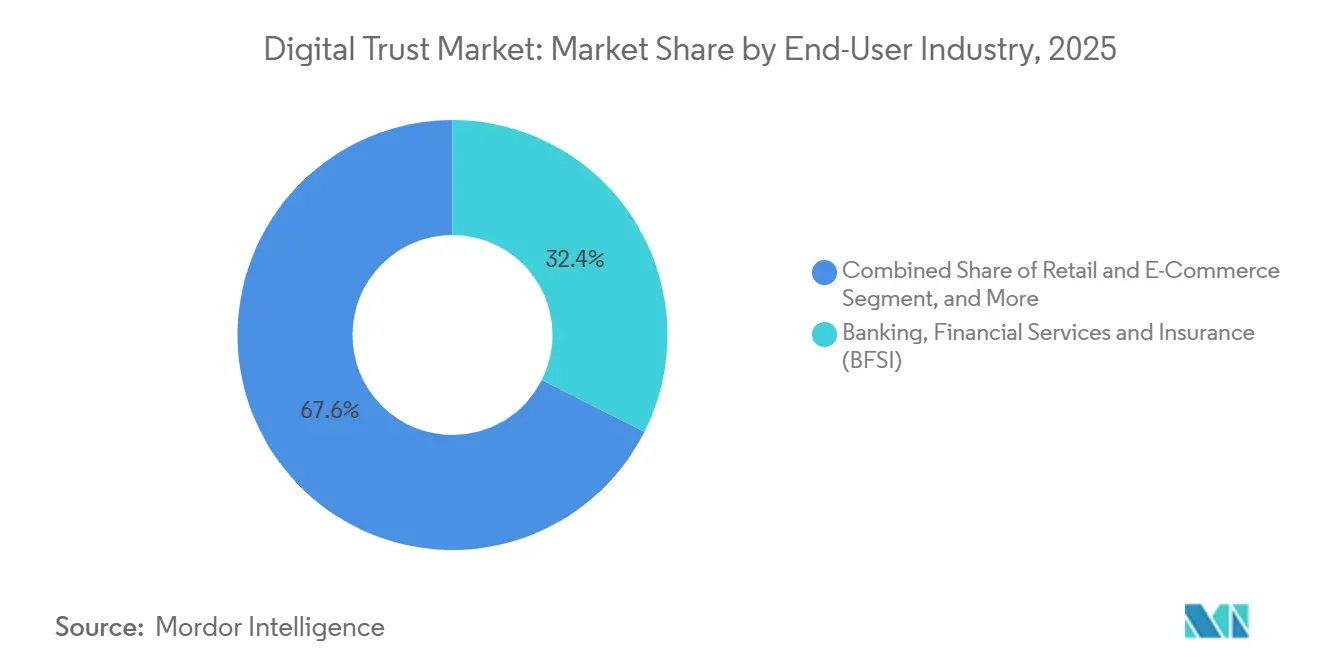
- By end-user industry, BFSI led with 32.43% of 2025 demand, and retail and e-commerce is the fastest-growing vertical at a 15.04% CAGR.
- By geography, North America captured 38.01% of 2025 revenue, while Asia-Pacific is the quickest-growing region at a 15.11% CAGR.
Note: Market size and forecast figures in this report are generated using Mordor Intelligence’s proprietary estimation framework, updated with the latest available data and insights as of 2026.
Global Digital Trust Market Trends and Insights
Drivers Impact Analysis*
| Driver | (~) % Impact on CAGR Forecast | Geographic Relevance | Impact Timeline |
|---|---|---|---|
| Rising Frequency and Cost of Data Breaches | +3.20% | Global, with acute pressure in North America and Europe | Short term (≤ 2 years) |
| Expanding Global Privacy and e-ID Regulations | +2.80% | Europe (eIDAS 2.0), Asia-Pacific (India DPDP Act, Singapore TDPA), selective US state laws | Medium term (2-4 years) |
| Rapid Cloud Adoption Triggering Zero-Trust Roll-Outs | +2.50% | North America and Europe leading, Asia-Pacific accelerating | Medium term (2-4 years) |
| AI/ML-Powered Fraud Detection Becoming Table-Stakes | +2.10% | Global, with early adoption in BFSI and retail sectors | Short term (≤ 2 years) |
| Emergence of Reusable, Portable Digital Identities | +1.60% | Europe (EU Digital Identity Wallet), Asia-Pacific (Singapore, India), pilot programs in North America | Long term (≥ 4 years) |
| Machine-to-Machine Trust Needs in Smart Factories | +1.40% | Asia-Pacific manufacturing hubs, Germany Industry 4.0 zones, select North American OT environments | Long term (≥ 4 years) |
| Source: Mordor Intelligence | |||
Rising Frequency and Cost of Data Breaches
Average breach costs hit USD 4.88 million in 2024 and escalated to USD 9.36 million for United States firms, pushing security investments from discretionary to essential.[1]Charles Henderson, “Cost of a Data Breach Report 2024,” IBM Security, ibm.com Stock prices of breached companies fell 7.5% within 90 days, while customer churn rose 3.2 percentage points, amplifying the commercial stakes. Shadow AI deployments lack robust controls at 97% of organizations, adding an estimated USD 670,000 when exploited as the first attack vector. Identity-based incursions now dominate, with 80% of 2024 breaches tied to compromised credentials rather than software flaws. Stricter disclosure mandates, such as the United States Securities and Exchange Commission rule requiring incident reports within four business days, compress containment windows and heighten demand for fully automated response platforms.
Expanding Global Privacy and e-ID Regulations
The European Union’s eIDAS 2.0 obliges member states to distribute interoperable digital wallets by 2026, compelling vendors to align with newly published credential schemas.[2]European Commission, “Digital Identity Framework,” europa.eu India’s Digital Personal Data Protection Act enforces granular consent logs and accelerates uptake of consent-orchestration engines.[3]Ministry of Electronics and IT, “Digital Personal Data Protection Act 2023,” meity.gov.in China’s Personal Information Protection Law restricts cross-border transfers, driving hybrid architectures that tokenize sensitive attributes locally. Singapore’s Trusted Data Sharing Framework codifies OAuth 2.0 and OpenID Connect as mandatory, institutionalizing industry best practice. Such divergence raises integration costs for multinationals, yet it also enlarges the addressable market for compliance engines that adapt policies dynamically.
Rapid Cloud Adoption Triggering Zero-Trust Rollouts
Organizations with mature zero-trust recorded 42% lower breach costs, a saving of USD 1.76 million per incident. NIST SP 800-207A, released June 2024, offers a reference model for cloud-native access control, and SP 1800-35 documents 19 implementation patterns.[4]National Institute of Standards and Technology, “Post-Quantum Cryptography Standards 2024,” nist.gov Identity sprawl is intensifying, with enterprises juggling 11.7 identity providers on average, prompting consolidation around centralized fabrics. Remote work fuelled adoption, as 61% of firms had at least one zero-trust project live by end-2024, up from 24% in 2020. The United States Department of Defense CMMC 2.0 effectively mandates continuous monitoring and least-privilege access for Level 3 contractors, embedding zero-trust into procurement baselines.
**AI and ML-Powered Fraud Detection Becoming Table-Stakes
Machine-learning engines surpassed 95% accuracy for synthetic-identity fraud in 2024 and cut false positives by 25%. Consumer losses reached USD 10 billion in 2023, a 14% year-over-year jump, intensifying regulatory pressure for real-time monitoring. Deepfake voice scams triggered USD 3 billion in transfers in 2024, accelerating enterprise demand for voice biometrics and out-of-band checks. PCI DSS v4.0 now requires dynamic fraud scoring for merchants handling more than 6 million transactions annually, institutionalizing AI risk engines. The European Union’s AI Act tags identity-verification systems as high-risk, obliging explainable models and traceable decision logs.
Restraints Impact Analysis*
| Restraint | (~) % Impact on CAGR Forecast | Geographic Relevance | Impact Timeline |
|---|---|---|---|
| Up-Front Integration and Licensing Costs | -1.80% | Global, with acute pressure on SMEs in emerging markets | Short term (≤ 2 years) |
| Fragmented Regulatory and Standards Landscape | -1.50% | Global, with divergence between EU, US, and Asia-Pacific frameworks | Medium term (2-4 years) |
| Consumer Consent Fatigue Eroding Engagement | -0.90% | Europe and North America, spreading to Asia-Pacific | Medium term (2-4 years) |
| Limited High-Quality Labelled Data for Trust-and-Safety AI | -0.70% | Global, with acute challenges in emerging fraud vectors | Long term (≥ 4 years) |
| Source: Mordor Intelligence | |||
Up-Front Integration and Licensing Costs
Comprehensive identity-governance projects demand capital outlays between USD 500,000 and USD 5 million, while annual licenses add 18%-22% of that figure, pushing five-year ownership above USD 10 million for enterprises with more than 10,000 employees. SMEs indicate budget shortfalls as the chief barrier, with 68% lacking internal expertise to compare offerings and 54% fearing vendor lock-in. Professional-services fees swallow up to 60% of project budgets as integrators retrofit legacy mainframes and custom applications. SaaS pricing from USD 3 to USD 12 per user per month eases entry, and cyber-insurance discounts of up to 15% for multi-factor authentication shorten payback to under two years. Even so, many mid-market buyers postpone advanced controls until external auditors or insurance carriers mandate them.
Fragmented Regulatory and Standards Landscape
Multinationals juggle 137 privacy statutes across 194 nations, with non-compliance fines reaching 4% of global turnover. eIDAS 2.0 cryptographic rules differ from W3C Verifiable Credentials, forcing parallel builds that inflate R&D outlays by roughly 30%. United States firms face a patchwork of state laws California, Virginia, Colorado each defining consent, breach notice, and opt-out differently. Legal uncertainty over EU-US data transfers, now hinging on the EU-US Data Privacy Framework, risks reverting companies to standard contractual clauses that require months of risk mapping. Voluntary industry groups such as the FIDO Alliance promote convergence, yet commercial rivalries slow adoption.
*Our forecasts treat driver/restraint impacts as directional, not additive. The impact forecasts reflect baseline growth, mix effects, and variable interactions.
Segment Analysis
By Component: Services Gain as Complexity Compounds
Services are accelerating as enterprises realize that buying software is only the first mile. In 2025 the digital trust market share of solutions stood at 57.82%, but services are forecast to outpace them at a 14.99% CAGR, reflecting rising demand for deployment, integration, and 24-hour monitoring. Managed detection and response contracts now average USD 150,000–USD 2 million per year, bundling threat intelligence, incident response, and compliance dashboards. Professional-services engagements typically run 6–12 months and swallow up to 60% of project spend as consultants model roles and retrofit legacy code. Advisory service demand is spiking where boards seek maps of trust boundaries for zero-trust rollouts. Vendors are monetizing education, charging USD 2,000–USD 5,000 per attendee for certification courses, deepening customer stickiness. As regulation multiplies, buyers look for partners who can tune policies on demand rather than incremental license features.
The digital trust market size for managed services is projected to command a growing slice of total value through 2031, because continuous governance, risk, and compliance checks cannot be fully automated without domain expertise. Vendors that embed ML-based detection rules and feed anonymized telemetry back into shared models improve accuracy for all customers, reinforcing a network-effects moat. Enterprises benchmark time-to-containment and audit-readiness rather than feature counts, steering budgets toward outcome-based service level agreements. Consequently, margin profiles for service providers rival software pure plays once scale efficiencies kick in.


By Deployment Mode: Cloud Ascendancy with Hybrid Bridges
Cloud-based platforms held 71.37% of 2025 digital trust market share and will expand at a 14.76% CAGR as buyers chase elasticity and evergreen updates. Identity-as-a-service offerings from Microsoft, Okta, and Ping supply per-user billing that eliminates capital expense and delivers continuous feature rollouts. On-premises footprints shrink each budget cycle, yet they persist in defense, critical-infrastructure, and healthcare domains constrained by sovereignty mandates. Hybrid blueprints therefore dominate enterprises federate authentication across Active Directory, SaaS portals, and multi-cloud workloads using OAuth 2.0, SAML 2.0, and OpenID Connect.
The digital trust market size allocated to hybrid configurations rises as firms migrate stepwise to avoid “lift-and-break” disruptions. NIST SP 800-207A prescribes policy-enforcement points both inside data centers and within public-cloud tenants, ensuring uniform access decisions. Centralized policy engines lower attack surfaces by removing password synchronization and enabling single sign-on. As hyperscale’s bundle native identity tools into infrastructure subscriptions, standalone vendors compete on depth risk-based adaptive factors, ML-driven anomaly scoring, and decentralized-wallet issuance.
By Organization Size: SMEs Narrow the Gap
Large enterprises consumed 62.45% of 2025 spending due to sprawling user estates and rigorous audit regimes. Yet SMEs are closing the gap, logging a 14.86% CAGR as SaaS price points start at USD 3 per user per month and require no in-house security staff. Insurers amplify uptake, refusing to renew policies unless multi-factor authentication, endpoint detection, and privileged-access controls are in place, effectively creating a quasi-regulatory mandate. Turnkey bundles from managed service providers wrap identity, SIEM, and response playbooks into flat monthly charges.
The digital trust market size earmarked for SMEs scales as remote work normalizes, erasing physical-perimeter advantages long held by large firms. Usability now determines vendor selection: intuitive dashboards and pre-built connectors outweigh exotic cryptography. Community editions and freemium tiers introduce small customers, who later upgrade once audit or insurance triggers arise. Over the forecast period, growth in new-logo count rather than seat expansion will drive revenue acceleration in the lower mid-market.
By End-User Industry: Retail and E-Commerce Surge Amid Rising Fraud
BFSI retained the greatest 2025 digital trust market share at 32.43%, compelled by strong customer authentication rules under PSD 2 and similar mandates. However, retail and e-commerce will post the fastest 15.04% CAGR as account-takeover fraud ballooned to USD 13 billion in 2024. Merchants scramble to deploy behavioural biometrics and device fingerprinting that discern bots from genuine buyers at checkout. Healthcare organizations integrate patient-matching tools to cut record-linking error rates, addressing life-critical safety risks.
The digital trust market size captured by retail rises each quarter as omnichannel platforms expand into cross-border trade and buy-now-pay-later models. PSD-2-style regulations are spreading outside Europe, broadening the compliance net. Fraud-related chargebacks erode slim ecommerce margins, so ML-based risk scoring that approves more legitimate orders without extra friction becomes a revenue enabler rather than a cost center. BFSI, while still the anchor tenant, is investing aggressively in post-quantum cryptography and biometric liveness to future-proof digital onboarding.

Geography Analysis
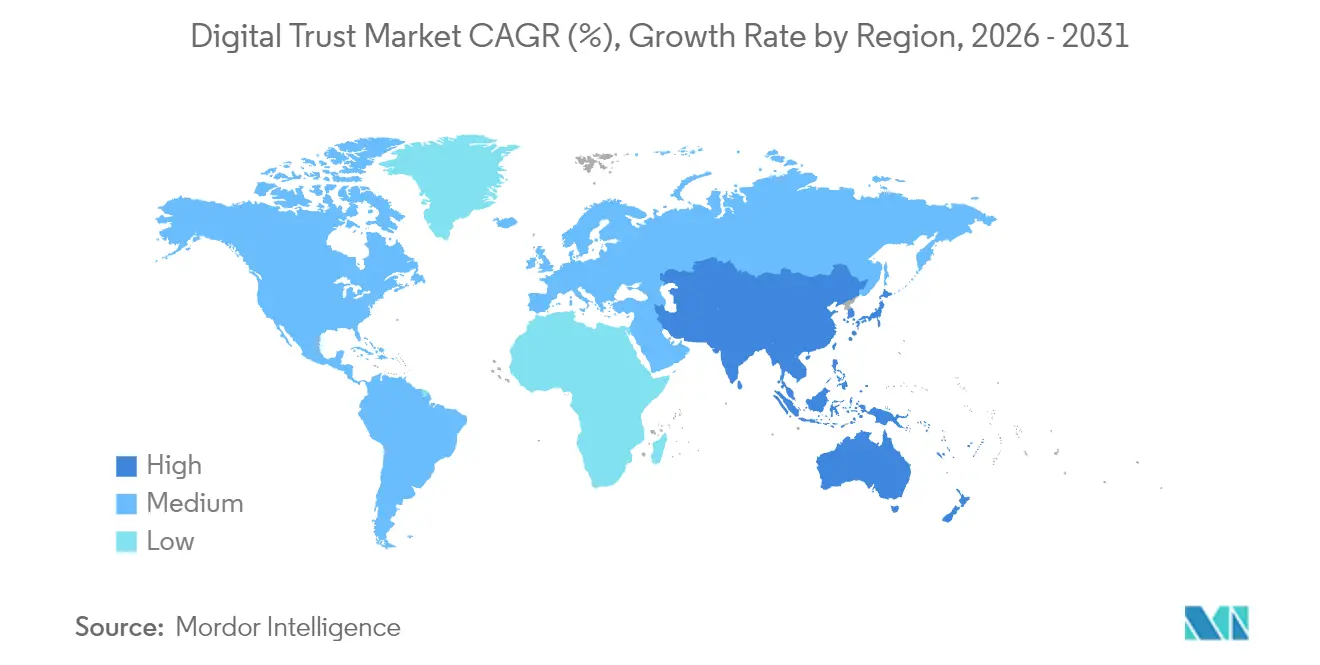
North America generated the largest regional revenue, accounting for 38.01% of 2025 digital trust market share and expanding at a 13.9% CAGR. The new United States Securities and Exchange Commission breach-disclosure rule forces public firms to operationalize incident response workflows that automatically capture identity logs, compressing adoption cycles. Canada’s updated provincial privacy statutes mirror EU obligations and require granular consent records, pushing multinational companies toward unified, multi-jurisdictional policy engines. Federal and state agencies also fund zero-trust pilots, which spill over into adjacent commercial markets.
Asia-Pacific is the fastest-growing territory at a 15.11% CAGR as population-scale digital-ID schemes roll out. India’s law compels in-country data stores and explicit permission prompts, stimulating local datacenter builds and tokenization engines that avoid replicating sensitive attributes across borders. China’s transfer restrictions necessitate hybrid identity fabrics that keep personal data onshore while still authenticating global employees. Japan tightened its cross-border transfer rules, boosting demand for consent orchestration and audit automation tools. Singapore embedded OAuth 2.0 and OpenID Connect in its national framework, anchoring vendor architectures in open standards. Emerging ASEAN economies are drafting GDPR-inspired acts, expanding the addressable market for regional compliance hubs.
Europe held 24.3% of 2025 revenue and is on a 14.2% CAGR trajectory amid eIDAS 2.0 mandates that every citizen hold an interoperable wallet by 2026. Germany’s federal security agency published zero-trust guidelines that now influence procurement across critical infrastructure. The United Kingdom retained GDPR-equivalent requirements, sustaining high compliance spend. France’s data-protection authority levied EUR 214 million (USD 228 million) in cookie-consent fines during 2023, proving enforcement teeth. South America remains nascent at 4.8% share but climbs 14.6% as Brazil’s LGPD matures. The Middle East and Africa log 15.3% growth, led by Gulf blockchain programs and South Africa’s POPIA, both of which prioritize verifiable credentials and continuous authentication.

Regulatory Landscape
Digital trust requirements are tightening around identity, cybersecurity disclosure, and interoperable trust services, with enforcement and standard-setting coming from regulators and industry bodies. In the United States, the SEC breach-disclosure rule compresses public-company reporting timelines to four business days, pushing firms toward auditable identity logs and automated incident workflows. In Europe, eIDAS 2.0 is being operationalized through implementing acts, including Commission Implementing Regulation (EU) 2026/798 (7 April 2026) that specifies reference standards for remote onboarding to European Digital Identity Wallets at assurance level substantial, while Regulations (EU) 2025/2530 and 2025/2531 (16 December 2025) set reference standards for qualified trust service providers and qualified electronic ledgers.
The United Kingdom is also adding sector-specific oversight and identity assurance governance. The Critical Third Parties (Designation) Regulations 2026 came into force on 13 July 2026, bringing major cloud providers (including Microsoft, Google, AWS, and Oracle) under UK financial regulators oversight, raising the bar for resilience, security controls, and third-party risk evidence in regulated financial services supply chains. Alongside this, the UK Digital Verification Services Trust Framework 1.0, maintained by the Office for Digital Identities and Attributes (OfDIA), sets an accreditation pathway for conformity assessment bodies (with accreditation beginning no earlier than 1 September 2026 under the Data (Use and Access) Act 2025), reinforcing a compliance-driven market for identity proofing, authentication, and audit-ready assurance artifacts aligned to frameworks such as ETSI trust service standards.
Competitive Landscape
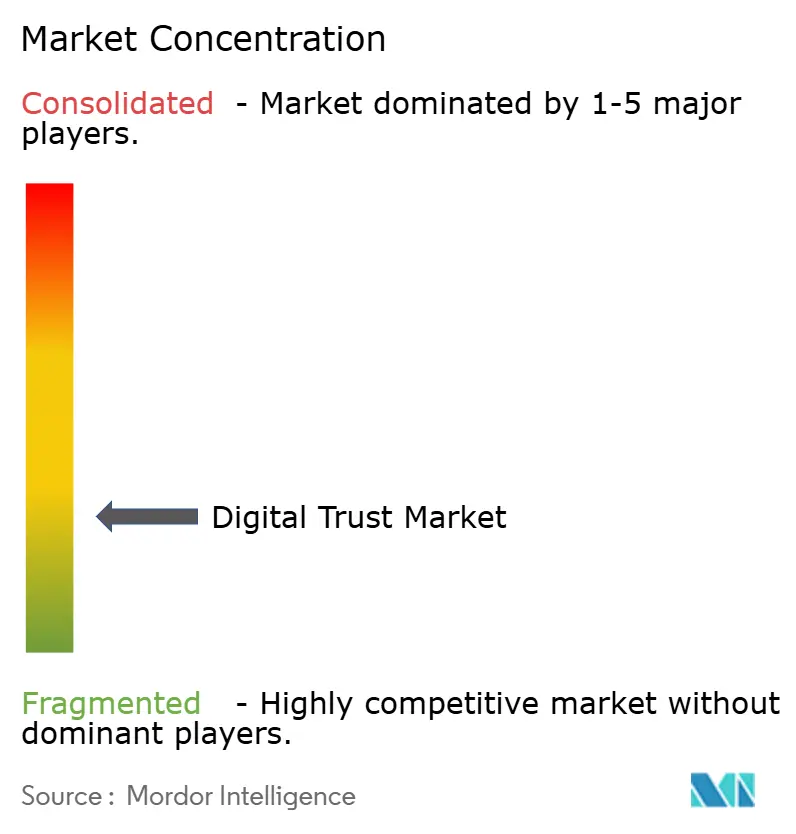
The digital trust market is moderately fragmented, with the top 10 vendors controlling about 45% of global revenue, leaving ample space for niche specialists. Cloud hyperscale’s Microsoft, Amazon Web Services, and Oracle bundle identity-as-a-service into infrastructure subscriptions, driving down standalone license prices but lifting the overall opportunity for integration partners. Identity pure-plays such as Okta, Ping Identity, and CyberArk differentiate through depth, for example CyberArk’s EAL4+-certified privileged-access platform, which satisfies defense tenders, and Okta’s catalogue of more than 7,000 pre-built connectors. Identity-verification firms Jumio, Onfido, and Mitek attack remote onboarding in BFSI, sharing-economy, and healthcare use cases, with Jumio passing one-billion verifications by 2024.
Acquisition activity is brisk. In November 2025 Okta bought Spera Security for USD 265 million to add identity-threat detection. CyberArk announced a USD 1.54 billion takeover of Venafi in August 2025 to pair machine-identity management with privileged access. Entrust purchased Onfido in 2024, reflecting a strategic rush to control the full identity life cycle. Patent filings in post-quantum cryptography jumped 340% after NIST named preferred algorithms in August 2024, positioning vendors with early implementations for regulated-sector bids.
Regulatory certifications act as soft barriers. Vendors earning ISO 27001, SOC 2 Type II, and FedRAMP Moderate dislodge uncertified rivals during RFP scoring, and the cost of multi-framework upkeep nudges smaller suppliers toward merger. Meanwhile, open-wallet pilots under eIDAS 2.0 and India’s Aadhaar-linked consent layers are spawning new entrants focused on decentralized identifiers. Competitive intensity will likely increase until interoperability standards stabilize and economies of scale raise entry hurdles.
Digital Trust Industry Leaders
Microsoft
IBM
Cisco Systems
Amazon Web Services (AWS)
Oracle
- *Disclaimer: Major Players sorted in no particular order

Market Opportunities and Future Outlook
Regulatory implementation timelines and oversight expansion are creating whitespace for vendors and service providers that can package compliance evidence, identity assurance, and operational resilience into repeatable delivery models. eIDAS 2.0 implementing regulations, including EU 2026/798 for remote onboarding and EU 2025/2530 and 2025/2531 for qualified trust services and electronic ledgers, elevate demand for interoperable credential issuance, remote identity proofing, and conformance tooling that maps to reference standards. In the UK, bringing hyperscalers into financial-services oversight through the Critical Third Parties (Designation) Regulations 2026 is shifting buyer requirements toward continuous controls monitoring, third-party assurance reporting, and resilient identity and access management patterns that can withstand supervisory scrutiny.
Sovereign and regulated-cloud buildouts are also expanding digital trust use cases beyond classic IAM, including verifiable control, data residency enforcement, and cryptographic assurance. IBM made IBM Sovereign Core generally available in May 2026 to help operationalize digital sovereignty requirements in regulated environments, and Oracle announced its Defense Industrial Base Isolated Cloud Environment (DICE) in 2026 to support defense-focused isolation needs, reinforcing demand for hardware-backed key management, policy enforcement, and auditable access. With the market already skewed toward cloud delivery (cloud-based offerings held 71.37% of 2025 spending) and services monetization (services growing faster than solutions), integrators and managed-service providers have room to standardize cross-framework compliance packs that combine zero-trust architecture, identity telemetry retention, and automated reporting for multi-jurisdiction buyers.
Recent Industry Developments
- July 2026: Keyfactor announces a $1 billion plus strategic growth investment led by Summit Partners to expand leadership in securing the AI and post-quantum enterprise security. The move strengthens digital-trust infrastructure for AI and quantum-ready security, and expands scale and capabilities of the digital-trust platform, potentially shifting market leadership and investment in identity and security workflows.
- June 2026: Cisco Systems unveils Live Protect, a digital immune system for Cisco switches providing runtime protection against prioritized vulnerabilities. The launch enhances real-time security across critical IT infrastructure and fortifies Cisco's security fabric, accelerating adoption of integrated trust and protection across networks.
- April 2026: Microsoft announces open-sourcing of the Azure Integrated HSM firmware, driver, and software stack at the OCP EMEA Summit to enable cryptographic trust validation. The release advances cryptographic trust validation and post-quantum readiness, and promotes interoperability and faster uptake of trusted hardware backed identities across cloud ecosystems.


Research Methodology Framework and Report Scope
Market Definition and Coverage
For this study, the market covers spending that helps organizations create and keep confidence in digital interactions, including identity and access controls, security and privacy protections, and assurance tools that support safe transactions across apps, devices, and networks.
Scope exclusions: Hardware-only security appliances and general IT outsourcing are excluded unless they are directly sold as part of a digital trust solution or service contract.
Segmentation Overview
- By Component
- Solutions
- Services
- By Deployment Mode
- Cloud-Based
- On-Premises
- By Organization Size
- Large Enterprises
- Small and Medium-Sized Enterprises (SMEs)
- By End-User Industry
- Banking, Financial Services and Insurance (BFSI)
- Healthcare
- IT and Telecommunications
- Government and Public Sector
- Retail and E-Commerce
- Energy and Utilities
- Other Industries
- By Geography
- North America
- United States
- Canada
- Mexico
- South America
- Brazil
- Argentina
- Rest of South America
- Europe
- Germany
- United Kingdom
- France
- Italy
- Spain
- Rest of Europe
- Asia-Pacific
- China
- Japan
- India
- South Korea
- Southeast Asia
- Rest of Asia-Pacific
- Middle East and Africa
- Middle East
- Africa
- North America
Data Sources, Market Sizing, and Validation
Desk Research
Desk research helped set the outer boundaries of demand and keep assumptions realistic across regions and industries. We mainly used public data that signals where trust and security budgets are moving, and then mapped that information to solution and service categories.
Sources included public and official references such as NIST guidance, ISO publications, FCC and FTC releases, ENISA reports, and OECD digital security and privacy work, along with company filings, investor presentations, association websites, and reputable press coverage. In cases where company splits were not fully disclosed, we used paid subscriptions for company financials and intelligence, plus patent databases and a shipment-level import and export database to sanity check certain security product flows. This list is not exhaustive, and many other sources were used for data collection, validation, and research clarification.
Primary Interviews and Surveys
Primary work was used to validate what we learned from public sources, especially on what buyers include inside a digital trust program and how pricing is shifting between software subscriptions and services. We spoke with a mix of solution providers, service partners, and enterprise users across major regions, so that adoption patterns, renewal behavior, and spending intensity could be checked before finalizing the model.
Distribution of primary research fieldwork respondents
| Company type | Respondent position | Region |
|---|---|---|
| Top tier: 25% | CXOs: 15% | APAC: 47% |
| Mid tier: 60% | Functional/Unit leaders: 34% | EMEA: 31% |
| Smaller Players: 15% | Managers: 51% | Americas: 22% |
Market-Sizing & Forecasting
Sizing starts with a top-down build where technology spending is reconstructed into a digital trust demand pool by applying adoption and intensity factors across regulated and high-risk digital workflows (for example, identity proofing, authentication, fraud prevention, and compliance reporting). After the demand structure is built, we corroborate it with selective bottom-up checks, such as sampled supplier revenue splits, channel feedback on renewal rates, and ASP times volume checks for commonly priced subscription bundles.
Key inputs used in the model include enterprise security and privacy budget direction, cloud migration pace, identity and access management adoption, reported breach and credential misuse patterns, regulatory compliance pressure, and the mix shift between software and managed services. Because pricing can move quickly in this space, ASP progression was treated separately for platform subscriptions versus services, and then aligned back to the verified demand drivers.
For forecasting, scenario analysis was used and then anchored to expert expectations on macro and security spending, regulation timing, and cloud and zero trust adoption curves. Where bottom-up signals were missing for smaller markets, we applied proxy ratios from similar economies and industry mixes, then adjusted those assumptions through interview feedback before totals were finalized.
Data Validation & Update Cycle
Outputs were checked using triangulation across multiple angles, including spend intensity by industry, implied vendor revenue capture, and regional adoption signals, which helps catch over-counting and timing mismatches. Variances outside expected ranges trigger a deeper review of assumptions like service attach rates, subscription pricing, and the split between cloud and on-premises deployments.
Before sign-off, the model goes through multi-step analyst reviews, and follow-up calls are triggered when a data point changes the story, such as a new regulation window, a major breach trend shift, or an unusual pricing move. Reports are refreshed annually, and interim updates are done when material events impact demand or pricing, followed by a final pre-delivery pass so clients receive the latest updated view.
Mordor Intelligence's Digital Trust Market Size Versus Other Published Estimates
Published digital trust market values can differ because category lines are not always drawn the same way, and services, software subscriptions, and adjacent cybersecurity items can be bundled differently across studies. Differences also show up when exchange rates are captured at different points in time, and when pricing is projected using broad IT inflation instead of security specific renewal behavior.
A refresh-led gap is common here, because subscription ASPs and service attach rates can move within a year, particularly as buyers shift from point tools to platform contracts and managed offerings, and that changes the run-rate used for the current year. By locking exchange rates to a consistent timing window and re-checking ASP logic during the annual update cycle, Mordor Intelligence keeps the estimate tied to what buyers are actually paying for within the defined digital trust scope.
Benchmark comparison
| Source | Market Size | Gaps in Research Methodology |
|---|---|---|
| Mordor Intelligence | USD 471.96 B (2025) | |
| Trade Journal A | USD 410.06 B (2024) | Uses an earlier base year and a faster growth curve, and the scope appears broader in places where general cybersecurity and trust tooling are blended without clear separation of subscriptions versus services. |
| Global Consultancy B | USD 118.40 B (2024) | Starts from a narrower spend base that likely counts fewer solution categories, and the total can look lower when service revenue and cross-industry compliance programs are only partially captured. |
The spread across published numbers mainly comes from how wide the category is drawn and how current-year pricing is treated, not from small math differences. When scope boundaries are kept explicit and pricing is re-validated through repeatable checks, the resulting market size becomes easier to trace, replicate, and use for planning decisions.


Key Questions Answered in the Report
How fast is the digital trust market expected to grow between 2026 and 2031?
The market is forecast to expand at a 14.28% CAGR, climbing from USD 550.58 billion in 2026 to USD 1,073.18 billion by 2031.
Which component is seeing the fastest revenue growth?
Services, especially managed detection and response, are rising at a 14.99% CAGR as buyers seek continuous operations support.
Why is Asia-Pacific considered the fastest-growing region?
Government-backed digital-ID schemes and data-localization rules are driving a 15.11% CAGR, outpacing other regions.
What drives retailer demand for digital trust solutions?
Account-takeover fraud exceeding USD 13 billion in losses during 2024 is pushing merchants to deploy behavioral biometrics and device fingerprinting.
How do regulatory changes influence technology adoption?
Frameworks such as eIDAS 2.0, Indias DPDP Act, and new United States breach-disclosure rules mandate stronger identity governance, accelerating platform upgrades.
Which vendors are shaping the competitive landscape?
Microsoft, Amazon Web Services, Okta, Ping Identity, and CyberArk lead the field, while acquisitions like CyberArk-Venafi show consolidation trends.
Page last updated on:






