
Digital Process Automation Market Size and Share
Market Overview
| Study Period | 2020 - 2031 |
|---|---|
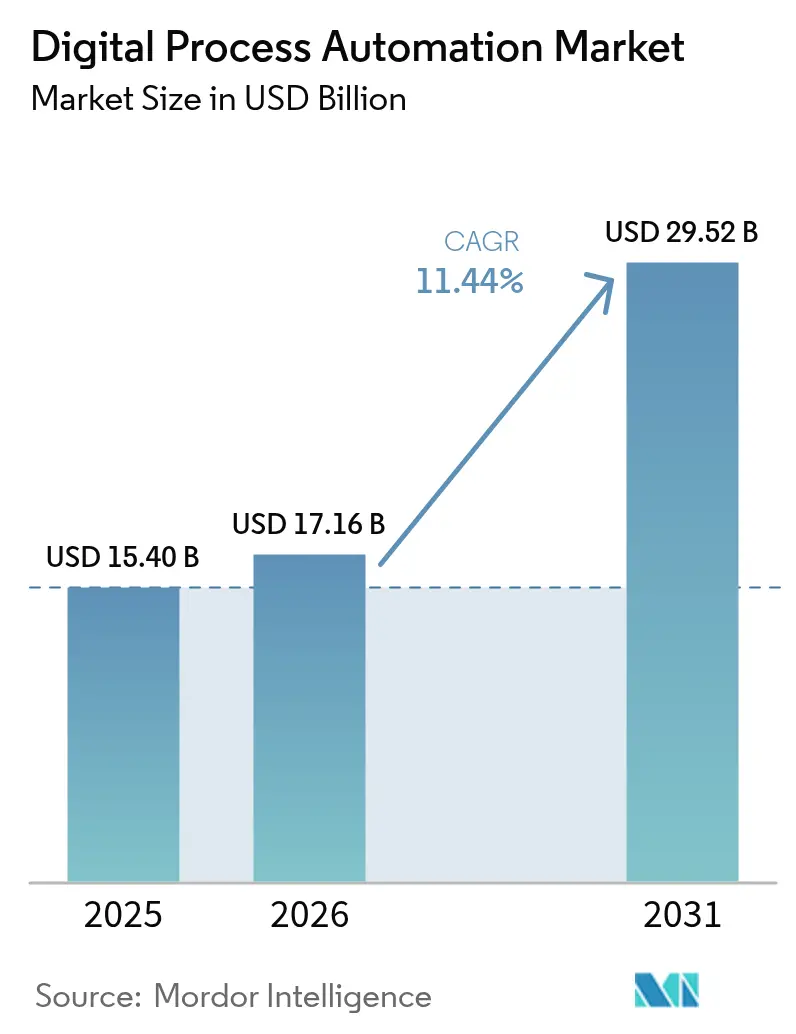
| Market Size (2026) | USD 17.16 Billion |
| Market Size (2031) | USD 29.52 Billion |
| Growth Rate (2026 - 2031) | 11.44 % |
| Fastest Growing Market | Asia Pacific |
| Largest Market | North America |
| Market Concentration | Medium |
Major Players *Disclaimer: Major Players sorted in no particular order Image © Mordor Intelligence. Reuse requires attribution under CC BY 4.0. | |
Digital Process Automation Market Analysis by Mordor Intelligence
The digital process automation market size was valued at USD 15.4 billion in 2025 and estimated to grow from USD 17.16 billion in 2026 to reach USD 29.52 billion by 2031, at a CAGR of 11.44% during the forecast period (2026-2031). The current expansion reflects a decisive shift in enterprise strategy from task-centric robotic process automation toward data-driven, AI-augmented hyper-automation. Vendor roadmaps focus on integrating generative models, process mining diagnostics, and event-driven orchestration within unified low-code platforms, enabling business teams to have direct control over workflow design without requiring extensive coding efforts. Demand also benefits from the growing requirement for audit-ready governance in regulated sectors, the rise of sustainability reporting mandates, and heightened competition that pushes firms to cut cycle times while lifting customer experience scores. Competitive dynamics are reshaped as cloud hyperscalers inject native AI capabilities into their automation suites, exerting pricing pressure on traditional incumbents and accelerating platform consolidation. [1]
Key Report Takeaways
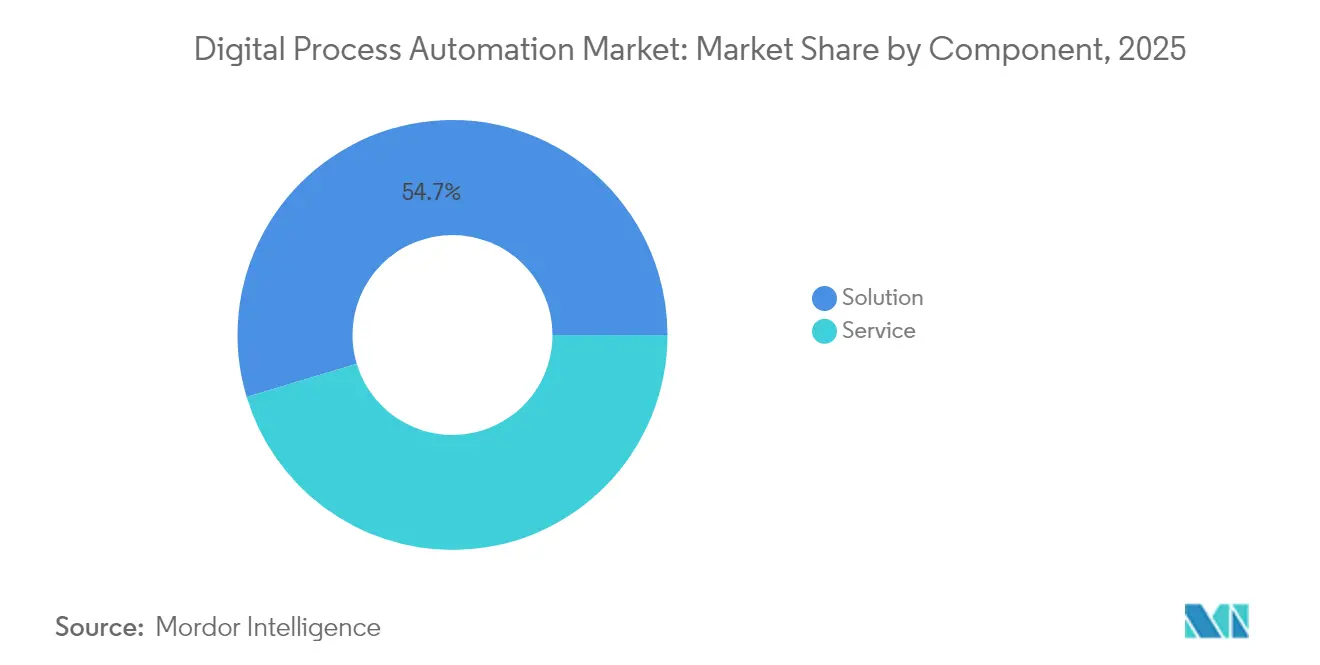
- By component, the solution segment held 54.65% of the digital process automation market share in 2025, and services are projected to expand at a 12.86% CAGR from 2026-2031.
- By deployment, on-demand platforms captured 58.12% share of the digital process automation market size in 2025 and are anticipated to record a 12.52% CAGR through 2031.
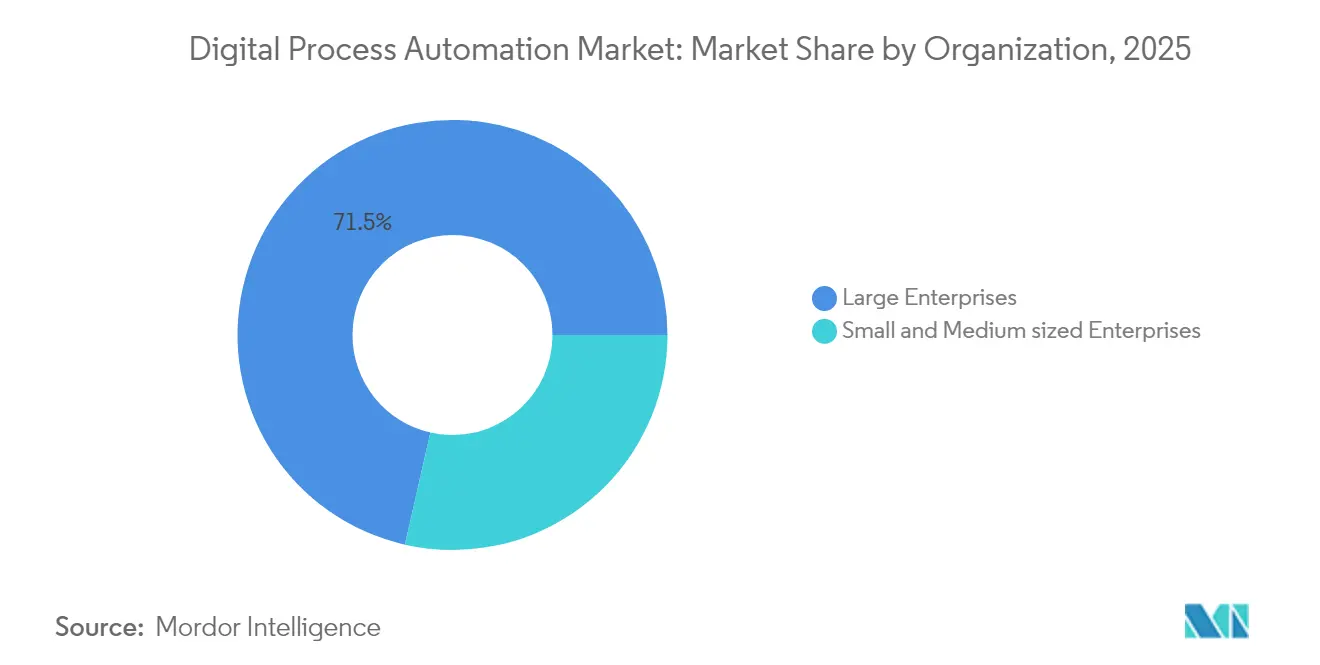
- By organization size, large enterprises commanded 71.45% revenue share in 2025, while SMEs are growing at a 12.31% CAGR.
- By end user, BFSI led the digital process automation market with 27.65% of the market size in 2025; healthcare is expected to advance at a 13.41% CAGR through 2031.
- By Geography, North America led the digital process automation market with 35.78% of the market size in 2025; the Asia-Pacific region is expected to advance at a 13.22% CAGR through 2031.
Note: Market size and forecast figures in this report are generated using Mordor Intelligence’s proprietary estimation framework, updated with the latest available data and insights as of 2026.
Market Trends and Insights
Drivers Impact Analysis of Digital Process Automation Market*
| DRIVER | (~) % IMPACT ON CAGR FORECAST | GEOGRAPHIC RELEVANCE | IMPACT TIMELINE |
|---|---|---|---|
| Rising demand for automated back-office efficiency | +2.8% | Global, concentrated in North America and Europe | Medium term (2-4 years) |
| Low-code/no-code adoption enabling citizen developers | +2.1% | Global, fastest in Asia-Pacific and emerging markets | Short term (≤ 2 years) |
| Integration of DPA with AI and RPA for hyper-automation | +3.2% | North America and Europe leading, Asia-Pacific following | Long term (≥ 4 years) |
| Regulatory-driven need for auditable digital workflows | +1.9% | Global, strongest in regulated industries | Medium term (2-4 years) |
| Event-driven API-first micro-journey automation | +1.4% | Technology-advanced urban regions | Long term (≥ 4 years) |
| ESG-reporting sustainability workflow digitization | +1.1% | Europe leading, North America and Asia-Pacific adoption rising | Long term (≥ 4 years) |
| Source: Mordor Intelligence | |||
Rising Demand for Automated Back-Office Efficiency
Enterprises now treat back-office transformation as a growth lever, not merely a cost-takeout exercise. Intelligent document processing, paired with decision automation, has reduced manual effort in loan origination by 40-60% at leading banks.[2] Manufacturers synchronize supply-chain updates with production schedules, reducing inventory days and improving order fulfillment accuracy. Continuous process-mining diagnostics embedded within automation suites surface bottlenecks in real-time, rather than waiting for quarterly reviews. As a result, companies measure success against customer satisfaction and compliance accuracy rather than task counts, signalling market maturity. Vendors able to translate these outcome-oriented metrics into commercial value propositions gain competitive traction.
Low-Code/No-Code Adoption Enabling Citizen Developers
A surge in low-code usage has shifted automation workload from centralized IT to business units. Microsoft reported a 500% increase in citizen-developer adoption of Power Platform during 2024. Project lead times for standard workflows now fall from months to weeks, accelerating the return on investment. Enterprises tackle governance challenges by standing up automation centers of excellence that issue templates, security guardrails, and audit policies without stifling creativity. Regulatory regimes are increasingly recognizing citizen-built flows as first-class business processes, provided that documentation and traceability controls are in place. The democratization trend expands the addressable market for digital process automation.
Integration of DPA with AI and RPA for Hyper-Automation
Hyper-automation combines process mining, robotic automation, and advanced analytics within a single environment. Natural-language workflow design, powered by large language models, allows users to describe outcomes instead of configuring rules, thereby lowering entry barriers.[3] Generative capabilities extend automation to content creation and sophisticated document review. Predictive engines suggest corrective steps before bottlenecks become visible, driving straight-through rates up by 30-50% in complex processes, according to early adopter case studies. The arrival of agentic AI enables autonomous decision-making loops that further reduce the need for human supervision. Platform vendors racing to embed these functions gain pricing power and long-term stickiness.
Regulatory-Driven Need for Auditable Digital Workflows
Real-time monitoring baked into automated flows delivers continuous compliance, slashing reliance on post-hoc audits. Basel III reporting now operates on fully traceable processes within major banks, easing regulatory examinations.[4] HIPAA workflows in healthcare utilize automatic access controls and encryption policies, thereby reducing the risk of breaches. Dynamic rule-update engines synchronize with external regulatory feeds, allowing rule changes to trigger instantaneous process revisions without manual recoding. Vendors offering turnkey audit trails and evidence repositories meet rising demand from compliance-heavy verticals and secure premium pricing/
Restraints Impact Analysis of Digital Process Automation Market*
| RESTRAINT | (~) % IMPACT ON CAGR FORECAST | GEOGRAPHIC RELEVANCE | IMPACT TIMELINE |
|---|---|---|---|
| Shortage of skilled process-automation talent | -1.8% | Global, most acute in emerging markets | Medium term (2-4 years) |
| Data security and privacy risks | -1.2% | Global, heightened in regulated industries | Short term (≤ 2 years) |
| Legacy-system fragmentation | -1.5% | Developed markets rich in aging IT | Long term (≥ 4 years) |
| Algorithmic-bias scrutiny | -0.9% | North America and Europe regulatory focus | Medium term (2-4 years) |
| Source: Mordor Intelligence | |||
Shortage of Skilled Process-Automation Talent
The demand for professionals who blend process analysis, technical expertise, and change management exceeds the supply. Firms respond by funding internal academies and partnering with universities; yet, the ramp-up time for expert roles remains long. Many companies pool scarce talent inside automation centers of excellence, centralizing design and governance skills. Meanwhile, service providers launch automation-as-a-service offers, allowing businesses to tap external experts on subscription terms and keep projects on track despite internal gaps. Over time, low-code tools mitigate part of the shortage, but complex deployments still need specialist oversight.
Data-Security and Privacy Risks in Critical Workflows
Automated flows touch multiple systems, enlarging the cyber-risk surface. Machine-learning pipelines may unintentionally expose sensitive training data, prompting the implementation of stricter controls to prevent this. Regulations such as the GDPR impose explicit consent and data minimization mandates that complicate design choices.[5]Enterprises adopt zero-trust architectures and policy-based encryption to protect data moving across cloud and on-premise boundaries. Although these safeguards raise implementation cost, they are essential for sustaining trust in automation outcomes.
*Our forecasts treat driver/restraint impacts as directional, not additive. The impact forecasts reflect baseline growth, mix effects, and variable interactions.
Digital Process Automation Market Segment Analysis
By Component:
Services Accelerate Despite Solution DominanceThe solution segment retained 54.65% digital process automation market share in 2025, underscoring buyer preference for full-stack platforms that consolidate orchestration, analytics, and AI on one license. Services, however, are scaling faster at a 12.86% CAGR as organizations realize that software alone cannot re-engineer entrenched processes. Advisory teams blend process-mining insights with redesign workshops to eliminate waste before any bot is coded.
Service revenue is increasingly derived from AI model training, cross-platform integration, and managed optimization. Engagement scopes now cover continuous improvement cycles, allowing providers to capture value throughout the automation lifecycle. The digital process automation market size attributable to services is projected to approach USD 14.37 billion by 2031, signaling sustained demand for external expertise.

By Deployment:
On-Demand Platforms Drive Cloud-First AdoptionCloud-based on-demand deployments controlled 58.12% of the digital process automation market size in 2025 and are slated to grow at a 12.52% CAGR as elastic scaling and subscription economics resonate with budget owners. Automatic patching and AI updates delivered through the vendor’s pipeline relieve IT teams from maintenance duties, accelerating innovation.
Hybrid frameworks gain momentum where latency or sovereignty requirements persist. Edge-enabled automation nodes process sensitive data locally while syncing summary insights to the cloud. Portable container packs let flows shift between environments without refactoring, giving buyers confidence to migrate workloads at their own pace.
By Organization Size:
SMEs Embrace Accessible AutomationLarge enterprises accounted for 71.45% of revenue in 2025, leveraging their global footprints and deep integration budgets. Yet, SMEs represent the fastest-growing cohort, with a 12.31% CAGR, propelled by vendor moves to simplify pricing and deliver template libraries. Pre-built use cases covering invoice capture, inventory updates, and customer service allow SMEs to go live within weeks.
Cloud delivery eliminates capital expenditure, while intuitive design studios enable operations staff to tweak rules without coding. Vendors supplement their products with online training and marketplace add-ons that match regional compliance needs. These elements collectively lower barriers and broaden the digital process automation market, fostering inclusive growth.
By End User:
Healthcare Leads Growth Through Digital TransformationBFSI captured 27.65% of 2025 revenue as banks pursued straight-through processing for loans, fraud monitoring, and regulatory reporting. Healthcare, however, posts the highest 13.41% CAGR, driven by value-based care models demanding real-time outcome tracking. Electronic health record connectors feed data into automated care coordination flows, reducing the administrative load on clinicians.
Manufacturing maintains momentum by integrating industrial IoT feeds with workflow engines to automate quality checks and supply chain resets. IT-telecom firms rely on bots for self-healing network tasks, while retail players automate replenishment and personalized offers via CRM integration. Each vertical maps automation to its distinct pain points, diversifying revenue streams across the digital process automation market.
Geography Analysis
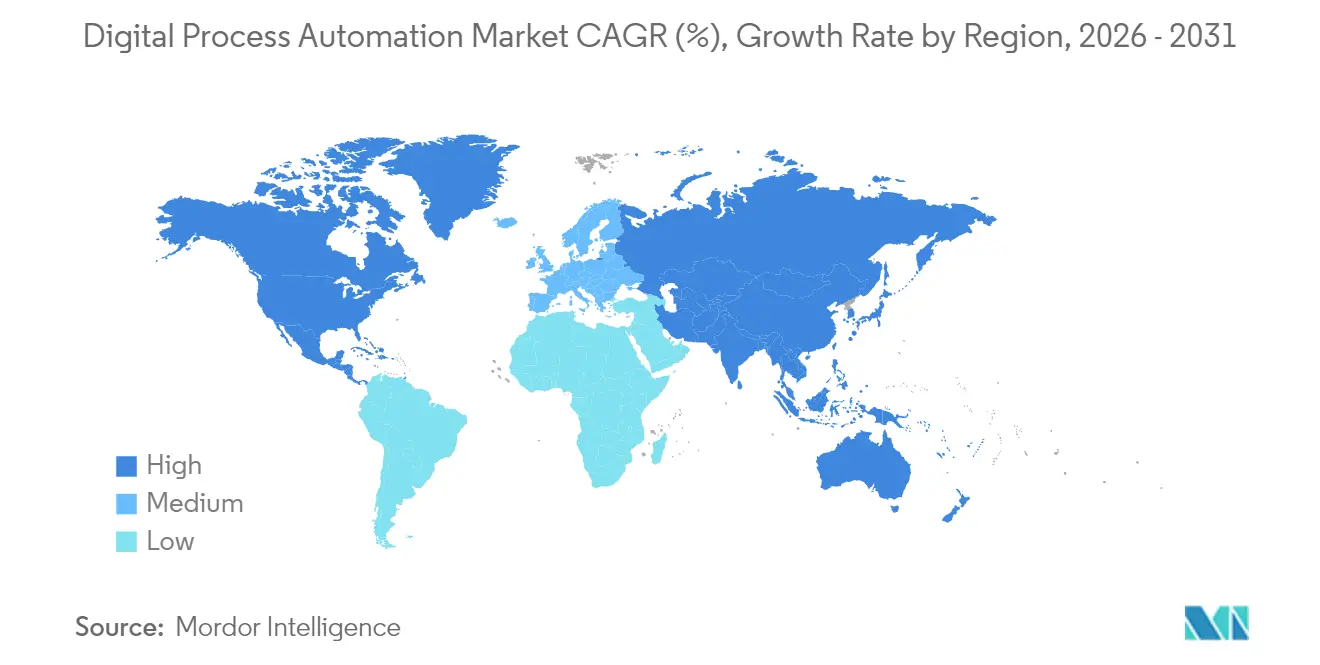
North America Digital Process Automation Market
North America commanded 35.78% of 2025 revenue thanks to mature cloud infrastructure, abundant venture capital, and early enterprise willingness to insert AI into core operations. U.S. organizations trail-blazed hyper-automation pilots that weave process mining, chatbot interfaces, and autonomous decision loops into cohesive programs. Canada complements its healthcare and public-sector initiatives with modernizations of service delivery.
APAC Digital Process Automation Market
Asia-Pacific is the fastest mover, set to advance at a 13.22% CAGR through 2031. China leads smart-factory investments, pairing process automation with industrial sensors for adaptive scheduling. India’s IT services giants deploy internal bots to enhance utilization and client responsiveness, bolstered by government Digital India policies that promote the adoption of automation. Across Southeast Asia, multinationals are establishing new manufacturing lines in jurisdictions that offer tax incentives for digital upgrades, drawing local suppliers along the same path.
EMEA Digital Process Automation Market
Europe balances innovation with stringent oversight. The proposed AI Act mandates transparency and bias mitigation, influencing the design of automation from the outset. Germany’s Mittelstand manufacturers integrate workflow engines with edge machines to shrink downtime, while U.K. banks target regulatory alignment through end-to-end automated evidence trails. Elsewhere, Gulf economies and South Africa are embracing automation to optimize energy and public services, although talent shortages are tempering near-term momentum.
Regulatory Landscape
Digital process automation deployments are increasingly shaped by AI and data-governance rules that require traceability, controls, and audit-ready evidence across automated decision points. In the European Union, the AI Act moves toward full application on 2 August 2026, pushing vendors and buyers to operationalize transparency and documentation practices for AI-enabled workflows while aligning data handling with GDPR requirements, particularly where automation suites embed generative and agentic capabilities.
In the United States, sector-specific cybersecurity requirements are tightening around connected equipment and operational resilience, which affects how workflow platforms handle patching, access controls, and third-party integrations in regulated environments. In June 2026, the FCC finalized amendments around security controls for Emergency Alert System equipment, reinforcing expectations for prompt security patching and governance controls that flow into procurement and compliance checks for automation solutions used across communications and public-sector operations.
Competitive Landscape
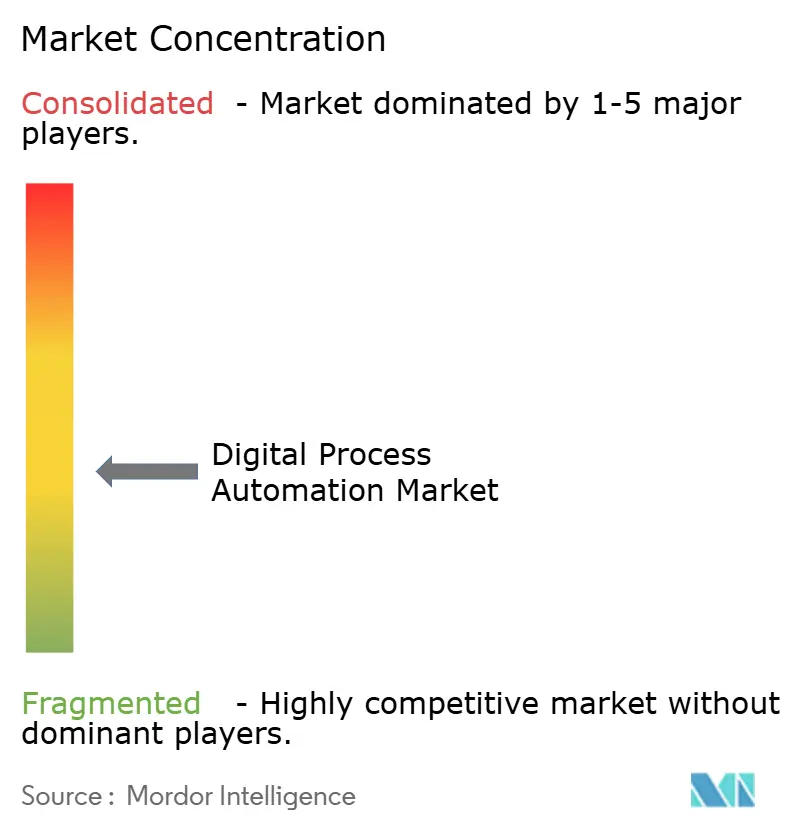
The digital process automation industry shows moderate concentration as top vendors integrate adjacent capabilities through acquisition. IBM absorbed process-mining assets to enrich its orchestration suite. Microsoft has embedded AI assistants and process analytics within the Power Platform to enhance stickiness. ServiceNow’s purchase of Process Street in 2025 sharpened mid-market positioning by adding intuitive documentation tools.
Competitive battlegrounds shift from feature checklists to the breadth of the ecosystem. Hyperscalers exploit cloud footprints to package infrastructure, AI, and automation under unified SLAs, forcing pure-play vendors to differentiate via domain-specific content and pre-validated connectors. Small innovators pursue whitespace opportunities, such as agentic AI controls that enable workflows to make context-aware decisions without relying on rule trees.
Price pressure intensifies as subscription models become more normalized; yet, switching costs rise because enterprises embed bots deeply within their system landscapes. Partners and marketplaces become pivotal, offering ready-made skills that cut configuration time. Vendors cultivating vibrant developer communities and robust governance toolkits are poised to capture a significant share of future digital process automation market growth.
Digital Process Automation Industry Leaders
-
Pegasystems Inc.
-
IBM Corporation
-
Appian Corporation
-
ServiceNow Inc.
-
Oracle Corporation
- *Disclaimer: Major Players sorted in no particular order
Digital Process Automation Market Companies Covered in this Report
- IBM Corporation
- Pegasystems Inc.
- Appian Corporation
- Bizagi Group Limited
- Oracle Corporation
- Software AG
- SS&C Technologies Holdings, Inc.
- OpenText Corporation
- Newgen Software Technologies Ltd.
- TIBCO Software Inc.
- Nintex Global Ltd.
- K2 Software Inc.
- Bonitasoft S.A.
- AgilePoint Inc.
- Kissflow Inc.
- ProcessMaker Inc.
- AuraQuantic S.L.
- BizFlow Corporation
- Joget Inc.
- Creatio EMEA Limited
- ServiceNow Inc.
- Genpact Limited
- Cognizant Technology Solutions Corp.
- Infosys Limited
- Wipro Limited
Market Opportunities and Future Outlook
A whitespace is forming around agentic, long-running process orchestration where enterprises need automation that can manage exceptions, coordinate multiple systems, and preserve end-to-end accountability. UiPath’s 2026 product moves underline this shift, including the introduction of Maestro Case in June 2026 for managing complex cases, and Coupa’s May 2026 acquisition of Tonkean to bring agentic intake and multi-agent orchestration into spend management. These actions point to demand for platforms that combine process intelligence, orchestration, and governance as a single operating layer rather than as add-ons to task automation.
Industry standardization and interoperability also represent an opportunity as buyers seek to avoid fragmented AI automations across domains. In June 2026, TM Forum members launched an AI-native Open Digital Architecture roadmap to align AI-driven operations in telecom IT and networks, which increases the pull for API-first, event-driven automation with reusable components and policy controls. Vendors that package pre-validated connectors, evidence repositories, and governance templates for regulated verticals can expand adoption among business-led teams while meeting audit and security requirements that accompany citizen-developed workflows.
Recent Industry Developments in Digital Process Automation Market
- June 2026: IBM announced IBM Cloud Pak for Business Automation (CP4BA) 26.0, adding a unified AI layer designed to support generative AI and agent integration across automation modules. The release improves IBM’s positioning in large, hybrid enterprises seeking a consolidated platform for orchestration, content, and decision workflows while maintaining governance controls.
- May 2026: IBM introduced IBM Enterprise Advantage, an asset-based consulting offering that includes Process Studio to convert legacy processes into agent-ready workflows. It accelerates modernization programs by packaging repeatable methods and tooling, shifting services engagements from bespoke delivery to scalable transformation.
- April 2026: Pegasystems launched Pega Blueprint for Government, positioning a workflow design tool with FedRAMP High and DoD IL5 security authorizations. It expands Pega’s ability to serve government and regulated buyers that require strong compliance credentials alongside rapid workflow design and automation.
Digital Process Automation Market Report Scope and Research Methodology
Market Definition and Coverage
For this study, the digital process automation market is defined as the revenue generated from software and related services that help organizations design, run, and improve end-to-end digital workflows, including rules-based and intelligence-assisted automation across business processes.
Scope exclusions: We exclude pure labor-only business process outsourcing and custom application development work that is not tied to a repeatable process automation product or managed automation service.
Segments Covered in This Report
- By Component
- Solution
- Service
- By Deployment
- On-demand
- On-premise
- By Organization Size
- Small- and Medium-sized Enterprises
- Large Enterprises
- By End User
- Banking, Financial Services and Insurance (BFSI)
- Manufacturing
- IT and Telecommunication
- Aerospace and Defense
- Healthcare
- Retail and Consumer Goods
- Other End Users
- By Geography
- North America
- United States
- Canada
- Mexico
- South America
- Brazil
- Argentina
- Rest of South America
- Europe
- Germany
- United Kingdom
- France
- Rest of Europe
- Asia-Pacific
- China
- Japan
- India
- South-East Asia
- Rest of Asia-Pacific
- Middle East and Africa
- Middle East
- Saudi Arabia
- United Arab Emirates
- Rest of Middle East
- Africa
- South Africa
- Egypt
- Rest of Africa
- Middle East
- North America
Data Sources, Market Sizing, and Validation
Desk Research
Desk work starts by setting a clear boundary around what counts as digital process automation revenue, and then collecting public signals that allow us to size demand and observe adoption patterns. We used sources such as the US Bureau of Labor Statistics for productivity and industry employment context, the US Census Bureau for business activity trends, and OECD digital economy indicators to understand automation readiness across economies.
To keep the model tied to buying behavior, we also relied on publicly available regulatory and standards references (including NIST publications), selected peer reviewed journals covering workflow automation and process mining adoption, and trade association materials on enterprise IT spending priorities. Company filings, annual reports, and investor presentations were used to track revenue mix language, go-to-market shifts, and regional exposure. In parallel, we used paid company financials and news intelligence subscriptions to cross-check disclosures and track major deal announcements. These examples are not exhaustive, and other public and paid references were used for data collection, validation, and clarification during the analysis.
Primary Interviews and Surveys
Primary inputs were used to pressure-test the desk assumptions, especially around what buyers include in a DPA budget and how pricing changes as deployments move toward on-demand delivery. We spoke with solution providers, systems integrators, and enterprise users across APAC, EMEA, and the Americas, so the regional adoption pace, services attach rates, and procurement cycles could be checked before finalizing the model.
Distribution of primary research fieldwork respondents
| Company type | Respondent position | Region |
|---|---|---|
| Top tier: 35% | CXOs: 13% | APAC: 42% |
| Mid tier: 51% | Functional/Unit leaders: 38% | EMEA: 32% |
| Smaller Players: 14% | Managers: 49% | Americas: 26% |
Market-Sizing & Forecasting
The core model uses a top-down build that reconstructs the spend pool by linking enterprise digitization budgets and automation penetration rates to major end-user industries, and then it is split by deployment type and component using observed mix indicators. To avoid over-counting adjacent categories, we only count revenues directly tied to DPA solutions, including their implementation, support, and managed services, when they are sold for workflow automation outcomes.
We then run selective bottom-up checks using sampled vendor revenue disclosures, channel feedback, and a simple ASP times volume sanity check for common use cases. Where gaps appear, these checks are used to adjust the totals. Key inputs we track include the share of automation projects delivered on-demand versus on-premise, services attach rates for implementations and ongoing optimization, enterprise IT spending direction in regulated industries, the pace of low-code adoption in workflow programs, and the level of process mining and orchestration adoption that expands deal sizes. For forecasting, scenario analysis is used so the base case reflects the most repeated assumptions heard in interviews on budget cycles, pricing pressure, and rollout timelines. Sensitivity ranges are then applied to reflect faster or slower adoption periods.
Data Validation & Update Cycle
Validation is done through multiple checks so the final numbers do not rely on one single source or one single assumption. Outputs are compared against independent signals such as enterprise software spending direction, public revenue commentary trends, and observed deployment shifts. When unusual spikes or sudden mix changes show up, we review and correct them using additional follow-ups.
Before sign-off, the model and write-up go through a step-by-step internal review to keep calculation logic, currency treatment, and year alignment consistent across tables. The report is refreshed once a year, and interim updates are made when material events occur that can shift demand, pricing, or adoption patterns. Right before delivery, we run a fresh pass on the model inputs so clients receive the latest updated view.
Mordor Intelligence's Digital Process Automation Market Sizing Compared With Other Published Estimates
Published market sizes for digital process automation can differ even when the same year is referenced, because the market boundary is not always set the same way and the treatment of services revenue can change the total quickly. We also see differences when some estimates anchor on longer forecast windows or apply faster adoption curves without re-checking those assumptions against current buyer behavior.
Key gap drivers in this market usually come from what gets counted as DPA versus adjacent automation categories, how on-demand pricing and services attach are modeled, and whether organization-size coverage is complete. Adoption signals, deployment mix, and component split logic matter here, because a small change in what is considered managed automation services can move the number by billions in a single year. Implementation timing and currency conversion timing also add spread when data is aggregated across regions.
Benchmark comparison
| Source | Market Size | Gaps in Research Methodology |
|---|---|---|
| Mordor Intelligence | USD 15.40 B (2025) | |
| Global Research Publisher A | USD 16.52 B (2025) | This estimate appears to use a broader platform-led scope and a longer runway view, which can pull in more bundled platform and services revenues that some buyers label as workflow modernization rather than DPA-only spend. |
| Global Advisory Publisher B | USD 19.92 B (2025) | The number is likely influenced by a wider functional interpretation that includes multiple business function automation buckets and a higher assumed adoption pace, which can increase the counted spend beyond core DPA solution plus related implementation and support. |
Deal-size checks, deployment mix splits, and services attach benchmarks are the evidence points that keep Mordor Intelligence tied to a repeatable DPA demand pool instead of a broader automation spend bucket. When scope is kept consistent and the same assumptions are re-validated across regions, the outcome is easier to trace and to update as pricing and delivery models change.
Key Questions Answered in the Report
What is the current value of the digital process automation market?
The market is valued at USD 17.16 billion in 2026 and is projected to reach USD 29.52 billion by 2031.
Which geographic region leads revenue?
North America holds 35.78% of 2025 revenue, driven by mature cloud infrastructure and early AI adoption.
Which segment will grow fastest through 2031?
Healthcare workflows are forecast to advance at a 13.41% CAGR due to digital transformation and compliance needs.
How quickly are on-demand platforms expanding?
Cloud-based deployments are expected to record a 12.52% CAGR between 2026-2031.
Why are services gaining share?
Enterprises need advisory, integration, and managed-optimization expertise to realize full value, lifting services at a 12.86% CAGR.