
Digital Map Market Size and Share
Market Overview
| Study Period | 2020 - 2031 |
|---|---|
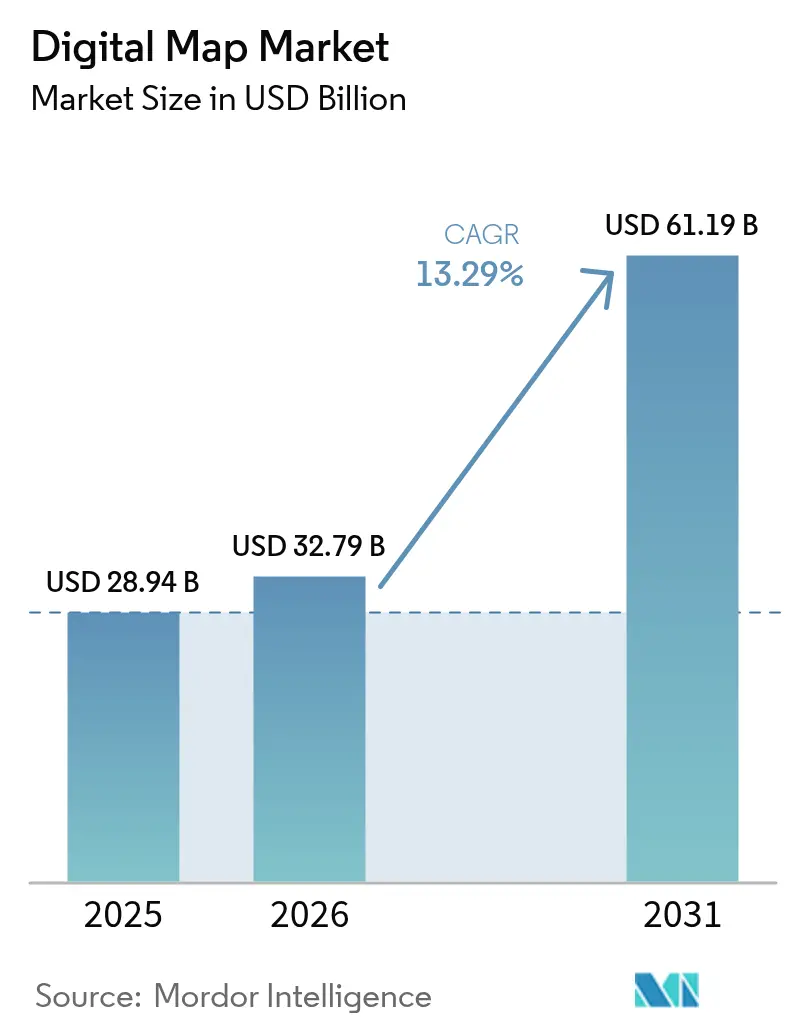
| Market Size (2026) | USD 32.79 Billion |
| Market Size (2031) | USD 61.19 Billion |
| Growth Rate (2026 - 2031) | 13.29 % |
| Fastest Growing Market | Asia Pacific |
| Largest Market | North America |
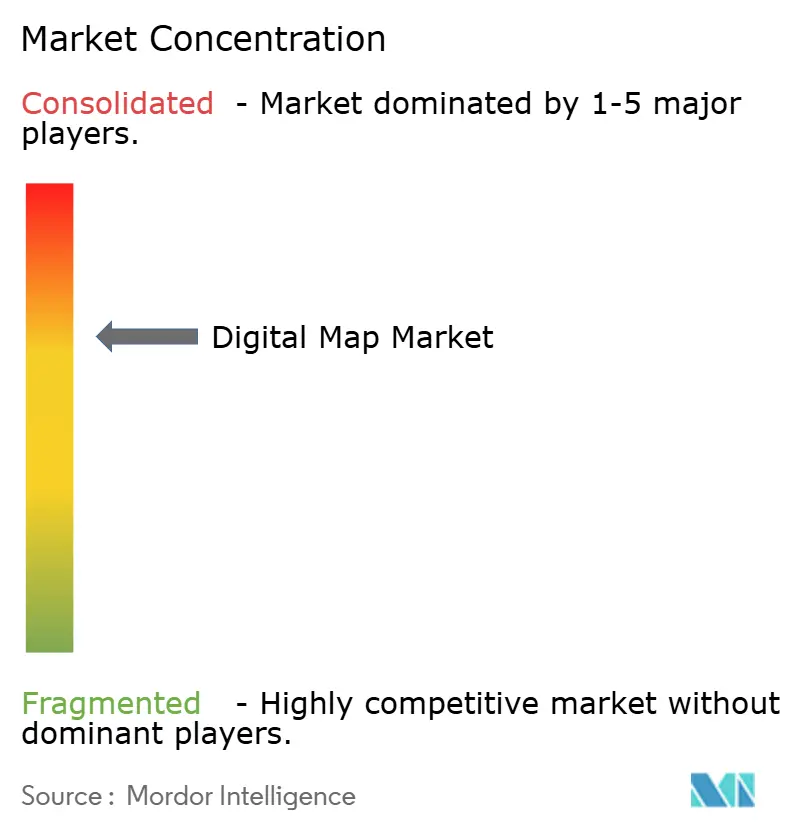
| Market Concentration | Medium |
Major Players *Disclaimer: Major Players sorted in no particular order Image © Mordor Intelligence. Reuse requires attribution under CC BY 4.0. | |
Digital Map Market Analysis by Mordor Intelligence
The digital map market size is projected to be USD 28.94 billion in 2025, USD 32.79 billion in 2026, and reach USD 61.19 billion by 2031, growing at a CAGR of 13.29% from 2026 to 2031. Demand is shifting from static cartography toward dynamic, sensor-fused platforms that feed autonomous driving systems, city-scale digital twins, and corporate carbon-accounting workflows. Software continued to dominate revenue in 2025, but multiyear refresh contracts and cloud-integration projects are steering incremental spending into services. Cloud deployment already captures more than two-thirds of spending and is reinforced by hyperscaler programs that bundle real-time layers into AWS Location Service, Azure Maps, and Google Earth Engine. Automotive remains the largest end-use industry, yet public-sector and defense agencies are scaling geospatial-intelligence modernization at the fastest clip. Competitive intensity is mounting as cloud-native specialists use open standards and modular APIs to undercut traditional perpetual-license models.
Key Report Takeaways
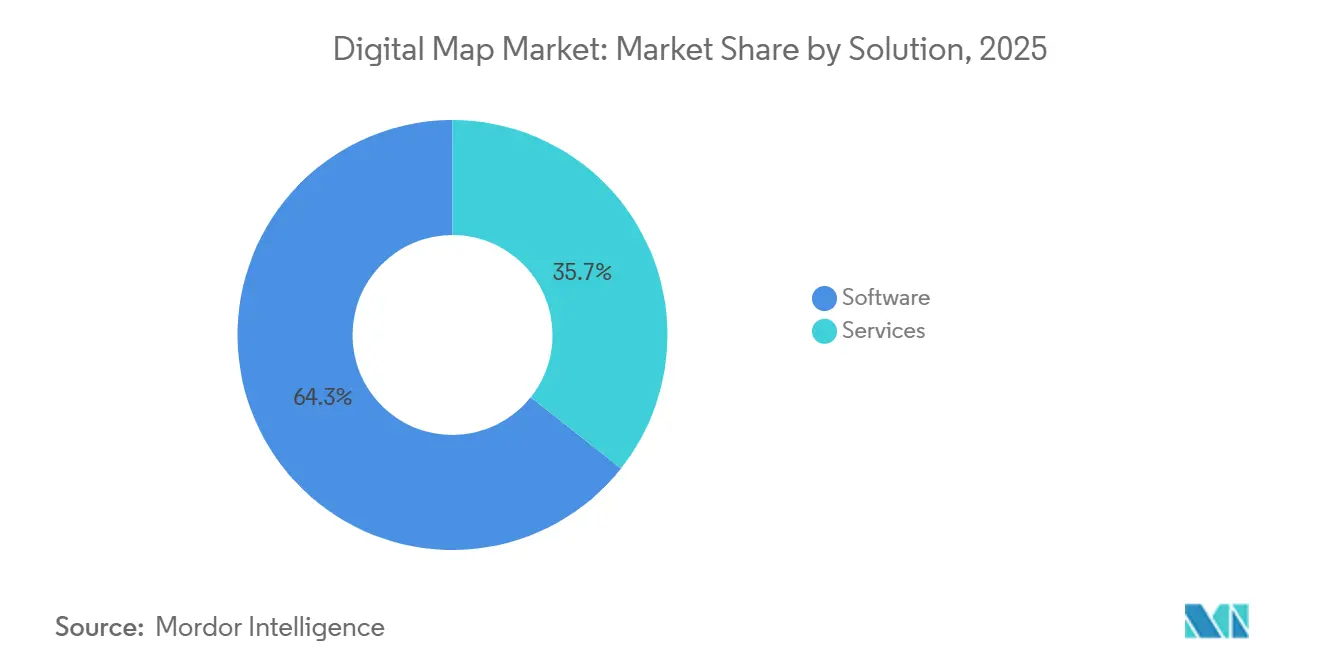
- By solution, software led with 64.33% of 2025 revenue, while services are growing at a 13.71% CAGR through 2031.
- By deployment, cloud held 71.42% of the 2025 digital map market share and is forecast to sustain a 13.66% CAGR to 2031.
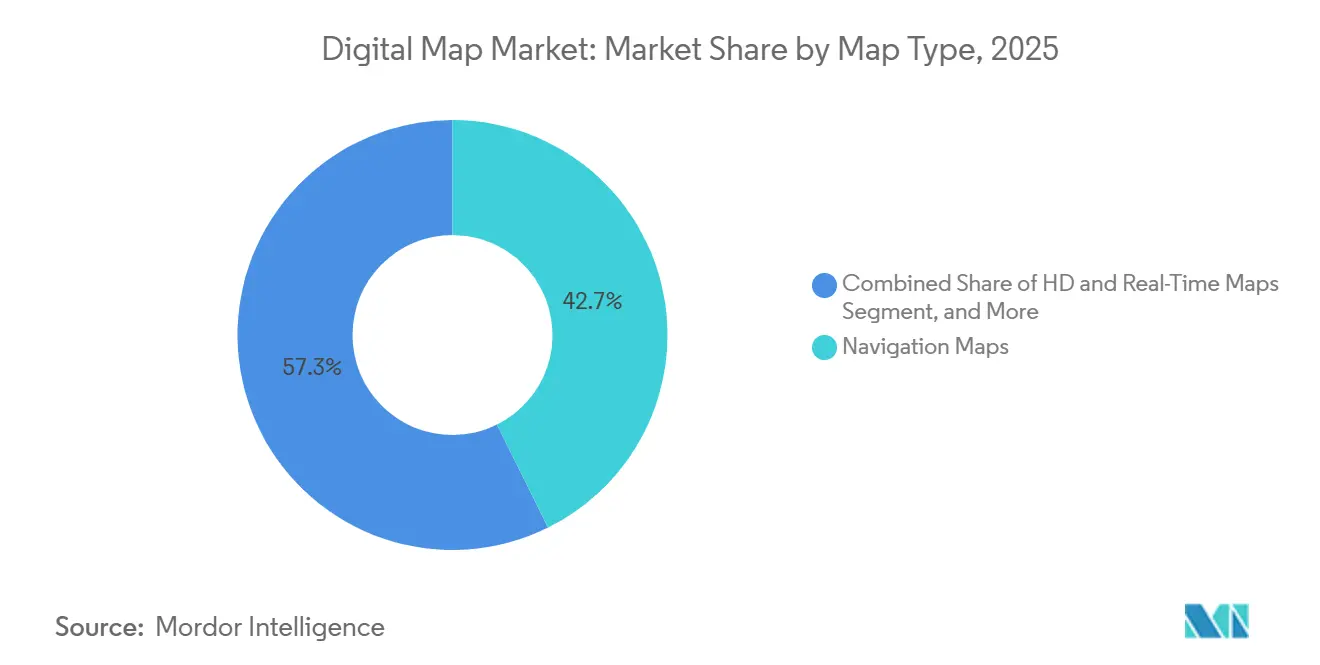
- By map type, navigation maps accounted for 42.67% of 2025 sales, whereas HD and real-time maps are advancing at a 14.07% CAGR to 2031.
- By end-use industry, automotive accounted for 39.17% of the digital map market share in 2025, but the public sector and defense are expanding fastest at a 14.47% CAGR through 2031.
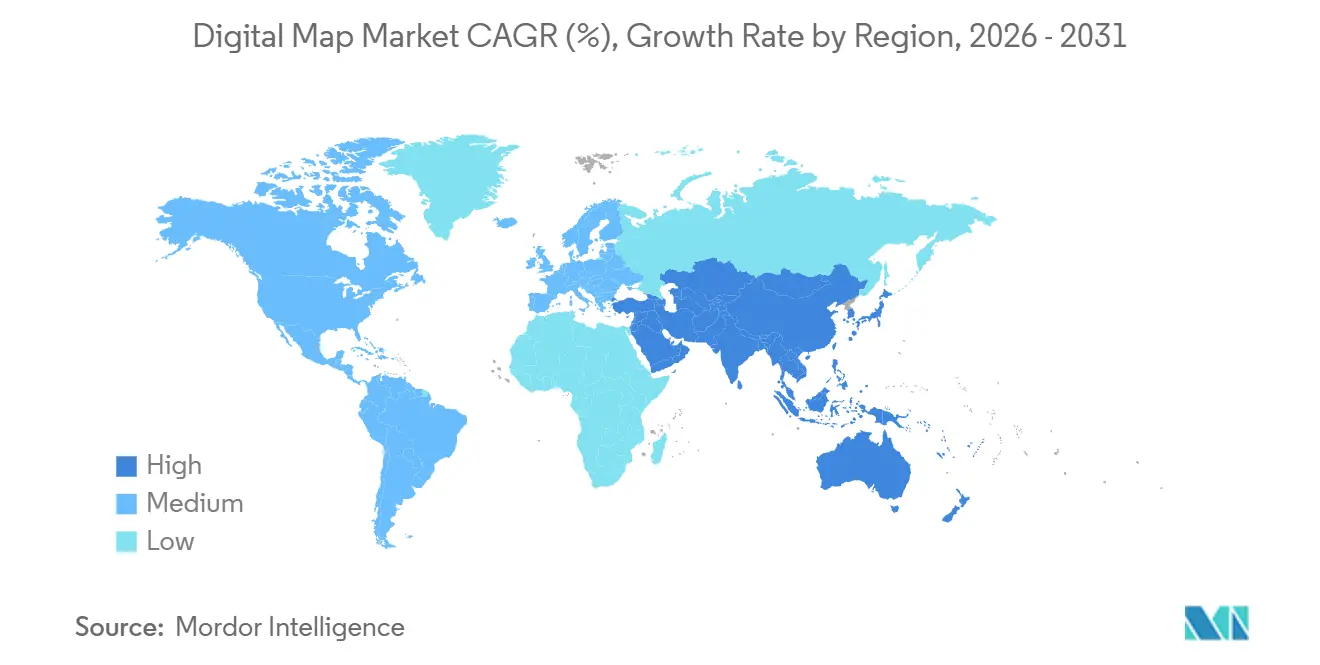
- By geography, North America accounted for 36.83% of 2025 spending, while Asia-Pacific is projected to grow at a 14.24% CAGR over 2026-2031.
Note: Market size and forecast figures in this report are generated using Mordor Intelligence’s proprietary estimation framework, updated with the latest available data and insights as of 2026.
Market Trends and Insights
Drivers Impact Analysis of Digital Map Market*
| Driver | (~) % Impact on CAGR Forecast | Geographic Relevance | Impact Timeline |
|---|---|---|---|
| Rapid Uptake of HD Maps for ADAS and Autonomous Vehicles | +2.8% | Global, concentrated in North America, Europe, and China | Medium term (2-4 years) |
| Explosive Growth of Connected-Car OTA Map-Update Ecosystems | +2.3% | Global, led by North America and Europe | Short term (≤ 2 years) |
| Mainstream Adoption of Cloud-Native GIS Platforms | +2.1% | Global, strongest in North America and Asia-Pacific | Medium term (2-4 years) |
| Smart-City Digital-Twin Programs Scaling Globally | +1.7% | Global, early gains in Singapore, Dubai, Barcelona, and Chinese tier-1 cities | Long term (≥ 4 years) |
| Mandatory EU eCall and Next-Gen Road-Safety Regulations | +1.4% | Europe, with spillover to Middle East and Asia-Pacific | Short term (≤ 2 years) |
| Corporate Scope-3 Carbon Mapping Requirements | +1.2% | Global, concentrated in North America and Europe | Long term (≥ 4 years) |
| Source: Mordor Intelligence | |||
Rapid Uptake of HD Maps for ADAS and Autonomous Vehicles
Automakers rolling out SAE Level 3 and Level 4 features now treat centimeter-grade HD basemaps as non-negotiable safety equipment. Mercedes-Benz activated Drive Pilot in California and Nevada using HERE’s HD Live Map, which fuses sensor data from more than 5 million vehicles to keep lane markings accurate within 10 centimeters. BMW and Volkswagen’s Dynamic Map Platform processes 15 terabytes of probe data each day to refresh a 1.2-million-kilometer European–Japanese network, revealing the high cost of pure LiDAR surveys. A 2025 SAE technical paper showed that overlaying crowd-sourced updates on a static HD layer can trim refresh expense by roughly 40% without losing accuracy.[1] This hybrid model is steering investment toward providers that pair on-board sensor fusion with cloud analytics rather than rely on periodic drive-outs.
Explosive Growth of Connected-Car OTA Map-Update Ecosystems
Over-the-air delivery has moved from a premium add-on to a regulatory baseline as drivers and safety agencies demand up-to-the-minute road data. Ford pushed 63 million delta-compressed map packages in 2024, cutting cellular payloads 85% and slashing data costs. Stellantis embedded Snapdragon Ride Flex chips so updates run automatically while vehicles charge, eliminating the latency that once delayed critical patches.[2] Tesla ingests 1.5 billion fleet miles each month, refreshing lane geometry without third-party royalties and proving the margin upside of vertical integration. Map vendors unwilling to offer lightweight APIs that integrate seamlessly with diverse telematics stacks risk losing share to OEMs writing their own pipelines.
Mainstream Adoption of Cloud-Native GIS Platforms
Consumption-based cloud GIS is eroding the pricing power of perpetual desktop suites while expanding the total user base. Esri’s ArcGIS Online crossed 15 million seats in 2025 as agencies migrated to pay-as-you-go tiers that scale with data volume.[3] Google Earth Engine added commercial real-time change-detection APIs that let retailers and contractors audit sites without field visits. AWS Location Service now hooks directly into SageMaker, so data scientists can train location-aware models on embedded map layers instead of building custom ETL flows. As hyperscalers commoditize storage and rendering, legacy GIS suppliers must pivot toward vertical analytics and advisory services to defend margins.
Smart-City Digital-Twin Programs Scaling Globally
City planners are promoting pilot twins into full production systems that couple dense sensor grids with authoritative 3D basemaps. Singapore’s Virtual Singapore ingests data from more than 100,000 IoT nodes to simulate flood scenarios and transit flows at 1-meter resolution. Dubai now requires ISO 19650-compliant BIM files for all new construction, feeding its national twin for automated permitting and infrastructure scheduling. Barcelona overlays live air-quality and traffic feeds on its Sentilo platform to test low-emission zones before rollout. Map providers that supply modular, standards-based base layers are best placed to win these multi-vendor municipal contracts.
Restraints Impact Analysis of Digital Map Market*
| Restraint | (~) % Impact on CAGR Forecast | Geographic Relevance | Impact Timeline |
|---|---|---|---|
| Escalating Costs of Continuous, Centimeter-Level Map Refresh | -1.8% | Global, most acute in North America and Europe | Short term (≤ 2 years) |
| Heightened Data-Privacy and Localization Statutes (GDPR, PIPL) | -1.5% | Europe and China, with spillover to Asia-Pacific | Medium term (2-4 years) |
| IP-Licensing Disputes Among Data Providers and OEMs | -1.1% | Global, concentrated in automotive sector | Medium term (2-4 years) |
| Algorithmic Bias and Liability Concerns in AI-Generated Maps | -0.9% | Global, regulatory frameworks emerging in Europe and North America | Long term (≥ 4 years) |
| Source: Mordor Intelligence | |||
Escalating Costs of Continuous, Centimeter-Level Map Refresh
Sub-10-centimeter accuracy across continental road networks demands heavy LiDAR fleets, aerial imagery, and cloud processing that only global incumbents can afford. HERE’s 200-vehicle LiDAR armada cut gross margin on HD services by 320 basis points when refresh cycles tightened from quarterly to weekly. TomTom trimmed survey cadence in secondary markets and pivoted to satellite change detection, lowering costs 30% but stretching update latency from days to weeks. Smaller challengers rely on dash-cam computer vision yet still struggle to meet Level 4 precision targets. The economics widen incumbents' moats and slow competitive churn.
Heightened Data-Privacy and Localization Statutes (GDPR, PIPL)
New privacy regimes are splintering the global data fabric into regional silos, raising compliance costs and complicating cross-border services. GDPR requires any geospatial trail linked to an identifiable person to remain within EU borders, prompting providers to spin up sovereign clouds in Frankfurt and Amsterdam. China’s 2024 revisions to the Personal Information Protection Law bar the outbound transfer of domestic map data without state sign-off, compelling foreign vendors to enter joint ventures with local players. India’s 2023 Digital Personal Data Protection Act empowers regulators to audit foreign map providers’ handling practices, delaying several market entries by more than a year. These overlapping rules strain smaller specialists that lack capital for duplicate infrastructure and favor incumbents with regional partners.
*Our forecasts treat driver/restraint impacts as directional, not additive. The impact forecasts reflect baseline growth, mix effects, and variable interactions.
Digital Map Market Segment Analysis
By Solution:
Services Rise on Recurring Refresh ContractsSoftware accounted for 64.33% of the digital map market share in 2025, a position built on decades of desktop GIS licenses and embedded navigation stacks. Even so, service revenues, ranging from continuous map-refresh subscriptions to cloud-integration consulting, are forecast to climb at a 13.71% CAGR through 2031, adding the largest slice of the incremental digital map market over the period. Enterprises now favor predictable operating expense models over one-time capital outlays; Trimble’s 2024 purchase of Transporeon, which bundles routing APIs with logistics consulting, produced a 28% year-over-year lift in subscription lines during 1H 2025. Esri and Maxar report the same pattern in municipal digital-twin engagements, where customers insist on outcome-based contracts tied to refresh frequency rather than seat counts.
The tilt toward services is also a talent play. Few enterprises employ in-house geospatial experts, so they outsource data fusion, custom cartography, and API governance to suppliers that can guarantee service-level agreements. Software will remain the larger revenue pool in absolute terms, but licensing growth is decelerating as cloud-native open-source stacks undercut pricing power. Vendors that fail to build substantial consulting and managed-hosting arms risk ceding wallet share to systems integrators or hyperscalers that already command the customer relationship.
By Deployment:
Cloud Becomes the Default Geospatial PlatformCloud installations accounted for 71.42% of 2025 revenue and are projected to maintain a 13.66% CAGR through 2031, reinforcing a cloud-first stance across the digital map market. With AWS Location Service exposing HERE, Esri, and Grab tiles behind a single pay-as-you-go endpoint, enterprises avoid the complexity of multiple negotiations. Microsoft went further in March 2025, embedding Azure Maps inside Power BI so analysts can overlay sales territories without writing code. These moves slash deployment friction and accelerate adoption among non-GIS specialists, driving new chunks of the digital map market size into the cloud column.
On-premises servers persist in defense, critical infrastructure, and heavily regulated utilities where sovereign data or air-gap mandates remain immovable. Esri disclosed at its 2025 user conference that roughly 30% of ArcGIS Enterprise seats still run on customer metal, down from 55% in 2020. As sovereign cloud regions open in Europe, India, and the Middle East, even some of those workloads are expected to migrate. By 2031, analysts see on-premises stabilizing at 20-25% of the digital map market share, anchoring a specialized but profitable niche for vendors able to meet zero-connectivity requirements.
By Map Type:
HD and Real-Time Layers Outpace Commodity NavigationNavigation products retained a 42.67% share of 2025 revenue, yet HD and real-time layers are set to outgrow them at a 14.07% CAGR through 2031, expanding their contribution to the digital map market. Waymo’s sixth-generation driver localizes against 5-centimeter HD tiles to maintain reliability in dense urban cores. General Motors’ Ultra Cruise consumes 2 GB of HD data per driving hour, prompting the automaker to secure redundant feeds to avoid single-vendor risk. These premium requirements place a pricing floor well above standard routing layers.
By contrast, commodity navigation faces a margin squeeze as gig-economy platforms and mid-tier OEMs pivot to open-source alternatives such as OpenStreetMap or government basemaps. Topographic and thematic sets will continue to serve defense, maritime, and environmental monitoring, but track macroeconomic growth rather than the double-digit rates seen in HD. Providers that cannot fund the sensor-fusion pipelines and centimeter-grade refresh cadences demanded by Level 3+ autonomy may be relegated to low-margin consumer navigation or niche thematic verticals.

By End-Use Industry:
Public Sector Budgets Accelerate Past AutomotiveAutomotive generated 39.17% of 2025 sales on the strength of embedded navigation, ADAS, and forthcoming autonomy layers. Yet the public sector and defense segment is projected to be the fastest-growing, advancing at a 14.47% CAGR and absorbing an increasing share of the digital map market. The U.S. Department of Defense awarded Maxar USD 476 million in 2024 for high-resolution 3D terrain, a 40% budget bump over the prior cycle. NGA plans to automate feature extraction so battlefield maps refresh in near real time, driving fresh demand for analytics services.
Commercial verticals are following suit. Engineering and construction firms overlay BIM models with live survey data to trim rework costs by 12% on hundreds of projects. Telecom operators use geospatial AI to fine-tune 5G tower placement, cutting site-acquisition expenses by 18%. Retailers rely on demographic polygons to prioritize store locations and avoid cannibalization, an application that Esri’s Business Analyst now delivers to more than 3,000 chains. Collectively, these non-automotive uses deepen and diversify the revenue base, cushioning suppliers against any slowdown in vehicle sales cycles.
Geography Analysis
North America Digital Map Market
North America accounted for 36.83% of 2025 revenue, giving the region the largest share of the digital map market in the base year. Autonomous-vehicle pilots in California and Nevada drive uptake, Tesla’s high-volume fleet telemetry, and robust U.S. defense geospatial budgets. The Federal Communications Commission’s 2024 allocation of Cellular Vehicle-to-Everything spectrum accelerated connected-car deployments and boosted demand for real-time traffic and hazard layers. Canada benefits from Natural Resources Canada's open basemaps, which lower entry barriers for start-ups, while Mexico lags because rural broadband gaps limit cloud GIS adoption. As connected-vehicle penetration nears saturation, regional growth is expected to trail the 13.29% global CAGR, but absolute spending will still expand as defense agencies refresh HD terrain data.
APAC Digital Map Market
Asia-Pacific is projected to post the fastest 14.24% CAGR through 2031 and will add the largest share of the incremental digital map market over the forecast window. China’s Baidu Maps recorded 650 million monthly active users in Q4 2024 after integrating EV-charger availability and autonomous-taxi routing. India’s Smart Cities Mission requires all 100 designated municipalities to deploy GIS platforms for waste, mobility, and water management, feeding multiyear contracts to MapmyIndia and Esri India. Japan’s Zenrin–Toyota partnership is building HD maps for Level 3 Lexus Teammate, while South Korea earmarked KRW 500 billion (USD 375 million) to digitize its road grid at 10-centimeter resolution ahead of the 2027 Busan World Expo. These programs, combined with rapid 5G rollout, underpin sustained double-digit regional growth.
EMEA and South America Digital Map Market
Europe captured a mid-20s share in 2025, supported by the EU’s eCall mandate and improvements in Galileo satellite accuracy. The Digital Markets Act now obliges Apple and Google to open mapping APIs, a rule that could redirect traffic to regional specialists such as HERE and TomTom. Strict GDPR localization favors vendors with sovereign clouds in Frankfurt and Amsterdam, reinforcing incumbent positions. In the Middle East and Africa, the United Arab Emirates and Saudi Arabia bankroll smart-city twins, yet sub-Saharan African adoption is constrained by limited cadastral databases. South American demand is centered on Brazil and Argentina, where urban logistics platforms need reliable routing, but currency volatility tempers long-horizon infrastructure investment.
Regulatory Landscape
The regulatory environment for digital maps is tightening around data governance, interoperability, and cross-border data movement. In the European Union, the Data Act (Regulation (EU) 2023/2854) became applicable in September 2025, setting harmonized rules for access to and use of data generated by connected products and related services. This is a direct touchpoint for map platforms ingesting vehicle, mobile, and IoT telemetry for real-time layers.
Standards bodies and intergovernmental programs are also shaping how authoritative geospatial data is structured and exchanged. In March 2026, the UN Statistical Commission endorsed the second edition of the Global Statistical Geospatial Framework (GSGF), reinforcing alignment between statistical and geospatial reference systems in public-sector implementations. ISO published ISO 19135:2026 in February 2026, adding a formal framework for registering and governing information registers, which supports consistent identifiers and registries used across geospatial datasets. In China, GB/T 45394-2025 (implemented in October 2025) provides general specifications for cyberspace mapping, data provision, and map applications, adding compliance steps for providers operating in, or integrating data from, the Chinese market.
Value Chain Analysis
The digital map value chain begins with multi-source data capture and licensing, then moves through normalization, feature extraction, conflation, and quality assurance before delivery via APIs, SDKs, and tiles. Key upstream inputs include satellite and aerial imagery, mobile mapping and LiDAR survey data, GNSS corrections, and probe data from connected vehicles and mobile devices. Processing increasingly relies on cloud pipelines for sensor fusion and change detection, and then packages outputs as navigation layers, HD road models, real-time traffic and hazard layers, and 2D/3D basemaps used by automotive stacks, GIS platforms, and enterprise applications.
Downstream value is created through distribution and integration, where hyperscalers and GIS platforms simplify procurement and deployment, and systems integrators implement vertical workflows (fleet operations, smart-city digital twins, defense terrain, utilities, and carbon accounting). Supplier dynamics are shifting as open-data ecosystems reduce duplication. In July 2026, the Overture Maps Foundation reached 50 members (including Grab, Uber, and Samsara), signaling broader coordination on shared base layers and schemas used to ground developer tooling. At the same time, imagery and 3D refresh capabilities are being bundled closer to delivery. Esri outlined committed imagery refresh partnerships (Nearmap and Airbus) beginning in 2H 2026, tightening the link between upstream collection and frequently updated basemap distribution.
Competitive Landscape
Alphabet, HERE Technologies, and TomTom together control an estimated 55-60% of automotive contracts and consumer navigation revenue, giving the sector a moderate concentration profile. Alphabet monetizes Google Maps and Waze through advertising rather than per-vehicle royalties, allowing aggressive pricing that squeezes fee-based rivals. HERE, backed by German OEMs, shifted its focus to HD Live Map and real-time traffic, lifting automotive sales by 18% in 2024 even as consumer navigation slipped by 7%. TomTom exited personal navigation devices in 2025 to focus on B2B APIs, a pivot that stabilized revenue but narrowed gross margins as the firm scaled its cloud infrastructure.
Cloud-native specialists are fragmenting the field. Mapbox uses an OpenStreetMap foundation and vector-tile compression, which cuts bandwidth consumption by 80%, attracting high-traffic customers such as Snap and Meta. CARTO’s spatial SQL engine on BigQuery lets analysts run geospatial queries without desktop GIS, expanding the addressable user pool among retail and logistics clients. Esri invested USD 150 million to add data centers in Singapore, Dubai, and São Paulo, reducing latency for smart-city and utility workloads while deepening its vertical analytics playbook. These moves chip away at incumbent share by lowering switching costs and broadening developer access.
Regulatory compliance has become a key competitive lever. Providers with ISO 27001 certification and sovereign cloud capacity qualify for sensitive contracts in Europe, India, and China, where foreign data hosting can disqualify bids. Partnerships such as TomTom–Microsoft Azure and HERE–Mercedes-Benz combine data residency with centimeter-grade refresh cycles, creating high barriers for late entrants. Meanwhile, intellectual-property disputes are prompting some automakers to internalize mapping stacks, as General Motors did for its Cruise fleet, thereby pressuring third-party royalties. The net result is a market where incumbents defend their share through deep compliance and high-precision assets, while nimble API vendors seize greenfield enterprise workloads.
Digital Map Industry Leaders
-
Alphabet Inc.
-
HERE Global B.V.
-
TomTom International B.V.
-
Mapbox, Inc.
-
Apple Inc.
- *Disclaimer: Major Players sorted in no particular order
Digital Map Market Companies Covered in this Report
- Alphabet Inc.
- HERE Global B.V.
- TomTom International B.V.
- Environmental Systems Research Institute, Inc.
- Mapbox, Inc.
- Apple Inc.
- Maxar Technologies Inc.
- Collins Bartholomew Limited
- Digital Map Products Inc.
- Digital Mapping Solutions Pty Ltd
- DMTI Spatial Inc.
- Lepton Software Export & Research (P) Ltd.
- ThinkGeo LLC
- MapData Services Pty Ltd
- NavInfo Co., Ltd.
- AutoNavi Holdings Limited
- Baidu Inc.
- Nearmap Ltd
- Zenrin Co., Ltd.
- Trimble Inc.
- CartoDB Inc.
- OpenStreetMap Foundation
- MapQuest, Inc.
Market Opportunities and Future Outlook
A sizable opportunity is forming around AI-ready, continuously updated map layers that reduce the cost and latency of refresh cycles, particularly for HD and real-time products used in automated driving and large-scale digital twins. The industry is also moving from manual map production toward automated pipelines. In June 2026, Baidu integrated its MapAgent framework into Baidu Maps to automate lane-level map generation across more than 360 cities, providing a concrete proof point for scaling update throughput. Separately, the research-to-product pipeline is accelerating through vision-language and ahead-aware mapping approaches reported in CVPR 2026, expanding the set of tools vendors can use to maintain centimeter-level attributes with less manual effort.
Another white-space area is interoperability and ecosystem participation, where buyers are reducing lock-in by standardizing base layers and developer stacks. In July 2026, the Overture Maps Foundation reached 50 members, nearly doubling its 2024 count, indicating broader cross-industry alignment on open map data foundations that can be used to support location applications. Commercial offerings are also bundling frequent basemap refresh into mainstream platforms. Esri and Vantor extended a partnership for quarterly updates of 30 cm Vivid Mosaic imagery basemaps via AI-powered change detection, creating a template for subscription-based refresh services that enterprises can operationalize in construction, utilities, insurance, and public-sector planning where current imagery and change intelligence drive workflow outcomes.
Recent Industry Developments in Digital Map Market
- July 2026: TomTom and Transit Technologies announced a partnership to integrate TomTom Orbis Maps and Live Traffic into Transit Technologies fleet and logistics solutions. The move extends Orbis beyond in-car navigation into operational mapping for commercial fleets, reinforcing demand for real-time layers and workflow APIs rather than static datasets.
- April 2026: HERE and KOTEI announced a strategic partnership to build AI-native navigation designed for software-defined vehicles. The collaboration strengthens HEREs positioning in AI-assisted in-vehicle experiences, where map updates, routing, and driver assistance features are delivered as continuously improving software capabilities.
- July 2025: Google released Rivian Navigation with Google Maps using the Google Maps Auto SDK for customized in-car experiences. This deepens Googles role inside OEM infotainment stacks and raises competitive pressure on fee-based navigation providers by making a hyperscaler-backed map platform easier to embed and tailor at scale.
Digital Map Market Report Scope and Research Methodology
Market Definition and Coverage
This market covers paid digital mapping data and map-enabled software and services used to build, update, deliver, and visualize maps for navigation, location intelligence, and real-time applications across commercial and public users.
Scope exclusions: We exclude free, community-only map usage that is not monetized, and we also exclude consumer hardware devices where mapping is bundled as a minor feature.
Segments Covered in This Report
- By Solution
- Software
- Services
- By Deployment
- On-Premise
- Cloud
- By Map Type
- Navigation Maps
- HD and Real-Time Maps
- Topographic and Thematic Maps
- By End-Use Industry
- Automotive
- Engineering and Construction
- Telecommunications
- Public Sector and Defense
- Retail and Geomarketing
- Other End-Use Industries
- By Geography
- North America
- United States
- Canada
- Mexico
- South America
- Brazil
- Argentina
- Rest of South America
- Europe
- United Kingdom
- Germany
- France
- Italy
- Rest of Europe
- Asia Pacific
- China
- Japan
- India
- South Korea
- Rest of Asia Pacific
- Middle East and Africa
- Middle East
- United Arab Emirates
- Saudi Arabia
- Rest of Middle East
- Africa
- South Africa
- Egypt
- Rest of Africa
- Middle East
- North America
Data Sources, Market Sizing, and Validation
Desk Research
Desk work starts with building the demand and supply context using public sources that are easy to trace. We typically refer to sources such as the US Bureau of Transportation Statistics for mobility indicators, the US Census Bureau for business and population baselines, Eurostat for comparable regional series, and the International Telecommunication Union for mobile and connectivity adoption. When needed, filings and annual reports from public companies, investor presentations, and official press releases are used to understand revenue mix and pricing direction.
To make the model practical, we also check map-adjacent activity signals such as vehicle sales and fleet growth, smartphone penetration, and public spending on transport and smart-city programs. These checks help sanity-check the demand pool before forecasts are applied. Patent databases are selectively reviewed to see where technical focus is shifting, for example real-time updates and higher-definition map layers. Separately, an import and export shipment-level database is used where hardware-linked mapping capture equipment creates visible trade signals. These desk research sources are not exhaustive, and many other public references were used for data collection, validation, and clarification during the study.
Primary Interviews and Surveys
Primary work is used to confirm what gets counted as digital map revenue and to pressure-test adoption rates by map type and deployment. We spoke with a mix of map data suppliers, software providers, system integrators, and end-user teams in automotive, telecom, public sector, and retail, with coverage across APAC, EMEA, and the Americas so regional pricing and contract structures could be compared.
Distribution of primary research fieldwork respondents
| Company type | Respondent position | Region |
|---|---|---|
| Top tier: 27% | CXOs: 19% | APAC: 43% |
| Mid tier: 51% | Functional/Unit leaders: 22% | EMEA: 32% |
| Smaller Players: 22% | Managers: 59% | Americas: 25% |
Market-Sizing & Forecasting
Sizing is built using a top-down approach where regional spending pools are reconstructed from the mix of map software, map services, and map-data usage across key end-use industries, then normalized by deployment patterns and map-type intensity. To keep it grounded, we cross-check with selective bottom-up approximations, such as sampled provider revenue splits, channel checks on typical contract sizes, and a simple ASP times volume logic for recurring map update and API usage where the data is available.
The model uses market fingerprints that tend to move digital map demand in a visible way. These include smartphone and connected-device adoption, vehicle production and the share of navigation and ADAS-enabled vehicles, growth in fleet and last-mile delivery activity, cloud migration rates for geospatial workloads, and public spending tied to transport digitization and smart-city programs. When a bottom-up input is missing for a niche use case, we fill the gap using a conservative penetration proxy and then validate the implied spend per user through interviews so the totals do not drift.
Forecasts are developed using multivariate regression, with the indicators above as the main drivers, then adjusted through scenario analysis for pricing changes in HD and real-time map layers. The final trajectory is reviewed against what interviewees expect for renewal cycles, update frequency, and the pace of new use cases such as real-time routing and digital twins.
Data Validation & Update Cycle
Validation is done by triangulating outputs against independent signals, including connectivity growth, vehicle and fleet indicators, and the observed pace of cloud deployment in mapping workloads. Outliers are flagged when regional totals imply unrealistic spend per connected user, or when map-type mixes swing too sharply. After that, the underlying assumptions are re-checked.
Before sign-off, the model goes through multi-step analyst reviews, and we re-contact sources when a major variance appears or when a new regulation, contract award, or pricing shift materially changes market behavior. Reports are refreshed annually, with interim updates when a material event occurs, and a final pre-delivery review is completed so clients receive the most current view available at the time of publication.
Mordor Intelligence's Digital Map Market Size Measured Against Other Published Estimates
Published market values for digital maps can look different even when the topic name is the same, since each study draws the boundary around map types, revenue streams, and end-use coverage in its own way. Differences also show up when one estimate anchors on a base year like 2025 while another uses 2026, or when currency conversion timing and inflation handling are not aligned.
By tracking contract mix across software and services, checking cloud versus on-premise share, and refreshing these inputs through primary validation, Mordor Intelligence keeps the digital map total tied to monetized mapping revenue rather than adjacent location analytics that can inflate the number. The spread usually comes from whether HD and real-time layers are fully counted, how usage-based API revenue is annualized, and whether forecasts assume steady pricing or faster price compression as more data sources enter the stack.
Benchmark comparison
| Source | Market Size | Gaps in Research Methodology |
|---|---|---|
| Mordor Intelligence | USD 32.79 B (2026) | |
| Global Consultancy A | USD 32.35 B (2025) | Uses a 2025 base year and a broader technology framing that can bundle mapping with related location data management tools, which shifts the starting value even before growth is applied. |
| Trade Journal B | USD 31.24 B (2025) | Press-release style sizing typically summarizes a single base case with limited visibility on how usage-based API revenues, HD layer pricing, and currency timing are treated across regions. |
Looking at the three numbers together, most of the gap is explained by year choice and by how tightly the scope is kept around paid digital mapping versus adjacent software. When the scope rules and key drivers are stated clearly, the estimate becomes easier to replicate, and it is also easier for decision-makers to adjust assumptions for their own planning.
Key Questions Answered in the Report
How fast is spending on high-definition maps growing?
HD and real-time layers are forecast to expand at a 14.07% CAGR through 2031 as autonomous-vehicle programs scale.
Which region will add the most incremental revenue by 2031?
Asia-Pacific, led by China, India, and Japan, is projected to post the fastest 14.24% CAGR and contribute the largest share of new spending.
What drives the shift from software licenses to services?
Enterprises increasingly favor continuous map-refresh subscriptions and cloud-integration consulting, pushing services to a 13.71% CAGR through 2031.
Why are cloud deployments overtaking on-premise installations?
Elastic scaling, integrated security, and bundled APIs from AWS, Azure, and Google Cloud make cloud the default choice, already holding 71.42% of 2025 revenue.
How do data-privacy laws affect global providers?
GDPR, China’s PIPL, and India’s data-localization rules force vendors to maintain regional clouds, raising compliance costs and limiting cross-border data flows.
Which companies are challenging the established leaders?
Mapbox, CARTO, and Esri are winning enterprise deals with open standards, vector-tile compression, and spatial SQL services that lower switching costs.