
Digital Inks Market Size and Share
Market Overview
| Study Period | 2020 - 2031 |
|---|---|
| Market Size (2026) | USD 4.9 Billion |
| Market Size (2031) | USD 6.6 Billion |
| Growth Rate (2026 - 2031) | 6.13 % |
| Fastest Growing Market | Asia Pacific |
| Largest Market | Asia Pacific |
| Market Concentration | Medium |
Major Players *Disclaimer: Major Players sorted in no particular order Image © Mordor Intelligence. Reuse requires attribution under CC BY 4.0. | |
Digital Inks Market Analysis by Mordor Intelligence
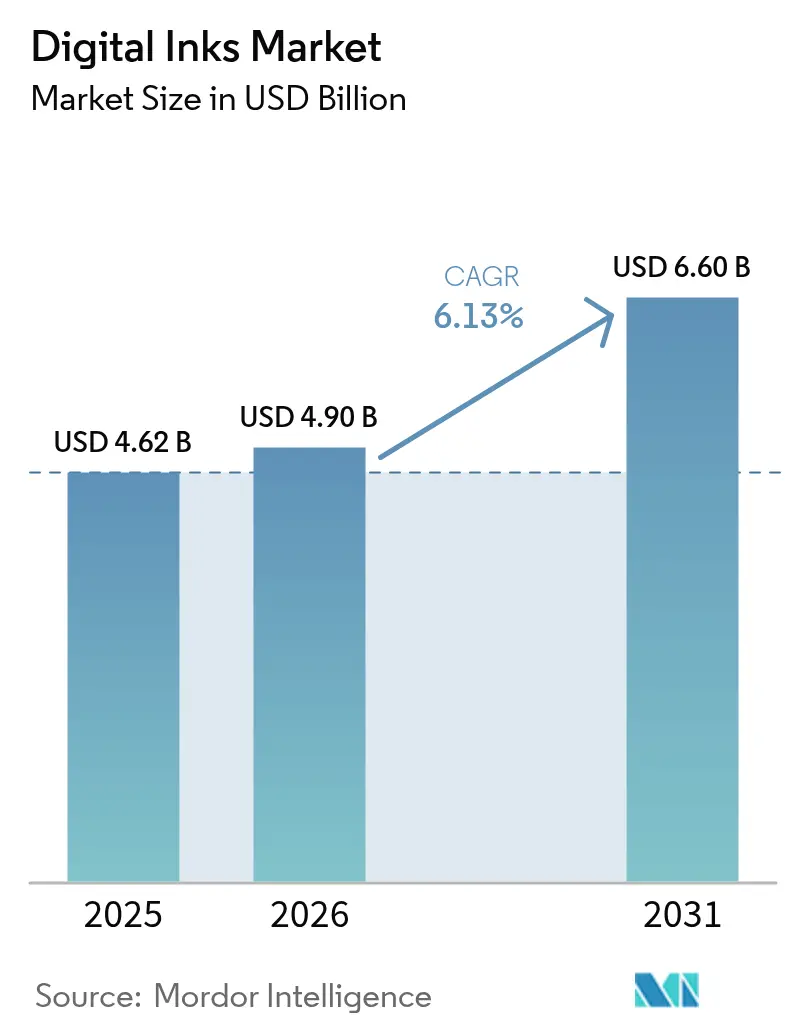
Digital Inks market size in 2026 is estimated at USD 4.9 billion, growing from 2025 value of USD 4.62 billion with 2031 projections showing USD 6.6 billion, growing at 6.13% CAGR over 2026-2031. This sustained expansion reflects the rapid shift from analog to digital printing workflows that favor on-demand customization, resource efficiency, and compliance with tightening environmental regulations. Demand growth gathers pace around UV-curable formulations that cure instantly, nano-scale conductive materials that enable printed electronics, and substrate-specific adhesion chemistries that open new industrial use-cases. Continuous gains in printhead precision, fluid viscosity control, and inline quality inspection create productivity benefits that validate capital spending on next-generation presses. Simultaneously, stricter global standards on volatile organic compound (VOC) emissions accelerate the pivot toward low-solvent or solvent-free ink chemistries, reinforcing technological differentiation among suppliers. Applications such as packaging, textiles, and flexible electronics translate these technical improvements into shorter production runs, rapid design iteration, and lower inventories, strengthening the overall digital inks market trajectory.
Key Report Takeaways
- By ink type, solvent-based systems retained 35.55% of the digital inks market share in 2025, whereas UV-curable inks are forecast to expand at a 6.86% CAGR through 2031.
- By printing technology, drop-on-demand inkjet held 54.60% share of the digital inks market size in 2025, while continuous inkjet is projected to log a 7.18% CAGR between 2026 and 2031.
- By application, packaging captured 41.20% revenue share in 2025; while other applications represent the fastest growing segment with a 7.22% CAGR to 2031.
- By geography, Asia-Pacific led with 48.10% of the digital inks market share in 2025 and is advancing at a 6.95% CAGR through the forecast period.
Note: Market size and forecast figures in this report are generated using Mordor Intelligence’s proprietary estimation framework, updated with the latest available data and insights as of 2026.
Market Trends and Insights
Drivers Impact Analysis of Digital Inks Market*
| Driver | (~) % Impact on CAGR Forecast | Geographic Relevance | Impact Timeline |
|---|---|---|---|
| Surge in Demand for UV-Curable Inks in Packaging and Signage | +1.2% | Global, with concentration in North America and Europe | Medium term (2-4 years) |
| Rapid Adoption of Inkjet Printing for Textile Digitalization | +1.8% | APAC core, spill-over to Europe and North America | Long term (≥ 4 years) |
| Rising Uptake of Eco-Solvent Inks on Sustainability Grounds | +0.9% | Europe leading, followed by North America | Short term (≤ 2 years) |
| Emergence of Conductive Nano-Inks for Flexible Electronics | +0.7% | APAC manufacturing hubs, R&D in North America | Long term (≥ 4 years) |
| Expansion of E‑Commerce and On‑Demand Packaging | +1.1% | Global, with highest impact in North America and Europe | Medium term (2-4 years) |
| Source: Mordor Intelligence | |||
Surge in Demand for UV-Curable Inks in Packaging and Signage
Instant polymerization under ultraviolet light eliminates drying bottlenecks, enabling higher throughput and energy savings compared with solvent systems. Minimal VOC emissions make UV-curable inks an effective route to regulatory compliance, and producers such as DuPont have commercialized water-based pigment series that meet food-contact norms without sacrificing color density[1]. Packaging converters value the ability to decorate glass, metal, and multilayer polymer films while maintaining barrier integrity, whereas outdoor signage installers rely on the inks’ superior weather fastness and color retention. Accelerated adoption is further supported by lower maintenance costs and the growing availability of mid-radiant LED curing modules that reduce press heat loads. These combined benefits place UV-curable systems on a steady adoption path across both developed and emerging printing hubs.
Rapid Adoption of Inkjet Printing for Textile Digitalization
Digital inkjet technology replaces water-intensive dyeing lines with precision deposition that cuts water use by up to 95% on certain cotton and polyester substrates. Equipment makers such as Kyocera and Epson have scaled print bars capable of 2 m web widths, allowing roll-to-roll fabric printing at industrial speeds. Capacity expansions, including Epson’s new Akita and Tohoku facilities, signal confidence in long-run demand linked to fashion mass customization. Artificial intelligence embedded in RIP software accelerates workflow setup and enables algorithmic pattern generation, trimming design-to-sample cycles. Buyers gain smaller minimum-order quantities and serialized garment identification, benefits that reinforce sourcing shifts toward on-shore or near-shore micro-factories.
Rising Uptake of Eco-Solvent Inks on Sustainability Grounds
Revisions to the United States National Volatile Organic Compound Emission Standards announced in January 2025 push converters toward lower-reactivity solvents, while the European Union’s Green Deal accelerates phase-outs of mineral-based carriers. German and French legislation frame strict reporting thresholds that effectively force substitution to plant-derived alternatives with comparable dry-time and rub resistance. Suppliers such as INX International actively market natural-origin solvents and reclaimed material content to capture early-compliance premiums. Improved odor profiles and indoor-air quality performance broaden the addressable market into interior décor and wallpaper, further extending the eco-solvent growth runway.
Emergence of Conductive Nano-Inks for Flexible Electronics
Silver nanoparticle, graphene, and carbon-nanotube formulations enable printed traces that retain conductivity under repeated bending, unlocking sensor-rich wearables and intelligent packaging. Academic breakthroughs, such as Seoul National University’s laser lift-off process that cuts carbon residue by 92.8%, reduce defect rates in ultrathin circuitry. The printed sensor sub-market is valued at USD 12.1 billion in 2025 and is projected to reach USD 16.84 billion by 2030, providing a sizeable opportunity for ink makers that master dispersion stability and low-temperature sintering. Consumer-electronics OEMs increasingly specify ink-based antennas and force-sensing resistors, paving a path for high-margin specialty grades within the broader digital inks market.
Restraints Impact Analysis of Digital Inks Market*
| Restraint | (~) % Impact on CAGR Forecast | Geographic Relevance | Impact Timeline |
|---|---|---|---|
| Volatility in Pigment and Raw-Material Prices | -0.8% | Global, with highest impact in price-sensitive markets | Short term (≤ 2 years) |
| Stringent Global VOC-Emission Regulations on Solvent Inks | -0.6% | Europe and North America leading, expanding globally | Medium term (2-4 years) |
| Durability Issues on Polyester and Blended Substrates | -0.4% | APAC textile manufacturing regions | Medium term (2-4 years) |
| Source: Mordor Intelligence | |||
Volatility in Pigment and Raw-Material Prices
Titanium dioxide and specialty organic pigments account for a high proportion of ink-making costs, and price swings driven by tariffs on Chinese and Mexican imports compress profit margins throughout the value chain. Specialty chemicals suppliers face geopolitical disruptions that ripple into inconsistent lead times and hedging difficulties, compelling ink formulators to consider dual-sourcing and index-linked contracts. Print service providers (PSPs) add cost surcharges or adopt lighter coverage designs to protect margins, though these tactics face resistance in price-sensitive advertising and textile segments. Working-capital intensity rises as firms hold safety stock to buffer uncertainty, raising barriers for smaller market entrants.
Stringent Global VOC-Emission Regulations on Solvent Inks
North American states such as Washington are proposing outright bans on specific solvent-based formulations, while Europe advances the Circular Economy Action Plan that elevates consumer-safety thresholds on potential carcinogens. Material registries under the Toxic Substances Control Act introduce additional paperwork and pre-notification cycles that stretch time-to-market. India’s toluene prohibition for food-contact inks and China’s GB 4806.14-2023 framework echo similar constraints in Asia, underscoring the global scope of compliance pressure. Investments in solvent-free pilot lines and analytical validation labs temper smaller firms’ competitiveness, reinforcing market consolidation tendencies in the digital inks market.
*Our forecasts treat driver/restraint impacts as directional, not additive. The impact forecasts reflect baseline growth, mix effects, and variable interactions.
Digital Inks Market Segment Analysis
By Ink Type:
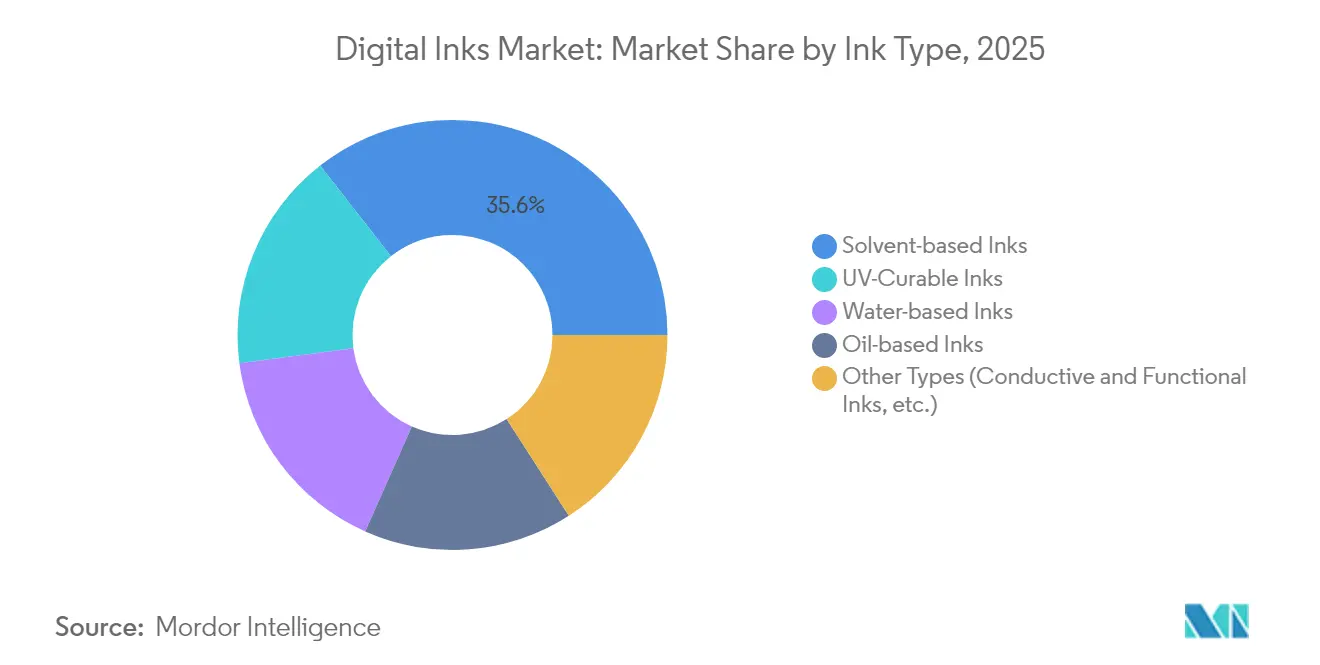
Solvent Systems Face Regulatory HeadwindsSolvent-based inks commanded 35.55% of 2025 revenue, yet the digital inks market size attached to UV-curable grades is forecast to outpace at a 6.86% CAGR through 2031. Performance advantages include on-press curing within seconds and negligible VOC content, which align with packaging converters’ push for leaner workflows and food-safety assurance. Water-based pigments accelerate in label and flexible-pouch formats as low-odor characteristics allow presses to run inside populated production halls without extraction upgrades. Niche oil-based systems remain relevant for thermoplastic substrates that demand elevated film-forming temperatures and lubricant functionality, though volume prospects stay limited.
A separate opportunity unfolds in conductive and other functional inks, where graphene-rich formulations achieve conductivities approaching 7.3 × 10⁵ S/m while retaining 800% stretchability, making them attractive for medical patches and bendable circuitry. European directives phasing out mineral oils amplify strategic urgency for greener alternatives, prompting suppliers to test bio-sourced diluents that match drying speeds and color vibrancy. As compliance deadlines tighten, solvent lines risk market share attrition, whereas UV-curable and water-based chemistries advance toward mainstream status inside the digital inks market.

By Printing Technology:
Drop-on-Demand Dominance Faces CIJ ChallengeDrop-on-demand (DOD) architecture held 54.60% share in 2025 and continues to define the digital inks market through nozzle refinement that yields native 2-picolitre droplets and resolutions surpassing 1,200 dpi. Reliability improvements such as recirculating head manifolds cut downtime and support low-viscosity aqueous chemistries, broadening addressable substrates from uncoated paper to rigid plastics. Continuous inkjet (CIJ) systems, historically rooted in coding and marking, now integrate dual-frequency deflection to print variable data at line speeds above 400 m/min, giving the segment a projected 7.18% CAGR. UV inkjet bridges high-opacity white under-printing on metals and glass, thereby encroaching on screen-printing share in industrial décor.
Recent investments underline future momentum. Epson’s 5.1 billion-yen Tohoku facility, scheduled to come online by September 2025, will quadruple annual PrecisionCore printhead output, ensuring secure supply for expanding OEM partnerships. Hybrid platforms that marry flexographic priming stations with inline inkjet modules cater to converters balancing cost-per-square-meter efficiency and SKU proliferation. Collectively these dynamics ensure printing-technology innovation remains a decisive factor in sustaining the digital inks market expansion.
By Application:
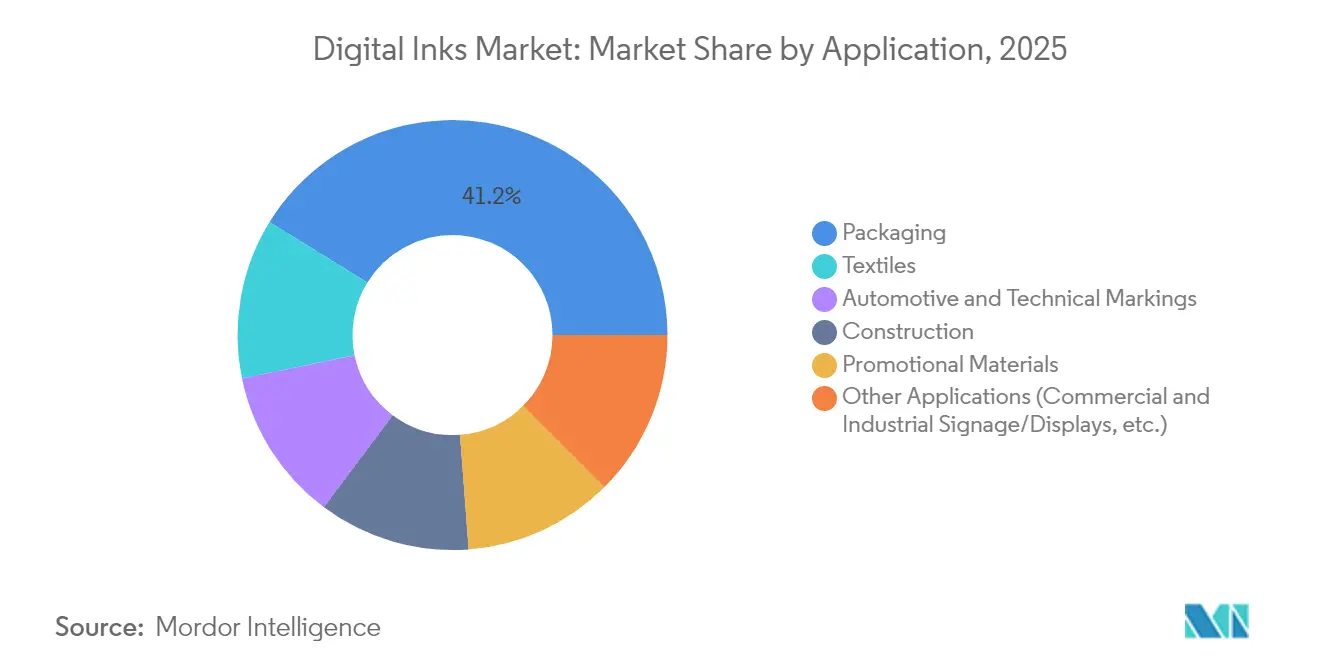
Packaging Dominance Amid Textile AccelerationPackaging accounted for 41.20% of 2025 consumption thanks to e-commerce fulfillment models and brand mandates for serialized anti-counterfeiting codes. Variable-data capabilities lower plate costs, making digital attractive for run lengths below 10,000-linear-meters in corrugated and folding carton formats. Automotive and aerospace markets specify high-temperature-resistant inks for under-hood and cabin trim, yet remain niche by volume. Construction material branding requires UV-stable pigments for exterior cladding and vinyl siding.
The other applications segment—which spans commercial signage, industrial displays, décor panels, and emerging interactive surfaces—expanded at a 7.22% CAGR from 2025 and is projected to retain the fastest trajectory among all verticals through 2031, lifting its slice of the digital inks market size as converters shift short-run graphics from solvent screen presses to high-speed UV inkjet systems. Performance gains stem from ultra-adhesive formulations that bond to glass, metal, and polycarbonate without primers, enabling durable storefront graphics, transit wraps, and factory safety placards that weather UV exposure and chemical washdowns. Variable-data capabilities also allow quick revisions for seasonal promotions and regulatory signage, trimming waste and inventory.
Geography Analysis
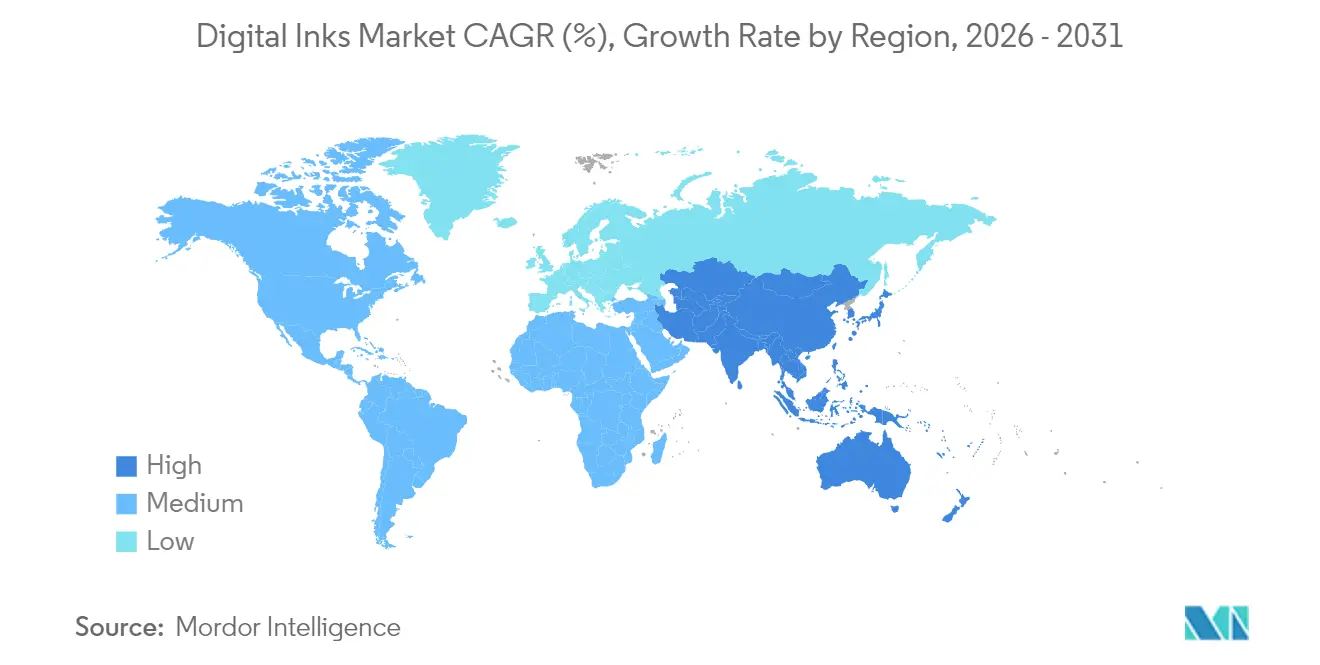
APAC Digital Inks Market
Asia-Pacific controlled 48.10% of the digital inks market in 2025 and is projected to advance at 6.95% CAGR through 2031. China anchors regional momentum with expansive corrugated and electronics production, while Japan delivers high-precision components and growing installation bases for textile and industrial printers. India accelerates capacity investments, illustrated by DIC India’s INR 1.1 billion facility in Gujarat producing toluene-free liquid inks . South Korea and Taiwan leverage electronics manufacturing know-how to expand conductive ink adoption in display and sensor applications. ASEAN economies such as Vietnam benefit from garment export booms that trigger demand for low-water textile printing.
North America Digital Inks Market
North America remains an innovation hub where regulatory leadership nudges rapid uptake of UV-curable and eco-solvent chemistries. The United States’ vibrant e-commerce sector stimulates on-demand packaging growth, fostering press installations around omnichannel fulfillment centers. Canada and Mexico supply resins and pigments but face tariff-driven cost variability, prompting contingency sourcing and localized blending strategies. INX International’s USD 1.6 billion annual sales underscore the region’s industrial depth and R&D commitment in the digital inks market
EMEA and South America Digital Inks Market
Europe shapes global standards through early adoption of circular-economy policies that mandate recyclable materials and low-toxicity formulas. Germany’s engineering heritage underpins equipment advances, while France channels policy instruments to eliminate mineral-oil-based inks in food packaging. Nordic innovation focuses on biodegradable binders derived from lignin and tall oil, aligning with forestry-rich economies. Italy reinforces leadership in fashion print applications, and the United Kingdom sustains strength in label and specialty graphics. Although Russia faces trade constraints, domestic demand persists for industrial marking inks, while Eastern Europe grows as a near-shore production base. South America and Middle East and Africa, though smaller by value, reveal double-digit local growth where infrastructure modernizes and foreign direct investment funds flexible packaging and textile print clusters.
Regulatory Landscape
Regulation for digital inks increasingly focuses on chemical safety, food-contact compliance, and documentation across the packaging value chain. This is accelerating reformulation away from higher-VOC and higher-concern substance classes. In Europe, printing inks used in food-contact materials fall under the broader EU food-contact materials framework, and industry guidance plus GMP programs are used to operationalize compliance where ink rules are not harmonized. The European Printing Ink Association (EuPIA) updated its Good Manufacturing Practice (GMP) to a 5th version (published November 2025) and began implementation in January 2026, along with a 2026 EuPIA Charter for raw material selection that tightens expectations on upstream selection and downstream communication.
Switzerland provides a more specific compliance anchor for ink layers in food packaging. The revised Swiss Ordinance on Materials and Articles in contact with Food (SR 817.023.21) entered into force in February 2026 and includes specific Declaration of Compliance (DoC) requirements for printing ink layers, not limited to direct food contact, raising expectations for traceability and supplier declarations. PFAS restrictions are also moving from emerging concern to packaging-rulemaking, with EuPIA issuing an April 2026 information note on PFAS and printing inks in the context of the EU Packaging and Packaging Waste Regulation (PPWR). As PPWR provisions restricting PFAS in food-contact packaging intensify, suppliers face greater need for documented PFAS status and substance-of-concern screening in ink and coating formulations.
Value Chain Analysis
The digital inks value chain starts with upstream specialty chemicals and colorant inputs, including pigments and dispersions (for example phthalocyanine and quinacridone grades), resins and binders (acrylic, polyurethane), solvents or reactive diluents, and performance additives such as humectants, surfactants, and defoamers. Formulators convert these inputs into ink systems engineered for printhead compatibility (viscosity, surface tension, filtration, and stability) and application needs, including adhesion, abrasion, lightfastness, and low migration for packaging. Qualification by printer OEMs and printhead platforms is a midstream gate that often requires extended technical validation before commercialization, which raises switching costs and slows substitution.
Downstream, inks flow through OEM channels, distributors, and direct supply to converters and print service providers across packaging, textiles, and industrial graphics. Logistics and working-capital demands have become more visible constraints: in March 2026, EuPIA noted that rerouting shipping around the Cape of Good Hope extended transit times for chemical feedstocks and raw materials for printing inks by about 10 to 14 days. This pushed buyers to carry more safety stock and revisit sourcing, while the same period included multiple suppliers announcing price actions tied to energy and logistics disruptions. Contract structures are increasingly incorporating escalation clauses, dual sourcing, and localized blending where feasible to protect continuity for qualified ink sets.
Competitive Landscape
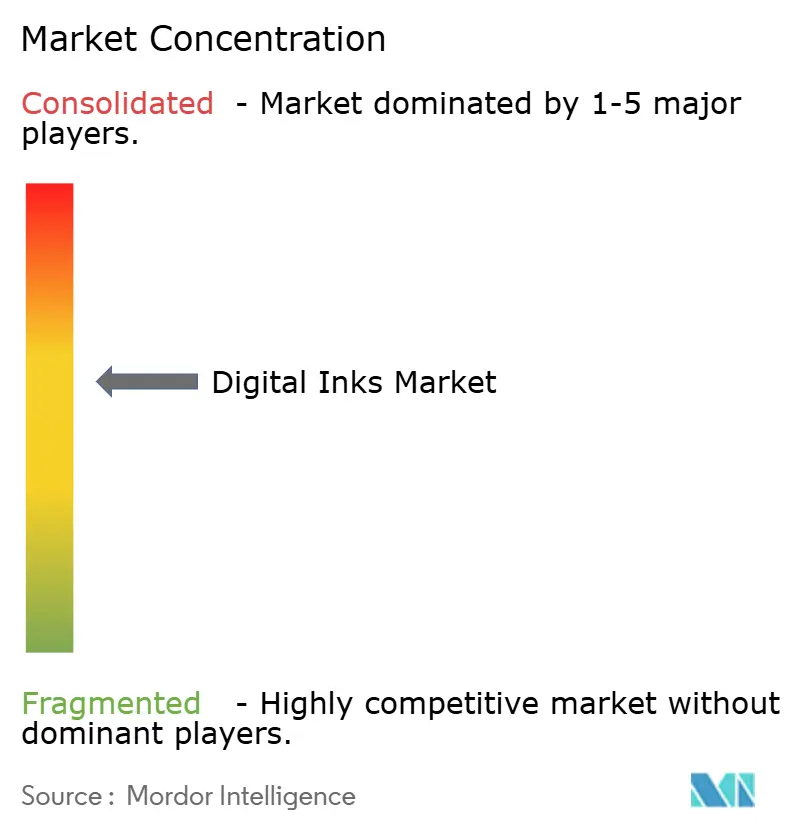
Digital ink manufacturing displays moderate concentration, with leading players pursuing vertical integration to secure pigment supply, formulate bespoke chemistries, and embed analytics across production lines. INX International exemplifies this strategy, channeling USD 68.5 million during 2024-2025 into AI analytics firm Oden Technologies and predictive-maintenance specialist AssetWatch to lift plant availability and cut changeover times by 71%[2]. Technology-oriented entrants exploit white-space in conductive nano-inks, with E Ink unveiling low-power electrophoretic modules that function from –20 °C to 65 °C and target outdoor digital signage.
Mergers and acquisitions remain a lever for scale and portfolio breadth: Xerox’s USD 1.5 billion purchase of Lexmark repositions the combined entity among the top five print-solution providers while increasing exposure to the Asia-Pacific region. Patent depth grows in importance as companies license printhead architectures and rheology modifiers; Wacom’s library of 3,000+ filings offers defensible linkage between digital pen ecosystems and ink rende. Technology-oriented entrants exploit white-space in conductive nano-inks, with E Ink unveiling low-power electrophoretic modules that function from –20 °C to 65 °C and target outdoor digital signage
Pricing discipline tightens under raw-material inflation, pushing top suppliers to negotiate volume-based rebates with pigment makers and to rationalize SKUs toward high-margin specialty lines. Service models evolve toward subscription-based ink delivery, remote diagnostics, and color management expertise, creating annuity revenues beyond the initial press sale. Collectively, these maneuvers sustain moderate rivalry while yielding incremental consolidation within the digital inks market.
Digital Inks Industry Leaders
-
Sun Chemical (DIC Corporation)
-
FUJIFILM Speciality Ink Systems Limited
-
Siegwerk Druckfarben AG & Co. KGaA
-
Flint Group
-
INX International Ink Co
- *Disclaimer: Major Players sorted in no particular order
Digital Inks Market Companies Covered in this Report
- Artience Co., Ltd.
- ATLANTA
- Brother Industries, Ltd.
- Canon Inc.
- DIC Corporation
- DuPont
- Epson India Pvt Ltd.
- Flint Group
- FUJIFILM Speciality Ink Systems Limited
- HP Development Company, L.P
- INX International Ink Co.
- Kornit Digital
- Marabu GmbH & Co. KG
- MIMAKI ENGINEERING CO., LTD.
- Nazdar
- Ricoh UK Products Limited.
- Siegwerk Druckfarben AG & Co. KGaA
- Wikoff Color Corporation
Market Opportunities and Future Outlook
A clear opportunity area is compliance-led reformulation for packaging and labels. Portfolios that can document low-migration, low-VOC, and PFAS-aware formulations help converters manage food-contact and packaging requirements. The February 2026 entry into force of the revised Swiss food-contact ordinance (SR 817.023.21), including Declaration of Compliance requirements for printing ink layers, creates direct demand for more complete value-chain documentation and disciplined raw material selection. It also aligns with EuPIA GMP implementation starting in January 2026 and EuPIA guidance on PFAS in the context of PPWR (April 2026). Suppliers that position product lines around substance-of-concern reduction (for example removing initiators and classes such as PFAS and phthalates) and faster-curing UV/LED systems can pair regulatory files with printhead-ready performance.
Capacity additions and portfolio scale-up point to active whitespace in industrial UV/UV-LED and aqueous digital inks for packaging substrates, alongside high-speed inkjet architectures. In May 2026, Tritron GmbH invested EUR 9.4 million in a new Ink-Cube production facility in Germany to double capacity for UV and UV-LED industrial digital printing inks. Sun Chemical also announced a USD 10 million investment (February 2026) to expand quinacridone pigment production at its Newport, Delaware facility, supporting continuity for a critical colorant used across multiple ink systems. In India, consolidation and local capacity build-outs are sharpening competitive intensity for packaging inks and adjacent digital platforms, including Siegwerk completing the acquisition of Hi-Tech Inks in June 2026 to form a scaled flexible packaging inks business in the country. Collectively, these moves support opportunities around localized supply, faster qualification support, and ink sets tailored to recyclable mono-material and fiber-based packaging as converters redesign structures.
Recent Industry Developments in Digital Inks Market
- April 2026: Sun Chemical introduced Streamline Kashu, an aqueous pigment ink designed for paper, poster, and corrugated printing, at FESPA 2026. The launch broadens Sun Chemical's water-based digital portfolio for packaging-adjacent and display applications where odor and VOC profiles matter, while targeting compatibility with modern industrial inkjet workflows.
- October 2025: Sun Chemical launched Streamline Toccata aqueous ink technology for poster and corrugated display applications. Expanding aqueous options supports printers shifting work from solvent systems into lower-VOC ink sets and aligns with short-run, high-mix graphics demand in retail and e-commerce-related packaging displays.
- September 2024: DuPont introduced the Artistri PN1000 digital ink series, a water-based pigment inkjet ink engineered with low viscosity for commercial printing and designed to work with standard drying systems. The release strengthened the supplier landscape for aqueous pigment inks, which are increasingly used to meet regulatory and workplace exposure requirements alongside performance targets.
Digital Inks Market Report Scope and Research Methodology
Market Definition and Coverage
This market covers revenues earned from digital ink formulations used in digital printing systems, where ink is deposited by controlled printheads onto substrates for decoration, marking, coding, or functional printing across major end uses.
Scope exclusions: We exclude conventional analog printing inks used mainly in flexography, gravure, offset, and other non-digital processes.
Segments Covered in This Report
- By Ink Type
- Solvent-based Inks
- Water-based Inks
- UV-Curable Inks
- Oil-based Inks
- Other Types (Conductive and Functional Inks, etc.)
- By Printing Technology
- Drop-on-Demand Inkjet
- Continuous Inkjet (CIJ)
- UV Inkjet
- Digital Screen Printing
- Other Technologies (Hybrid inkjets, etc.)
- By Application
- Packaging
- Automotive and Technical Markings
- Construction
- Promotional Materials
- Textiles
- Other Applications (Commercial and Industrial Signage/Displays, etc.)
- By Geography
- Asia-Pacific
- China
- Japan
- India
- South Korea
- ASEAN Countries
- Rest of Asia-Pacific
- North America
- United States
- Canada
- Mexico
- Europe
- Germany
- United Kingdom
- France
- Italy
- Spain
- Russia
- NORDIC Countries
- Rest of Europe
- South America
- Brazil
- Argentina
- Rest of South America
- Middle East and Africa
- Saudi Arabia
- South Africa
- Rest of Middle East and Africa
- Asia-Pacific
Data Sources, Market Sizing, and Validation
Desk Research
Desk work starts with building a clean view of the demand pool, then checking it against trade and production signals. We referenced public sources such as US Census Bureau manufacturing and trade tables, Eurostat industrial statistics, UN Comtrade customs data, and national environmental agencies that publish VOC and chemical-use guidelines affecting ink choices.
Industry context was added using sources such as patent databases, peer-reviewed journals on inkjet materials and curing chemistry, and association websites connected to printing and packaging. We also reviewed company filings, earnings decks, and press coverage to understand capacity changes, new product ramps, and regional mix shifts. When needed, paid subscriptions for company financials and shipment-level import and export reads were used to cross-check exposure to digital inks. These examples are not exhaustive, and many other public sources were used for data collection, validation, and clarification.
Primary Interviews and Surveys
Primary work was used to pressure-test what desk research could not fully show, especially pricing movement, product-mix shifts, and how demand differs by printing technology and substrate. We spoke with ink producers, raw material participants, printer and equipment ecosystem contacts, converters, and end users across APAC, EMEA, and the Americas so the model assumptions could be adjusted where real buying patterns did not match headline production data.
Distribution of primary research fieldwork respondents
| Company type | Respondent position | Region |
|---|---|---|
| Top tier: 39% | CXOs: 15% | APAC: 47% |
| Mid tier: 43% | Functional/Unit leaders: 28% | EMEA: 30% |
| Smaller Players: 18% | Managers: 57% | Americas: 23% |
Market-Sizing & Forecasting
Sizing is built using top-down and bottom-up logic in a practical way. The top-down view reconstructs value from printing activity by application and technology, then converts it into ink demand using typical ink consumption factors, digital printing penetration by substrate, and average selling prices that vary by formulation and region.
To keep the totals realistic, we corroborate with selective bottom-up approximations such as supplier revenue splits, sampled price points from channel discussions, and volume direction checks from import and export signals where inks are traded. Key inputs used in the model include packaging print run trends, textile digital print adoption, UV-curable share movement, regional manufacturing output, and observed price per liter changes by chemistry (water-based, solvent-based, UV-curable) as it feeds into realized ASP.
For the forecast, scenario analysis was used, supported by expert views on drivers like regulation-led shifts away from high-solvent systems, equipment installed base growth, and substrate mix changes. When bottom-up data is sparse in smaller countries, we bridge gaps using proxy indicators such as packaging output and textile activity, followed by peer-market normalization so outliers do not overstate demand.
Data Validation & Update Cycle
Outputs are checked through multiple passes so the story matches the numbers. We compare implied ink consumption and implied price levels against independent signals, and anomalies are reviewed until a clear reason is documented, such as a one-time price spike or a sharp mix change toward UV-curable inks.
Assumptions are then reviewed by another analyst, followed by a final sign-off review that focuses on year-on-year movements by region and application so there are no hidden jumps. The report is refreshed annually, and interim updates are triggered when material events occur, such as major capacity additions, sharp currency moves, or a regulation change that affects solvent use. Before delivery, a fresh validation pass is done so clients receive the latest updated view.
Mordor Intelligence's Digital Ink Market Estimate Compared With Other Published Estimates
It is normal to see different market sizes for digital ink because each publisher draws the boundary differently and also updates key assumptions on a different schedule. The biggest spread usually comes from what is counted as digital ink revenue, how pricing is converted into USD, and whether the latest pricing and mix signals are reflected.
A refresh-led gap is common in this market since ASPs move with raw material costs, energy, and currency timing, and the mix between water-based, solvent-based, and UV-curable inks can shift within a year. The comparison below reflects how updates to FX conversion timing, the way realized ASP is modeled by formulation and region, and how quickly assumptions are re-validated through new interviews can move the final figure, which is why the 2026 value in Mordor Intelligence aligns tightly to its stated study-year refresh and validation checks.
Benchmark comparison
| Source | Market Size | Gaps in Research Methodology |
|---|---|---|
| Mordor Intelligence | USD 4.90 B (2026) | |
| Global Consultancy A | USD 4.00 B (2023) | Uses an earlier base year and a faster implied growth path, which can understate recent ASP and mix changes when translated into current dollars. Regional coverage is broader but is less explicit on how formulation-level pricing is refreshed versus held constant. |
| Industry Publisher B | USD 3.52 B (2024) | Anchors the market on a different base year and applies a longer forecast window, which can shift the 2026 run-rate depending on FX timing and whether UV-curable price premiums are carried through uniformly across regions. |
Reading the three numbers together, the gap is mainly explained by base-year choice and how quickly price and currency assumptions are updated after market moves. By keeping the scope tied to digital printing inks and re-checking formulation-level ASP and regional mix during the refresh cycle, our model stays traceable to clear inputs and can be repeated with the same steps as new data comes in.
Key Questions Answered in the Report
What is the current size of the digital inks market?
The digital inks market size is valued at USD 4.9 billion in 2026, reflecting steady adoption across packaging, textiles, and industrial printing.
Which segment is growing fastest in the digital inks market?
UV-curable inks register the highest forecast growth at a 6.86% CAGR through 2031, propelled by instant curing and low-VOC benefits.
Why are conductive nano-inks important?
Conductive nano-inks enable printed electronics such as wearable sensors and smart packaging, creating a USD 2.31 billion sub-market opportunity by 2031.
How does regulation affect solvent-based inks?
Stricter VOC-emission standards in North America and Europe force suppliers to reformulate or shift to eco-solvent and water-based systems, reducing solvent ink share.
Which region leads the digital inks market?
Asia-Pacific holds 48.10% of market revenue thanks to manufacturing scale in China, precision engineering in Japan, and textile digitalization in India.