
Digital Fitness Apps Market Size and Share
Market Overview
| Study Period | 2020 - 2031 |
|---|---|
| Market Size (2026) | USD 15.35 Billion |
| Market Size (2031) | USD 28.30 Billion |
| Growth Rate (2026 - 2031) | 13.01% CAGR |
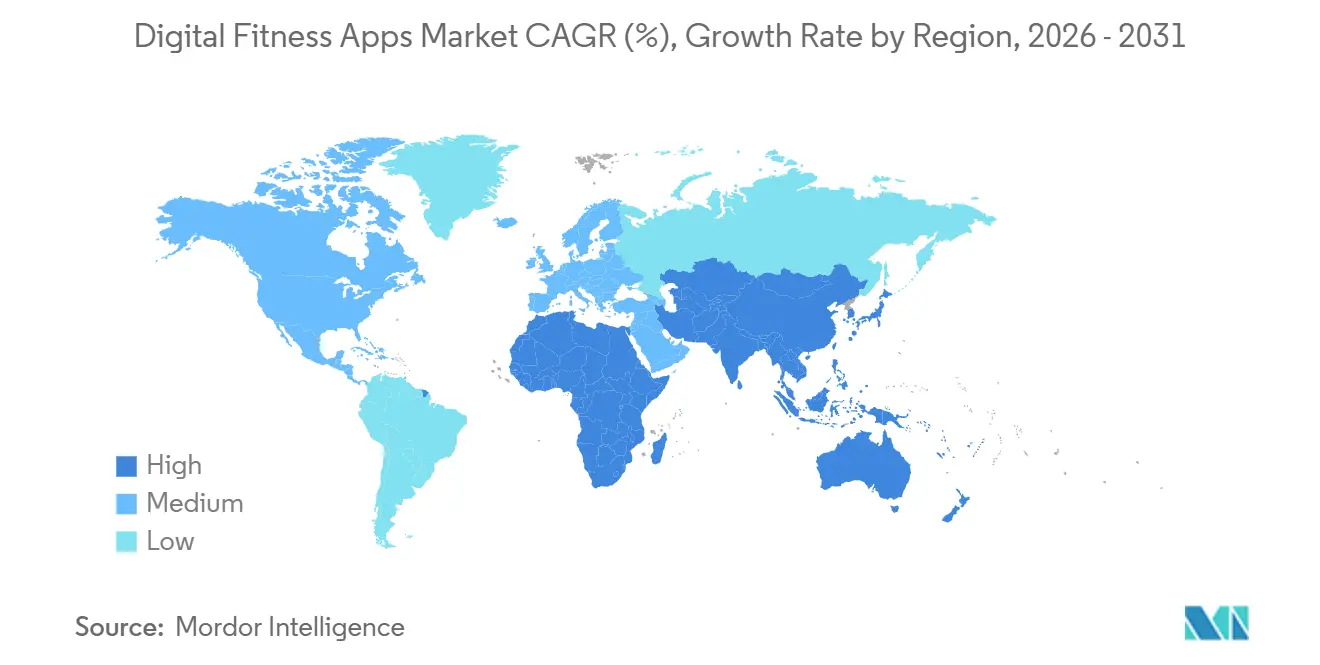
| Fastest Growing Market | Asia Pacific |
| Largest Market | North America |
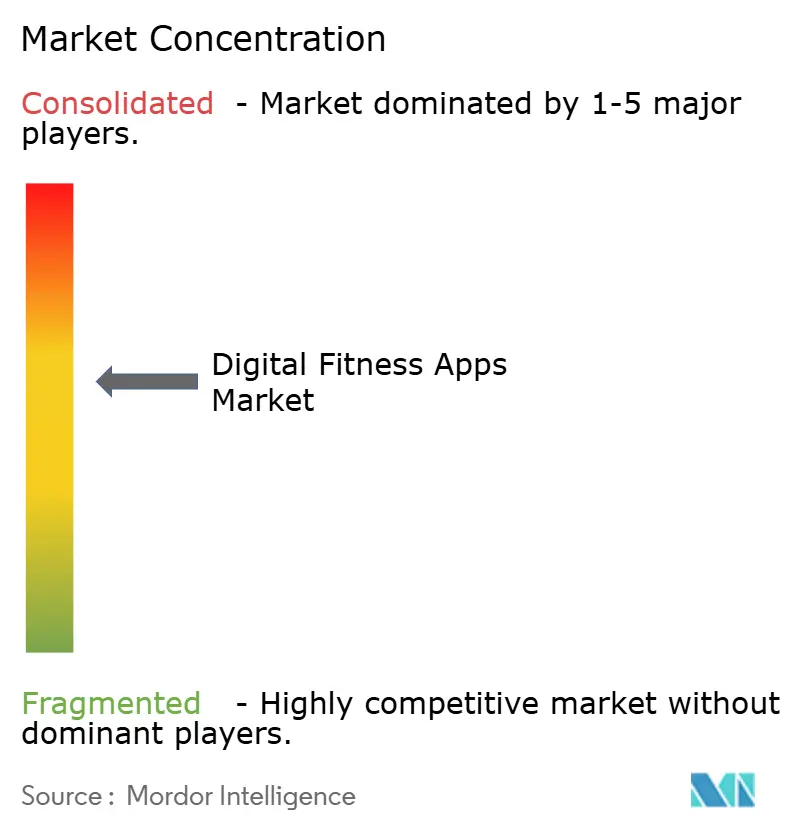
| Market Concentration | Medium |
Major Players *Disclaimer: Major Players sorted in no particular order Image © Mordor Intelligence. Reuse requires attribution under CC BY 4.0. | |
Digital Fitness Apps Market Analysis by Mordor Intelligence
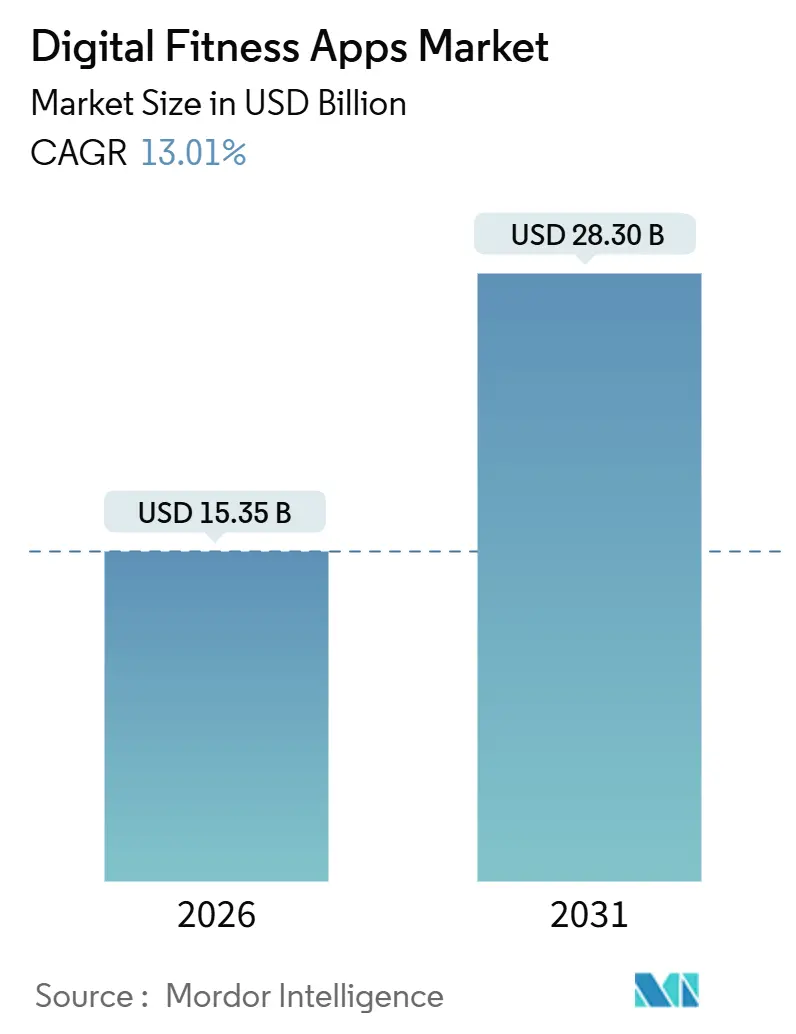
The digital fitness apps market size stands at USD 15.35 billion in 2026 and is projected to reach USD 28.30 billion by 2031, translating into a 13.01% CAGR over the forecast period. Continued alignment with GLP-1 weight-loss therapies, rapid advances in on-device AI voice coaching, and the steady expansion of employer-funded wellness benefits are repositioning digital apps from discretionary lifestyle add-ons to core preventive-health tools. Device makers that embed FDA-cleared sensors in watches, rings, and bands are deepening data pipelines that feed generative-AI models, improving real-time personalization and raising switching costs. In parallel, insurers and self-insured employers are underwriting premium subscriptions, cushioning developers from volatile consumer churn while tightening clinical-validation requirements. Heightened data-privacy scrutiny and rising acquisition costs temper momentum, yet sustained hardware penetration and drug-software convergence keep the digital fitness apps market on a doubling trajectory through 2031.
Key Report Takeaways
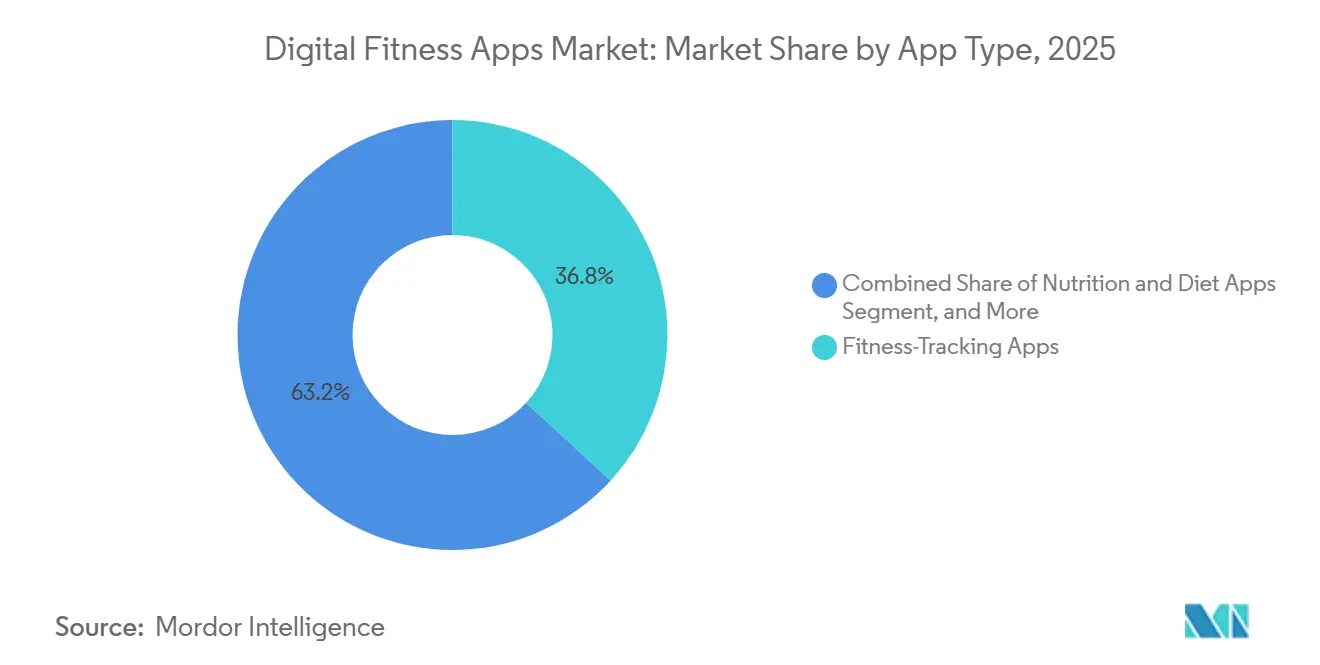
- By app type, fitness-tracking applications led with 36.83% revenue share in 2025, while fertility and contraception offerings are expanding at a 13.88% CAGR to 2031.
- By platform, iOS commanded 55.73% of the 2025 base, whereas wearable-OS native titles are advancing at a 14.67% CAGR through 2031.
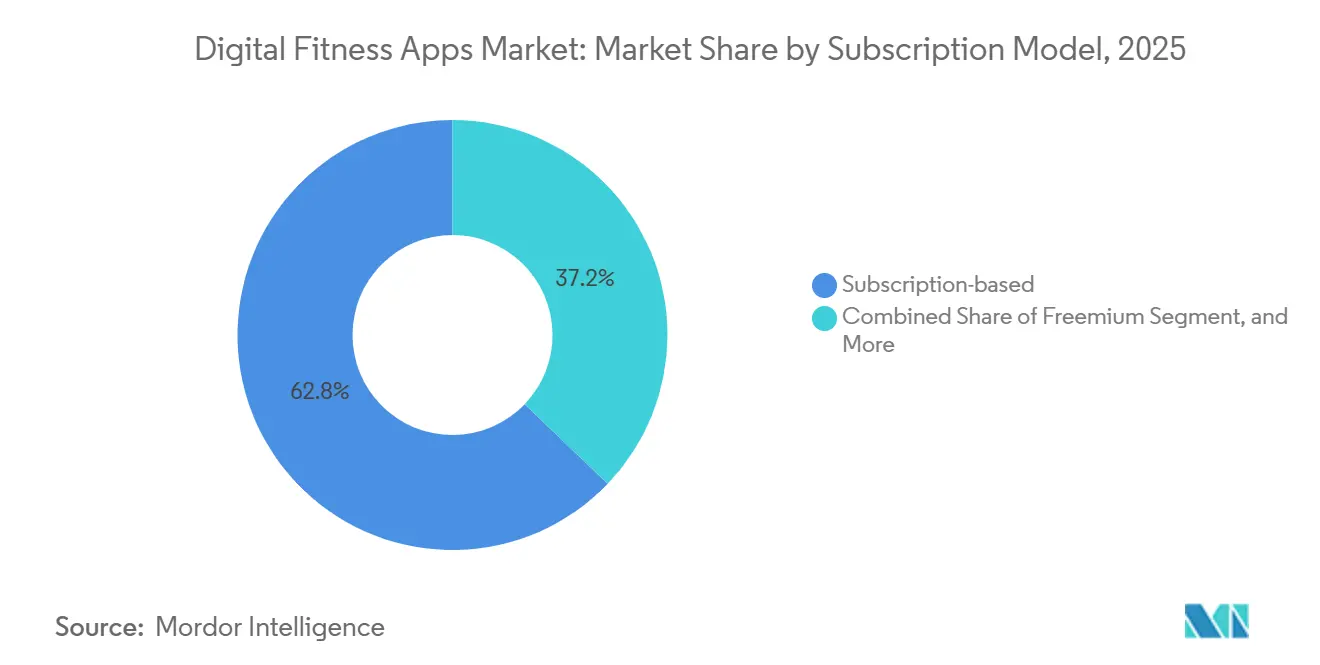
- By subscription model, subscription-based services represented 62.83% of 2025 revenue, yet freemium propositions are growing at 14.89% CAGR as acquisition efficiency erodes.
- By end user, individual consumers held 56.82% share in 2025, while healthcare providers and insurers post the fastest 14.78% CAGR as value-based-care reimbursement accelerates.
- By geography, North America captured 38.73% share in 2025, whereas Asia-Pacific is forecast to pace the field with a 14.66% CAGR to 2031.
Note: Market size and forecast figures in this report are generated using Mordor Intelligence’s proprietary estimation framework, updated with the latest available data and insights as of January 2026.
Global Digital Fitness Apps Market Trends and Insights
Drivers Impact Analysis*
| Driver | (∼) % Impact on CAGR Forecast | Geographic Relevance | Impact Timeline |
|---|---|---|---|
| GLP-1 weight-loss program integrations | +3.2% | North America, Europe, with early adoption in urban Asia-Pacific markets | Medium term (2-4 years) |
| Generative-AI voice-coach differentiation | +2.8% | Global, with premium-tier penetration in North America and Western Europe | Short term (≤ 2 years) |
| Rising insurer and employer incentives for app-based wellness | +2.5% | North America, Europe, with pilot programs in Japan and South Korea | Medium term (2-4 years) |
| Explosive smartphone and wearable penetration | +2.1% | Asia-Pacific core, with spillover to Middle East and Africa | Long term (≥ 4 years) |
| Gamification and social-fitness network effects | +1.3% | Global, with highest engagement in North America and Europe | Short term (≤ 2 years) |
| Elder-fitness demand from 55+ cohort | +1.1% | North America, Europe, Japan, with emerging interest in China | Long term (≥ 4 years) |
| Source: Mordor Intelligence | |||
GLP-1 Weight-Loss Program Integrations
Prescription therapies built on semaglutide and tirzepatide are being stitched into leading platforms, blending medication adherence tools with activity coaching. WeightWatchers began issuing GLP-1 prescriptions inside its app, funneling members to telehealth providers and streamlining home delivery. Apple Fitness+ added workout plans that sync to dosing schedules, mitigating muscle-loss risk flagged by endocrinologists. Omada Health expanded its reimbursed diabetes-prevention pathway to include GLP-1 support, shifting payment liability from users to insurers. Embedding pharmacotherapy elevates apps into hybrid care coordinators, lengthens engagement cycles well beyond the typical 90-day churn horizon, and unlocks insurer funding once confined to clinical visits.
Generative-AI Voice-Coach Differentiation
Large-language models are morphing static tutorials into two-way dialogues that adjust form, intensity, and rest intervals on the fly. WHOOP’s Coach leverages GPT-4 to parse overnight recovery data and issue real-time prompts during exercise. Fitbit’s Gemini integration adds conversational Q&A, grounding answers in peer-reviewed science.[1]Umar Shakir, “Fitbit Taps Gemini AI,” The Verge, theverge.com Strava’s Athlete Intelligence estimates race-day pacing using cohort comparisons. Voice interaction frees users from screen glances, narrows the gap with human trainers, and compresses coaching costs, all while generating granular behavioral datasets that enrich personalization engines.
Rising Insurer and Employer Incentives for App-Based Wellness
Payers are moving beyond passive reimbursement toward proactive subsidization. UnitedHealthcare now disburses up to USD 1,000 annually to members who hit activity milestones tracked via connected wearables. JPMorgan Chase covers Peloton and Calm subscriptions for 250,000 employees after observing a 12% drop in mental-health-linked absences. Aetna funds Noom’s diabetes-prevention program contingent on 16-week completion rates. Subsidies transfer cost risk away from consumers, expand enterprise licensing revenue, and create multiyear contracts that dampen churn, but they intensify demand for clinical validation and HIPAA compliance.
Explosive Smartphone and Wearable Penetration
Global smartwatch shipments hit significant growth in terms of units in 2024, a hardware surge feeding continuous data loops into apps. Apple Watch Series 10 gained FDA-cleared sleep apnea detection, reframing the device as a diagnostic-grade monitor.[2]Apple Newsroom Staff, “Apple Watch Series 10 Introduces Sleep Apnea Detection,” apple.com Samsung’s USD 399 Galaxy Ring offers all-day vitals tracking in a ring form factor, easing compliance among users who find wrist-wear obtrusive. Garmin revealed that 80% of its 2024 wearables synced data to third-party apps, underscoring the role of open APIs in app discovery. Deeper sensor reach enriches AI models, raises accuracy, and lowers friction, directly fueling retention and premium upsells.
Restraints Impact Analysis*
| Restraint | (∼) % Impact on CAGR Forecast | Geographic Relevance | Impact Timeline |
|---|---|---|---|
| Heightened data-privacy regulations (GDPR, DMA, ADPPA) | -1.8% | Europe (GDPR, DMA), North America (ADPPA proposals), with spillover to Asia-Pacific | Short term (≤ 2 years) |
| Post-pandemic app-fatigue and retention drop-off | -1.5% | Global, with most acute impact in North America and Europe | Short term (≤ 2 years) |
| Rising customer-acquisition costs on saturated ad channels | -0.9% | Global, with highest CAC inflation in North America | Medium term (2-4 years) |
| Accuracy gaps vs. clinical-grade wearables | -0.7% | Global, with regulatory scrutiny concentrated in North America and Europe | Medium term (2-4 years) |
| Source: Mordor Intelligence | |||
Heightened Data-Privacy Regulations
Regulators are tightening stewardship around sensitive health telemetry. The Irish Data Protection Commission fined Meta EUR 91 million (USD 98 million) in 2024 for mishandling fitness data. The European Union’s Digital Markets Act bars gatekeepers from auto-installing their own apps, forcing Apple and Google to compete on merit.[3]European Commission Directorate-General for Competition, “Digital Markets Act Takes Effect,” ec.europa.eu Proposed U.S. legislation would mandate explicit consent for data sharing, a hurdle that 40% of users decline when prompted. Compliance raises engineering overhead, complicates cross-platform personalization, and pushes subscale developers toward consolidation.
Post-Pandemic App-Fatigue and Retention Drop-Off
Initial lockdown-era download spikes proved fleeting. Thirty-day retention for most health apps fell to 3-8% in 2024. Day-1 stickiness hovers at 30-35%, sliding to sub-2% paid conversion within a month. Peloton’s connected-fitness subscribers slipped from 3 million in 2023 to 2.9 million by Q3 FY2024, prompting a USD 1.4 billion debt refinance and a strategic pivot toward content and corporate plans. Shrinking engagement windows compel front-loaded onboarding, yet overly aggressive prompts risk backlash, amplifying churn and rising CAC.
*Our forecasts treat driver/restraint impacts as directional, not additive. The impact forecasts reflect baseline growth, mix effects, and variable interactions.
Segment Analysis
By App Type: Regulatory Clearances Propel Fertility Apps
Fertility and contraception titles, while a smaller slice of the digital fitness apps market, are expanding at a 13.88% CAGR, outstripping the 36.83% 2025 dominance held by fitness trackers. Flo Health’s CE-marked ovulation engine lets European insurers reimburse subscriptions, while Natural Cycles’ FDA-cleared protocol drew 2.5 million paying users in 2024. Integration with temperature sensors on Apple Watch and Samsung Galaxy Ring boosts prediction accuracy toward 95%, aligning app outputs with clinical benchmarks. The digital fitness apps market size for fertility solutions deepens as employers roll these tools into fertility-benefit budgets, attaching subscription revenue to corporate wallets. Competitive intensity in generic trackers is prompting vendor consolidation, whereas regulatory pathways in fertility apps create defensible moats.
Clinical functionality is elevating reimbursement potential across other categories too. Nutrition apps tie GLP-1 taper programs to macro dashboards, while meditation brands such as Calm secure enterprise contracts by bundling stress-management metrics. Sleep and posture trackers leverage insurer programs that reward biometric milestones, extending user journeys beyond the typical 90-day horizon. Conversely, pure workout-log apps without clinical hooks struggle for differentiation against ecosystem giants that subsidize subscriptions with device sales. Overall, regulatory progression and medical-device alignment are reshaping the app-type hierarchy inside the digital fitness apps market.


By Platform: Native Wearable Operating Systems Extend Utility
iOS retained a 55.73% share in 2025, but watchOS and Wear OS instances are compounding at 14.67% through 2031 as processing shifts directly onto the wrist. Apple’s watchOS 11 Vitals app surfaces overnight HRV and respiratory-rate deviations, nudging users toward preventive behaviors without phone intervention. Google’s Wear OS 5 improved battery life by 20%, a threshold that turns multi-day tracking into reality for Android cohorts. Samsung’s Energy Score aggregates sleep, activity, and heart-rate signals into a readiness index, translating complex biometrics into a single actionable metric.
The digital fitness apps market share migrates alongside these OS trends because always-on sensors feed richer data to AI models, reinforcing personalization cycles that tether users to specific hardware lines. Non-native web apps lag, restricted by sensor permissions and absent background processing. For developers, building natively unlocks on-device inference and streamlines privacy compliance by keeping raw data local. Consequently, wearable-first roadmaps are increasingly central to monetization discussions inside the digital fitness apps industry.
By Subscription Model: Freemium Strategy Balances CAC Pressures
Subscription formats captured 62.83% of revenue in 2025, yet freemium cohorts are climbing at a 14.89% CAGR as acquisition costs jump 40-60% on saturated ad channels. Strava converts 1.7% of a 150 million user base into paid tiers, still generating USD 275 million in 2024 through value-added features such as segment leaderboards. MyFitnessPal’s 200 million downloads fuel an upsell funnel for its USD 80 annual plan, covering meal planning and macro analytics.
Digital fitness apps market size expansion relies on balancing free reach with infrastructure overhead. Enterprise licenses offer a hedge, with Cigna funding Headspace access for 16 million members and securing an 8% drop in mental-health claims. One-time-payment niches persist, but their limited cash flow constrains feature velocity. As CAC inflation persists, freemium economics that harvest behavioral data for AI engines are poised to dominate, especially for well-capitalized incumbents.
By End User: Healthcare Entities Expand Digital Prescriptions
Individual users still represented 56.82% of the 2025 base, yet healthcare providers and insurers are accelerating at 14.78% CAGR, positioning the channel as the long-term growth engine. UnitedHealthcare’s rewarded-steps model disbursed USD 1,000 per compliant member, proving that targeted incentives can shift actuarial outcomes. Omada Health’s per-member-per-month contracts now span 10 million covered lives, illustrating the scalability of clinical-grade digital therapeutics.
For the digital fitness apps market, provider adoption changes product-development calendars, foregrounding HIPAA compliance, interoperable EHR links, and randomized-control-trial evidence. Platforms that satisfy these hurdles enjoy multiyear contracts and reduced churn. Meanwhile, fitness studios leverage white-label apps to stay connected with members off-site, using Mindbody’s infrastructure across 60,000 locations. The dual tailwinds of insurer endorsement and enterprise wellness budgets anchor a durable end-user mix shift away from pure consumer playbooks.
Geography Analysis
North America retained 38.73% of 2025 revenue, powered by Medicare Advantage subsidies and employer mandates that weave digital subscriptions into benefits packages. U.S. seniors engage with SilverSneakers’ fall-prevention modules, while Apple Fitness+ populates its “Older Adults” library to capture the same reimbursement streams. Canada’s growth remains urban-centric due to patchy rural broadband, and Mexico’s expanding middle class is onboarding via mobile-first ecosystems.
Asia-Pacific is the fastest riser at a 14.66% CAGR through 2031. India and Indonesia leapfrog desktop computing, adopting mobile-centric health platforms that thrive on low-cost Android handsets. China’s WeChat Sports amassed 300 million monthly users by embedding activity feeds within an everyday super-app, and South Korea’s Samsung-led hardware dominance ensures pre-installation of Samsung Health on two-thirds of domestic devices. Emerging ASEAN markets such as Thailand and Vietnam gain momentum as 4G coverage widens and carrier billing unlocks paid-app conversion without credit cards.
Europe accounts for 22% of 2025 value, with Germany, the United Kingdom, and France driving 60% of regional spend. The Digital Markets Act levels the discovery field for midsize players by banning default installs, enhancing visibility for brands like Strava. Middle East and Africa trails due to data-cost frictions yet pockets of opportunity exist, notably Saudi Arabia’s USD 500 million Vision 2030 fund that underwrites telehealth pilots. South Africa’s carrier-bundled data packs that include fitness apps illustrate an emerging model for price-sensitive markets.

Regulatory Landscape
Digital fitness apps sit between consumer wellness features and regulated digital health, so claim wording and data handling are the main compliance levers. In the United States, the Food and Drug Administration (FDA) updated its General Wellness: Policy for Low Risk Devices guidance in January 2026, clarifying where low-risk wellness functionality can stay outside medical-device oversight, while medical-grade diagnostic claims pull products toward FDA regulation. This boundary is becoming more relevant as watch and ring makers embed FDA-cleared sensing capabilities (for example, sleep apnea detection on Apple Watch) and as apps add coaching features that can be interpreted as clinical guidance.
Privacy and cybersecurity obligations also shape product architecture and partner selection. In Europe, GDPR enforcement continues to elevate sensitivity around fitness and health telemetry, while the Digital Markets Act (DMA) changes distribution and default-app dynamics for gatekeepers, affecting how major ecosystems bundle or promote fitness services. In practice, app vendors face parallel scrutiny from consumer-protection bodies (for example, FTC Section 5 in the United States for deceptive data practices) and from health-data rules when operating with covered entities under HIPAA, which raises the compliance premium for insurer- and provider-funded deployments.
Value Chain Analysis
Upstream, the value chain depends on sensor and device ecosystems (smartwatches, rings, bands), operating systems (iOS, Android, watchOS, Wear OS), and connectivity layers that capture continuous biometrics. Midstream, digital fitness app developers ingest and normalize device-specific biosignals, apply analytics and AI coaching, and run identity, consent, and security controls, increasingly using on-device processing to reduce privacy exposure. Content and engagement inputs (workout libraries, music integration and licensing, community features) differentiate offerings, while app stores and OEM preloads remain important distribution gates.
Downstream, enterprise buyers (employers), insurers, and healthcare providers account for a larger share of paid adoption and add clinical workflow integration needs such as EHR-compatible formatting and auditability. Friction concentrates around inconsistent data formats across devices, higher security requirements, and validation demands that slow scaling for smaller developers. Hybrid models that connect apps to offline services (such as gym networks using member data to lower acquisition costs) extend the chain by blending digital engagement with physical fulfillment and local partnerships.
Competitive Landscape
Digital fitness apps remain moderately fragmented, yet device-ecosystem giants are tightening share. Apple bundles Fitness+ within an iOS walled garden and uses the A18 chip for on-device inference that mitigates privacy concerns. Samsung courts clinical credibility through FDA-cleared sleep-apnea screening on Galaxy Watch and positions the Galaxy Ring for users who dislike wristwear. Alphabet integrates Gemini AI across Google Fit and Fitbit, marrying open APIs with premium AI nudges.
Specialists still carve defensible niches. WHOOP’s USD 30 monthly hardware-plus-software bundle eliminates upfront capex, winning serious athletes craving recovery analytics. Strava sustains network effects via 5.3 million annual group-challenge participants, and Zwift fuses cycling with gaming mechanics to triple retention relative to solo rides. White-space opportunities persist in elder-fitness content and chronic-care digital therapeutics, where Omada Health and Livongo pursue FDA pathways that many consumer apps avoid due to regulatory expense.
Pricing power correlates with proprietary sensors and clinical validation. Vendors without hardware stacks rely on open-platform data, which the Digital Markets Act threatens to limit. Midsize developers seek acquisition by hardware majors or insurers eager to own engagement touchpoints. The competitive equilibrium therefore oscillates between horizontal platform bundling and vertical integration that spans device, data, and content layers.
Digital Fitness Apps Industry Leaders
Apple Inc.
Alphabet Inc. (Google Fit)
Fitbit LLC (Google)
Nike Inc.
Adidas AG
- *Disclaimer: Major Players sorted in no particular order

Market Opportunities and Future Outlook
A major opportunity is the convergence of fitness engagement with clinically adjacent pathways that support third-party payment. Current market evidence includes insurer and employer subsidization programs, including UnitedHealthcare activity incentives and large employers funding premium subscriptions, which shift monetization from volatile consumer churn toward contract-based revenue. Those models also raise the bar for privacy controls, security posture, and measurable outcomes. Fertility and contraception apps provide a second proof point, where regulatory clearances can support defensible reimbursement channels through CE-marked and FDA-cleared approaches that move apps closer to regulated care.
Another whitespace is premium personalization built on AI and richer sensor streams, especially as wearable-OS native apps expand and as ecosystems consolidate data hubs. Google’s 2026 consolidation activity around Fitbit into a broader Google Health direction and Apple’s continued Fitness+ program expansion reflect platform investment in AI coaching, device-to-app telemetry, and subscription bundling. For smaller developers, opportunity centers on interoperable data layers (normalizing multi-device biosignals into enterprise-ready formats), privacy-forward architectures that reduce raw-data movement, and partnerships that fill capability gaps (such as music licensing, motion analysis, and secure infrastructure) without requiring full-stack ownership.
Recent Industry Developments
- May 2026: Transition of the Fitbit mobile application to the Google Health app with consolidation effective May 19, 2026. The transition consolidates health platforms and data interoperability. Strengthens Google Health ecosystem and user data ownership, intensifying competition with Apple Fitness+.
- May 2026: Launched the Fitbit Air, a screenless wearable tracker; pre-order started May 7, 2026; U.S. in-store availability May 26, 2026. The expansion of wearable hardware ties into a unified health app. Broadens product reach and improves wearable data capture for AI coaching within the Google Health ecosystem.
- May 2026: Rebranded Fitbit Premium to Google Health Premium, incorporating AI-powered Google Health Coach capabilities. The change creates a platform-level premium offering within the Google Health ecosystem. Deepens AI-driven personalization and engagement, reinforcing ecosystem stickiness against peers.


Research Methodology Framework and Report Scope
Market Definition and Coverage
This market covers revenue generated from consumer and employer-paid digital fitness apps that support exercise, coaching, tracking, or wellness programs on smartphones and connected devices, including paid subscriptions, in-app purchases, and advertising-led monetization where applicable.
Scope exclusions: We exclude pure hardware sales (wearables and home equipment) and in-person gym or studio memberships unless they are bundled and recognized as app revenue.
Segmentation Overview
- By App Type
- Fitness-Tracking Apps
- Nutrition and Diet Apps
- Meditation and Mind-wellness Apps
- Fertility and Contraception Apps
- Medication and Pill-Reminder Apps
- Other Wellness Apps (sleep, posture, etc.)
- By Platform
- iOS
- Android
- Web / Progressive-Web-App
- Wearable-OS Native (watchOS, Wear OS, etc.)
- By Subscription Model
- Freemium
- Subscription-based
- One-time Purchase
- Enterprise Licensing
- By End User
- Individual Consumers
- Corporate Wellness Programs
- Fitness Centres and Studios
- Healthcare Providers and Insurers
- By Geography
- North America
- United States
- Canada
- Mexico
- South America
- Brazil
- Argentina
- Rest of South America
- Europe
- Germany
- United Kingdom
- France
- Italy
- Spain
- Rest of Europe
- Asia-Pacific
- China
- Japan
- India
- South Korea
- ASEAN
- Rest of Asia-Pacific
- Middle East and Africa
- Middle East
- Saudi Arabia
- United Arab Emirates
- Rest of Middle East
- Africa
- South Africa
- Nigeria
- Rest of Africa
- Middle East
- North America
Data Sources, Market Sizing, and Validation
Desk Research
Desk research was used to set the market boundary, map how apps monetize, and build the first cut of regional demand. We relied on reputable public sources such as the World Health Organization, OECD health statistics, the US Centers for Disease Control and Prevention, and US FDA digital health guidance to understand fitness and wellness usage drivers, and the compliance signals that affect how wellness apps are positioned and sold.
To connect demand with paid outcomes, we reviewed app store category reporting and public commentary from mobile analytics, plus company filings, investor presentations, and press coverage that explain subscription pricing, churn, and product roadmaps. For fill-in checks, we used paid subscription sources that provide company financials and intelligence, news and financials, and patent databases to confirm funding cycles and feature innovation. These desk sources are illustrative rather than exhaustive, and other public datasets and documents were also used for data collection, validation, and clarification.
Primary Interviews and Surveys
Primary work focused on clarifying how revenue is recognized across subscription, freemium to paid conversion, and corporate wellness reimbursement. We used that input to correct desk-based assumptions and then confirm realistic price bands by region. Interviewees included product, growth, and partnership leaders, along with managers who track paid subscriber cohorts and retention, so the model could better match observed buying behavior across major geographies.
Distribution of primary research fieldwork respondents
| Company type | Respondent position | Region |
|---|---|---|
| Top tier: 25% | CXOs: 15% | APAC: 46% |
| Mid tier: 60% | Functional/Unit leaders: 37% | EMEA: 33% |
| Smaller Players: 15% | Managers: 48% | Americas: 21% |
Market-Sizing & Forecasting
Sizing starts with a top-down build where smartphone user pools, health and fitness app adoption, and paid conversion rates are applied by region, then translated into revenue using observed subscription price ranges and in-app purchase intensity. Once this demand pool is formed, we corroborate it with selective bottom-up approximations, such as sampled app publisher revenue disclosures, channel checks on corporate wellness contracts, and implied revenue from paid subscriber counts where available.
A few inputs that mattered in the model were active user and download momentum by app category, the share of freemium users upgrading to paid plans, annualized revenue per paying user, employer reimbursement penetration, and the mix shift between workout, nutrition, and mind-wellness usage. For forecasting, we used scenario analysis supported by expert views on retention trends, pricing resets, and the pace of employer benefit expansion, and then converted those scenarios into a single base case. Where bottom-up signals were missing for smaller geographies, gaps were handled through proxy markets with similar income and smartphone penetration, followed by a reasonableness check on implied spend per active user.
Data Validation & Update Cycle
Validation is done through cross-checking the model against independent signals, and then following up on outliers until the logic is consistent across regions and years. We compare outputs with app store spending indicators, public revenue disclosures, and user growth patterns. When anomalies show up, we run a second analyst review and re-contact select interviewees.
Reports are refreshed annually, and interim updates are made when material events change pricing, regulation, or demand patterns. Before delivery, a final analyst pass is completed so clients receive an updated view that reflects the latest available information.
Mordor Intelligence's Digital Fitness Apps Market Size Compared Against Other Published Estimates
Different publishers often land on different market sizes because they do not all count the same revenue streams, and some rely more heavily on broad app category totals instead of fitness-app specific monetization. Timing also matters because consumer spending can swing with seasonality, promotions, and short-term wellness trends.
App store in-app purchase revenue signals and download trends are used as external checks that keep Mordor Intelligence's estimate tied to paid fitness app monetization rather than the wider health app universe, and then the totals are reconciled to subscription and corporate wellness realities shared in interviews. In practice, the biggest gaps usually come from whether corporate wellness reimbursements are included, whether adjacent health tracking apps are counted, and how subscription price progression is handled across regions and currencies.
Benchmark comparison
| Source | Market Size | Gaps in Research Methodology |
|---|---|---|
| Mordor Intelligence | USD 15.35 B (2026) | |
| Industry Research Outlet A | USD 8.51 B (2025) | Uses an earlier base year and a broader digital fitness label that can undercount corporate wellness funded subscriptions, and it may apply simpler price ladders that do not reflect regional plan mix and discounting. |
| Market Bulletin B | USD 9.85 B (2024) | Measures a wider health and fitness app space with unclear revenue coverage, which can mix fitness apps with adjacent health tracking, and it does not clearly show how IAP-only reporting is separated from full subscription revenue. |
Across the three numbers, most of the spread can be explained by scope boundaries and the year used for the starting point, followed by how paid conversion and pricing are carried forward. By anchoring the model to observable app economy signals and validating the revenue build with practitioner feedback, the final estimate stays traceable to a repeatable set of inputs.


Key Questions Answered in the Report
How large is the digital fitness apps market in 2026?
The market is valued at USD 15.35 billion in 2026 and is on track to reach USD 28.30 billion by 2031.
What CAGR is expected for digital fitness apps through 2031?
The sector is forecast to expand at a 13.01% CAGR during 2026-2031.
Which app category is growing fastest?
Fertility and contraception apps are rising at a 13.88% CAGR, supported by regulatory clearances that unlock insurance reimbursement.
Why are insurers and employers funding subscriptions?
Evidence of reduced healthcare claims has led payers such as UnitedHealthcare and corporates like JPMorgan Chase to subsidize premium fitness, nutrition, and mental-wellness apps.
What role do GLP-1 drugs play in app adoption?
Integrations with semaglutide and tirzepatide protocols extend user engagement, shift costs to insurers, and create hybrid care models that bundle medication with behavioral coaching.
Page last updated on:






