
Digital Fault Recorder Market Size and Share
Market Overview
| Study Period | 2020 - 2031 |
|---|---|
| Market Size (2026) | USD 2.21 Billion |
| Market Size (2031) | USD 3.11 Billion |
| Growth Rate (2026 - 2031) | 7.12 % |
| Fastest Growing Market | Asia Pacific |
| Largest Market | North America |
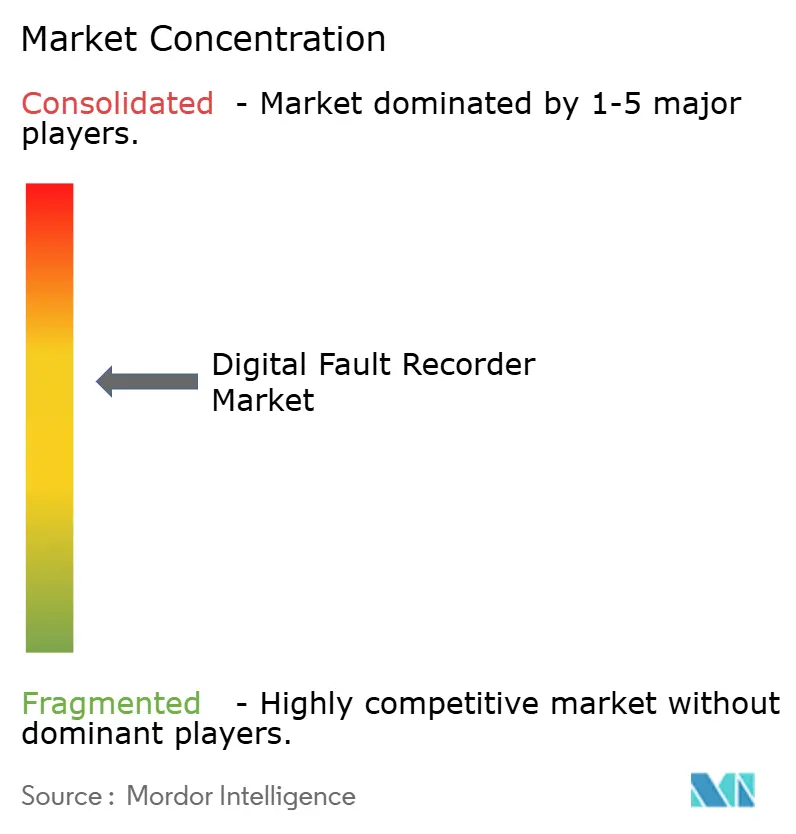
| Market Concentration | Medium |
Major Players
*Disclaimer: Major Players sorted in no particular order Image © Mordor Intelligence. Reuse requires attribution under CC BY 4.0. |
|
Digital Fault Recorder Market Analysis by Mordor Intelligence
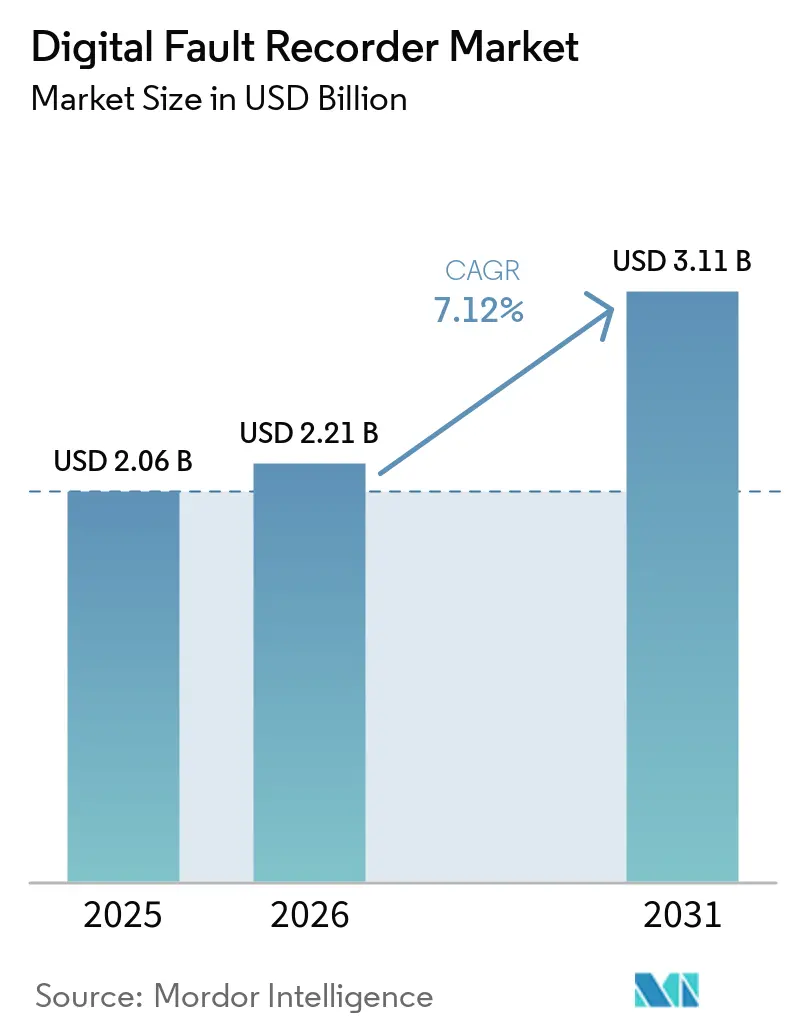
The Digital Fault Recorder Market size is expected to grow from USD 2.06 billion in 2025 to USD 2.21 billion in 2026 and is forecast to reach USD 3.11 billion by 2031 at 7.12% CAGR over 2026-2031. Growth momentum is tied to record-high grid-modernization budgets, expanding renewable penetration, and strict compliance mandates that push utilities toward real-time disturbance monitoring capabilities that traditional electromechanical devices cannot deliver. Utilities across North America and Europe are drawing on multi-billion-dollar public funding programs to replace aging assets, while Asian network operators accelerate ultra-high-voltage roll-outs to move renewable power over long distances. Heightened power-quality expectations from hyperscale data centers add a new demand stream, and the move to IEC 61850 process-bus architectures cements interoperability as a core purchase criterion. Cost pressures from semiconductor shortages and copper inflation persist, but buyers are prioritizing life-cycle value and analytics readiness over lowest first cost, maintaining steady order pipelines for both dedicated and multifunction platforms.
Key Report Takeaways
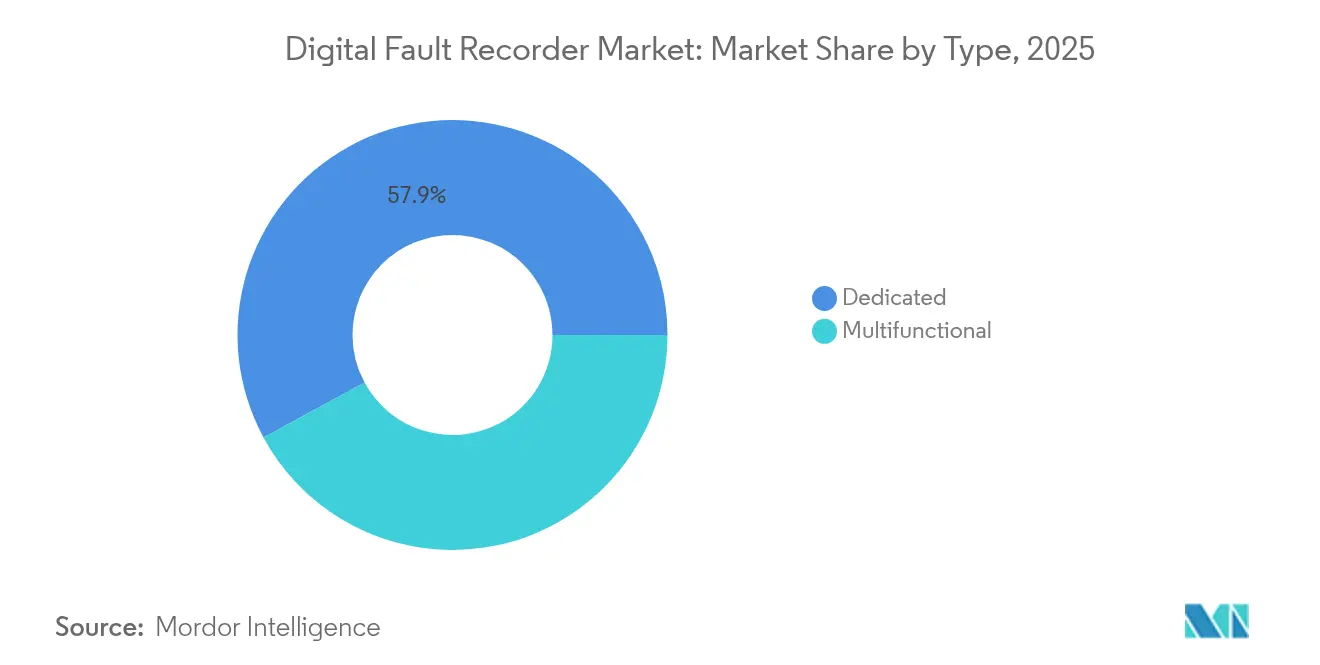
- By type, dedicated recorders led with 57.90% revenue share in 2025; multifunction devices are projected to grow at a 8.90% CAGR through 2031.
- By installation, the transmission segment held 47.90% of the digital fault recorder market share in 2025, while distribution networks are advancing at a 8.65% CAGR to 2031.
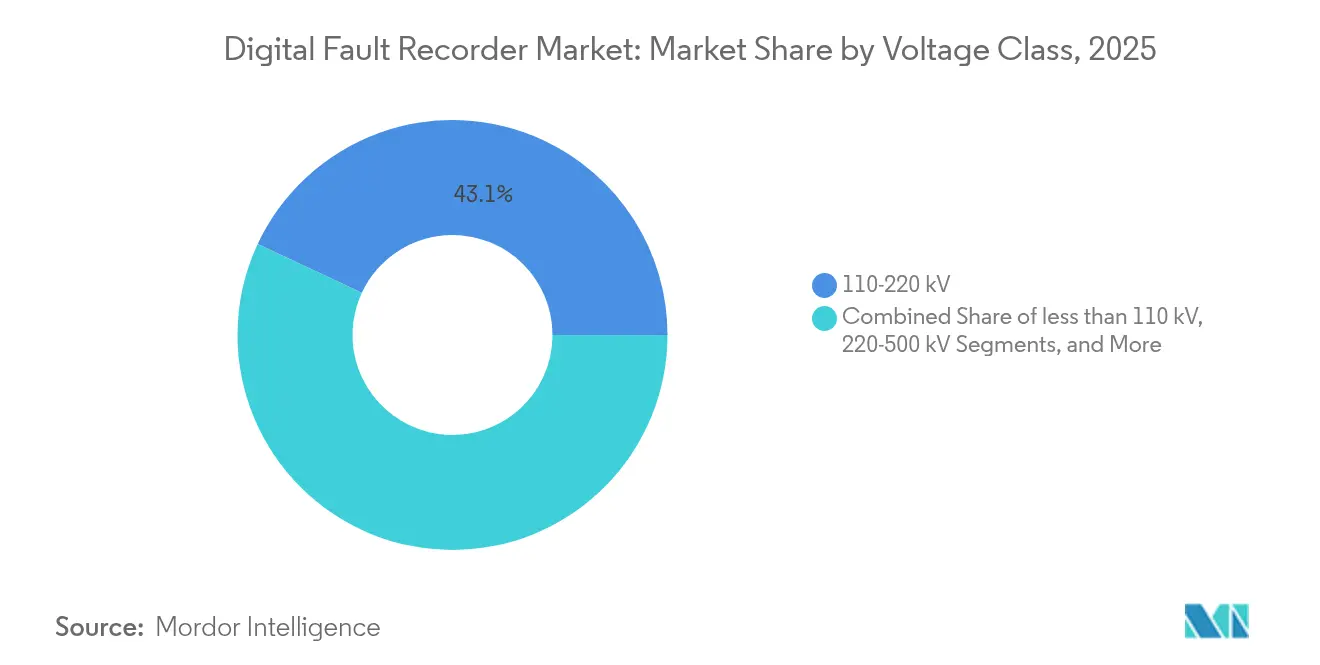
- By voltage class, 110-220 kV captured 43.05% share of the digital fault recorder market size in 2025; the 220-500 kV segment is anticipated to expand at an 8.05% CAGR between 2026 and 2031.
- By communication protocol, IEC 61850-compliant devices accounted for 60.75% of the digital fault recorder market size in 2025 and are growing at an 7.75% CAGR to 2031.
- By end-user, utilities represented 38.35% share in 2025; data centers are advancing at an 8.10% CAGR through 2031.
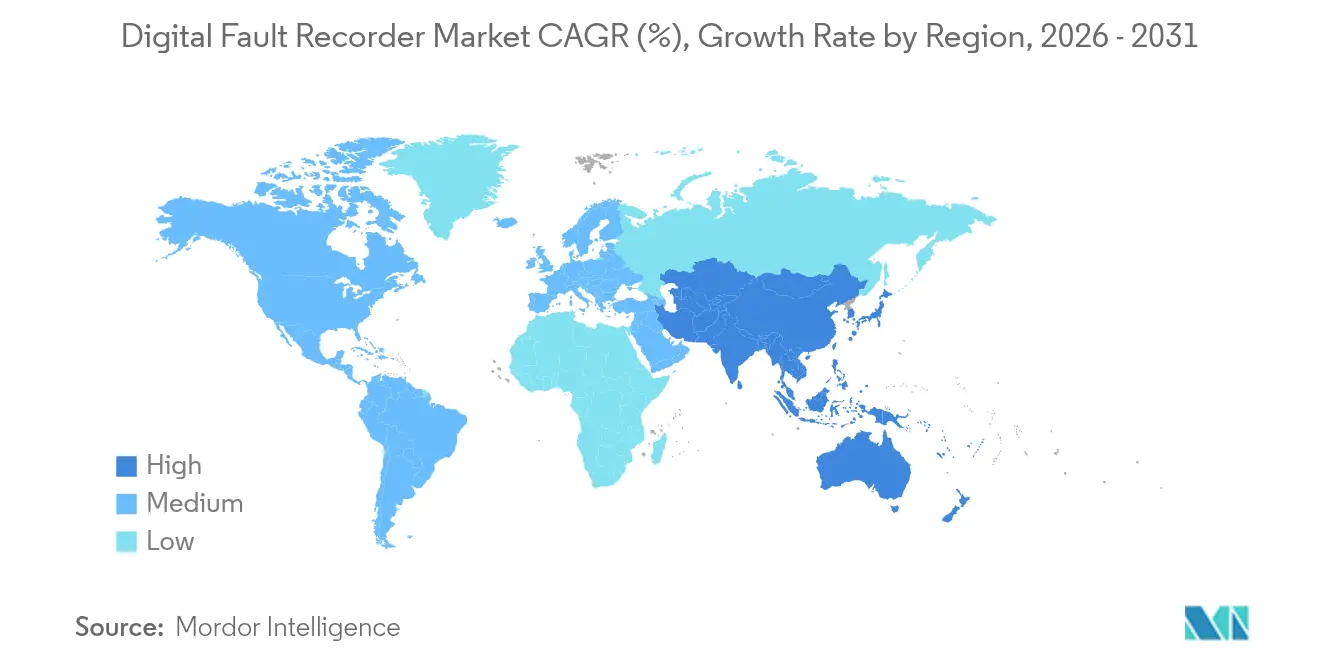
- By geography, North America commanded a 35.35% share in 2025, whereas Asia-Pacific is poised for an 8.45% CAGR to 2031.
Note: Market size and forecast figures in this report are generated using Mordor Intelligence’s proprietary estimation framework, updated with the latest available data and insights as of 2026.
Market Trends and Insights
Drivers Impact Analysis of Digital Fault Recorder Market*
| Driver | (~) % Impact on CAGR Forecast | Geographic Relevance | Impact Timeline |
|---|---|---|---|
| Grid-modernization capex surge | +2.1% | Global, concentrated in North America and EU | Medium term (2-4 years) |
| Mandatory NERC PRC-002-2 compliance | +1.8% | North America, expanding globally | Short term (≤ 2 years) |
| Renewable and inverter-based generation penetration | +1.5% | Global, led by APAC and Europe | Long term (≥ 4 years) |
| IEC 61850 process-bus roll-out | +1.2% | Global, early adoption in mature markets | Medium term (2-4 years) |
| AI-driven predictive maintenance demand | +0.9% | North America and EU, moving to APAC | Long term (≥ 4 years) |
| Data-center substation reliability push | +0.7% | Global, data-center hubs | Short term (≤ 2 years) |
| Source: Mordor Intelligence | |||
Grid-Modernization Capex Surge
Record utility capital programs underpin sustained ordering cycles for the digital fault recorder market. The European Union has earmarked EUR 584 billion for network upgrades by 2030, while North America channels USD 10.5 billion in federal funds toward grid resilience. Suppliers such as Hitachi Energy are investing heavily—USD 4.5 billion through 2027—to scale production and digital capabilities, signalling confidence that modernization spending will survive macroeconomic slowdowns. Utilities increasingly bundle fault recorders with power-quality meters and disturbance analytics, treating them as foundational elements of next-generation grid control architectures. National security framing around grid reliability further shields budgets from cyclical cuts. [1]
Mandatory NERC PRC-002-2 Disturbance-Monitoring Compliance
North American utilities face immovable timelines to demonstrate disturbance-recording coverage across bulk power assets. Penalties for non-compliance can reach multimillion-dollar levels, driving an accelerated procurement cycle for IEC 61850-ready digital fault recorders that satisfy PRC-002-2 event-capture windows while also delivering power-quality insights. The compliance model is resonating abroad: European and Asian regulators reference NERC’s framework as they craft equivalent monitoring rules, laying the groundwork for export growth. Utilities favor multifunction units to meet multiple standards in one footprint, supporting the consolidation of relay and recorder hardware.
Renewable and Inverter-Based Generation Penetration
Wind and solar assets introduce high-frequency harmonics, sub-synchronous oscillations, and rapid voltage swings that overwhelm legacy electromechanical recorders. Utilities such as Dominion Energy deploy high-resolution digital fault recorders to validate inverter models and fine-tune protection settings, reducing false trips during variable generation ramps. As renewable shares rise past 40% in several grids, event data from fault feed into stability studies and adaptive protection schemes that maintain reliability alongside fault current limiter deployment. The need for millisecond-level event correlation favours devices with multi-gigabyte buffers and advanced signal-processing algorithms. [3]
IEC 61850 Process-Bus Roll-Out
Utilities migrating toward process-bus topologies view digital fault recorders as core nodes within an IEC 61850-native substation. Process-bus architectures digitize measurements at source transformers, cutting copper runs in half and boosting data fidelity. Vendors offer modular recorders that ingest sampled values under IEC 61850-9-2, enabling station-wide event correlation on a single platform. Early adopters report engineering time savings and smoother device interoperability, though skilled configuration resources remain scarce. Cyber-secure editions of IEC 61850 strengthen adoption momentum as utilities weigh long-term asset life-cycle costs over initial spend.
Restraints Impact Analysis of Digital Fault Recorder Market*
| Restraint | (~) % Impact on CAGR Forecast | Geographic Relevance | Impact Timeline |
|---|---|---|---|
| High upfront cost of multifunction DFRs | -1.4% | Global, acute for smaller utilities | Short term (≤ 2 years) |
| OT-network cyber-security concerns | -1.1% | Global, heightened in critical infrastructure | Medium term (2-4 years) |
| Shortage of waveform-analysis expertise | -0.8% | Global, sharp in emerging markets | Long term (≥ 4 years) |
| Memory-chip thermal-cycle reliability | -0.6% | Global, harsh environments | Medium term (2-4 years) |
| Source: Mordor Intelligence | |||
High Upfront Cost of Multifunction DFRs
Advanced multifunction units priced between USD 50,000 and USD 200,000 test smaller utilities’ budgets at a time when they must also fund cybersecurity hardening and distribution automation. Integration, training, and licensing expenses can double the life-cycle cost, prompting tiered deployment strategies that limit installations to critical nodes. Suppliers counter by offering subscription pricing and modular firmware unlocks, yet capital constraints remain the chief adoption brake in price-sensitive regions. [4]
OT-Network Cyber-Security Concerns
Recorder connectivity to SCADA backbones raises fears of new attack vectors. Utilities deploy deep-packet-inspection appliances and micro-segmentation firewalls, but many smaller operators lack the talent to sustain 24/7 monitoring. Cyber incidences involving operational technology reinforce caution, delaying recorder upgrades where legacy air-gapped designs still operate reliably. Vendors embed secure boot and role-based access controls, but risk aversion persists until utilities standardize zero-trust architectures across substations. [2]
*Our forecasts treat driver/restraint impacts as directional, not additive. The impact forecasts reflect baseline growth, mix effects, and variable interactions.
Digital Fault Recorder Market Segment Analysis
By Type:
Multifunction Platforms Accelerate ConsolidationDedicated units dominated the digital fault recorder market with a 57.90% revenue share in 2025. Transmission operators value their proven reliability, deterministic response, and straightforward relay-scheme integration. However, multifunction devices record a 8.90% CAGR to 2031 as buyers seek to collapse disturbance recording, power-quality metering, and analytics gateways into a single enclosure. Multifunction adoption is strongest in greenfield substations where space and wiring reduction justify premium pricing. Utilities running pilot projects report engineering-hour savings of up to 20% when relying on virtualized protection software. The digital fault recorder market size captured by multifunction devices is forecast to reach USD 1.42 billion by 2031, underpinned by declining per-channel costs and firmware-driven feature expansion. Vendor roadmaps converge toward cloud-update capability, enabling remote addition of synchrophasor streaming and IEC 61850 Edition 2 features without hardware swaps. The competitive narrative shifts as relay incumbents integrate high-resolution capture cards, while traditional recorder specialists develop modular I/O options to protect their share.

By Installation:
Distribution Builds MomentumTransmission grids held 47.90% of the digital fault recorder market share in 2025 because bulk-power nodes remain mandatory monitoring points across most reliability regimes. Yet distribution networks, historically under-instrumented, post the fastest 8.65% CAGR through 2031. Distributed energy resource connections, voltage-regulating inverters, and vehicle-to-grid pilots create complex fault signatures at medium-voltage levels. Utilities now specify recorders for feeder head-ends and critical distribution transformers to resolve power-quality complaints and minimize outage investigation times. The digital fault recorder market size attributable to distribution is projected to pass USD 980 million in 2031 as unit costs fall and compact form factors become mainstream. Meanwhile, generation-site deployments concentrate on renewable plants where grid-code compliance requires oscillography for every fault trip; these projects favour devices with embedded disturbance analysis that ease certification.
By Voltage Class:
Ultra-High-Voltage Drives UpsideThe 110-220 kV band retained 43.05% revenue in 2025, reflecting its status as backbone voltage across most regional grids. Rapid rollout of 220-500 kV corridors, especially in China and India, pushes that segment to an 8.05% CAGR. Ultra-high-voltage alternating-current and direct-current lines transfer wind and solar power over 1,000 km distances, demanding recorders that support high sampling rates and fibre-optic time-sync. Vendors introduce temperature-hardened designs rated to −40 °C for remote converter stations. The >500 kV niche commands premium prices and advanced fault-location algorithms that integrate traveling-wave methods, but volume remains comparatively low. Nevertheless, the digital fault recorder market finds outsized value creation in these mega-projects, often bundling recorders with STATCOMs and series-compensation upgrades. Device interoperability at such voltage levels becomes critical due to multi-vendor consortia tasked with grid interconnection.
By Communication Protocol:
IEC 61850 Sets the BenchmarkIEC 61850-compliant equipment accounted for 60.75% of total 2025 revenue and expanded at an 7.75% CAGR as operators standardize on open, vendor-agnostic architectures. The digital fault recorder industry benefits from universal adoption of GOOSE messaging and Sampled Values streams, which simplify protection coordination and reduce wiring. Recorders now ship with integrated engineering tools that auto-generate Intelligent Electronic Device descriptions, cutting project commissioning days by up to 30%. Legacy DNP3 and Modbus variants persist in retrofit contexts where replacement budgets are limited or cyber-risk reviews remain incomplete. Nonetheless, most utilities set IEC 61850 interoperability as a prerequisite for tender qualification. The digital fault recorder market size attributable to IEC 61850 solutions is forecast to reach USD 1.95 billion by 2031 as Edition 3 security extensions gain traction.
By End-user:
Data Centers Surge AheadUtilities remained the prime buyers with 38.35% 2025 revenue, but hyperscale data-center operators drive the strongest 8.10% CAGR to 2031. These facilities exceed 100 MW demand and stipulate fault-recorder installation at upstream substations and on-site generator buses to ensure compliance with strict service-level agreements. Real-time waveform analytics integrate into data-center infrastructure management dashboards, providing operators with early-warning alarms for sags, swells, or transient over-voltages. Industrial plants retain steady adoption rhythms, focusing recorders on production lines where unplanned outages incur significant downtime penalties. Rail and metro projects constitute a growing niche as electrification targets broaden, with recorders aiding traction power protection studies. Oil and gas rigs install ruggedized units rated for offshore vibration and humidity, underscoring the breadth of operational contexts captured within the digital fault recorder market.
Geography Analysis
North America Digital Fault Recorder Market
North America, holding 35.35% revenue share in 2025, benefits from robust federal funding and stringent NERC standards that oblige disturbance monitoring on all bulk-electric-system elements. Programs under the Bipartisan Infrastructure Law drive rapid retrofit cycles that favour multifunction recorders packaged with power-quality features. United States utilities expand disturbance-monitoring scope to inverter-based resources, while Canada aligns standards to smooth cross-border power flows. Mexico presents emerging opportunities as interconnection upgrades and renewable integration mandates demand improved event visibility.
APAC Digital Fault Recorder Market
Asia-Pacific posts the fastest 8.45% CAGR, powered by China’s State Grid investment of more than CNY 600 billion (USD 84.5 billion) in ultra-high-voltage construction and comprehensive digital upgrades. India’s grid modernization surges on strong demand growth, with recent HVDC awards lifting record installations in renewable corridors. Japan, South Korea, and Australia roll out smart-grid pilots that require IEC 61850 process-bus compatibility, creating openings for multinational suppliers. Southeast Asian distribution utilities embrace compact recorders for feeder automation as electrification rates climb.
EMEA Digital Fault Recorder Market
Europe sustains steady growth under the European Commission’s EUR 584 billion network plan, focusing on offshore wind integration and cross-border trading. Germany and the Netherlands adopt innovative grid-technology packages that expand capacity without new lines, relying on high-resolution data for dynamic rating algorithms. Nordic operators invest in synchronous condensers and STATCOM upgrades, bundling recorders to validate performance. Eastern European networks catch up on substation digitalization, supported by cohesion funds that lower capital hurdles. The Middle East and Africa, while smaller in volume, display rising interest as industrialization and renewable build-outs advance, prompting the adoption of scalable monitoring solutions.
Regulatory Landscape
In North America, disturbance monitoring requirements embedded in the NERC Reliability Standard PRC-002 (Disturbance Monitoring and Reporting Requirements) continue to anchor digital fault recorder deployments across bulk electric system assets, with utilities aligning recorder coverage and event-capture performance to compliance expectations. On the cyber front, federal policy focus on grid reliability and security intensified with a directive issued in April 2025 to strengthen the electric grid amid rising demand from AI data centers and manufacturing, increasing scrutiny on how connected recording devices are hardened and managed.
Regulatory and standards activity in 2026 also reinforced cyber-secure digitalization in substations. In March 2026, the Federal Energy Regulatory Commission approved modified Critical Infrastructure Protection (CIP) Reliability Standards, including CIP-003-11 for low-impact facilities, supporting the adoption of modernized digital infrastructure while maintaining security controls for OT-connected assets such as recorders and disturbance-monitoring systems. Interoperability and data-exchange expectations continue to be shaped by widely referenced standards including IEEE C37.111 (COMTRADE) and IEEE C37.232 (naming convention), alongside IEC 61850 for digital substation communications.
Value Chain Analysis
The value chain starts with upstream electronics and timing components, including high-speed analog-to-digital converters, FPGAs, memory modules, and GPS or PTP-capable time-synchronization hardware that enable high-fidelity waveform capture and microsecond-level alignment. Midstream participants design and manufacture digital fault recorders and multifunction platforms, integrating IEC 61850 communications stacks, cybersecurity features, storage, and analytics-ready firmware; established suppliers include relay and grid-automation incumbents as well as recorder specialists. Standards conformance, notably IEC 61850 for substation integration and COMTRADE for transient data exchange, shapes component selection, software architecture, and factory test procedures.
Downstream, utilities, industrial operators, and data-center owners procure, engineer, and commission recorders as part of substation builds, retrofit programs, and reliability compliance initiatives, often bundling recorders with power-quality monitoring and disturbance analytics. System integrators and utility engineering teams support configuration, model mapping, and validation, which become recurring bottlenecks as deployments move from point solutions to station-wide or centralized disturbance and fault recording architectures. The chain is also increasingly influenced by commissioning automation and secure remote manageability, reflecting buyer priorities around lifecycle cost, skills constraints in waveform analysis, and cybersecurity hardening for OT-connected monitoring devices.
Competitive Landscape
The digital fault recorder market remains moderately fragmented. Global majors—Qualitrol, GE Vernova, Siemens, and ABB/Hitachi Energy—leverage deep utility relationships and end-to-end portfolios covering recorders, relays, and analytics platforms. Mid-tier specialists such as Schweitzer Engineering Laboratories and ERLPhase differentiate through ultra-high-speed capture and niche applications in research labs or HVDC converter stations. Competitive pressure intensifies as buyers prioritize integrated solutions: vendors bundle cyber-secure gateways, power-quality modules, and AI-based diagnostics to command premium margins.
Technology leadership now revolves around edge compute and cloud connectivity. Hitachi Energy’s collaboration with Amazon Web Services demonstrates the pivot toward X-as-a-Service models that extend revenue streams beyond hardware. GE Vernova scales manufacturing footprints in the United States, Germany, and India to mitigate component shortages and serve localized demand. Patent filings escalate around digital twin simulation and traveling-wave location methods, signaling a race for intellectual-property defensibility. Strategic acquisitions—such as Schneider Electric’s Motivair purchase—expand adjacent capabilities in data-center liquid cooling, underscoring convergence between monitoring, thermal management, and energy optimization in mission-critical facilities.
Component supply constraints pose an industry-wide challenge. Memory-chip thermal-cycle reliability issues require redesign of high-frequency storage modules, while copper price volatility squeezes margins. Vendors shift to alternative alloys and explore vertical integration to secure semiconductor supply. Workforce shortages in waveform-analysis expertise further complicate project execution, prompting suppliers to embed guided analytics in firmware to shorten learning curves for substation engineers. Overall, differentiation hinges on delivering cyber-secure, interoperable, and analytics-ready platforms that de-risk utility capital programs.
Digital Fault Recorder Industry Leaders
-
Qualitrol Company LLC
-
GE Grid Solutions (GE Vernova)
-
Siemens AG
-
AMETEK Power Instruments
-
ABB Ltd. (Hitachi Energy DFR line)
- *Disclaimer: Major Players sorted in no particular order
Digital Fault Recorder Market Companies Covered in this Report
- Qualitrol Company LLC
- GE Grid Solutions (GE Vernova)
- Siemens AG
- AMETEK Power Instruments
- ABB Ltd. (Hitachi Energy DFR line)
- ERLPhase Power Technologies Ltd.
- KoCoS Messtechnik AG
- Elspec Ltd.
- Kinkei System Corp.
- Prosoft Systems Ltd.
- Ducati Energia SpA
- Schweitzer Engineering Laboratories (SEL)
- Novatech Automation (Bitronics)
- Arbiter Systems, Inc.
- NR Electric Co., Ltd.
- Yokogawa Electric Corporation
- Arteche Group
- BHEL (Bharat Heavy Electricals Ltd.)
- Beijing Sifang Automation Co., Ltd.
- Shenzhen Shuanghui Electric Co., Ltd.
- CG Power & Industrial Solutions Ltd.
- Izumi Electric Co., Ltd.
- Zhejiang Yongteng Electric Co., Ltd.
- Supco Systems, Inc.
- Hitachi Energy Ltd.
Market Opportunities and Future Outlook
A key opportunity is faster IEC 61850-centric substation deployments that reduce lifecycle labor tied to configuration and model mapping. Evidence of progress is visible in May 2026 research describing full-chain automated configuration for smart fault recorders, reducing configuration time from 4.5 hours to 1.2 hours per device, which targets utility concerns around commissioning throughput and data accuracy. Vendors that package auto-discovery, guided engineering workflows, and validation tooling around IEC 61850 sampled values and station bus integration have a clearer basis to differentiate beyond hardware specifications.
Interoperability-driven software layers also create room for recorder-grade differentiation as utilities and large power users standardize on established data formats and time synchronization for cross-vendor event correlation. IEEE/IEC C37.111 (COMTRADE) continues to be the benchmark for transient data exchange, enabling multi-vendor analytics and enterprise disturbance management, while movement toward centralized disturbance and fault recording over IEC 61850 MMS/GOOSE supports higher demand for data quality delivered through substation controllers and gateways. At the same time, grid modernization programs and higher renewable penetration are creating practical demand for higher-fidelity capture, including continuous point-on-wave and power-quality class capabilities, expanding addressable spend from standalone recorders to integrated recording, timing, cybersecurity, and analytics toolchains.
Recent Industry Developments in Digital Fault Recorder Market
- June 2026: Elspec released G5DFR firmware v1.2.4.6, upgrading SSH security by removing SHA-1 algorithms and adding ECDSA host key support. The update strengthens baseline cyber hardening for connected recording devices used in critical infrastructure environments where remote access controls and cryptographic posture are increasingly scrutinized.
- November 2025: Qualitrol detailed the IDM+ multifunctional disturbance recorder, combining fast and slow disturbance recording, power quality monitoring, traveling wave, sequence of events recording, and phasor measurement streaming in one platform. The integrated approach supports procurement consolidation as buyers look to collapse multiple monitoring functions into fewer devices and standardize data outputs for enterprise disturbance analytics.
- March 2025: Elspec commissioned 55 units of its G5 multi-functional digital fault recorders at a wind power generating company in India. The deployment highlights growing use of multifunction recorders in renewable-heavy systems that require high-resolution event visibility to analyze inverter-driven disturbance signatures and improve fault investigation workflows.
Digital Fault Recorder Market Report Scope and Research Methodology
Market Definition and Coverage
This market is sized as the revenue generated from digital fault recorders used to capture, time stamp, and store electrical disturbance and event data for power-system fault analysis and protection review across utility and industrial networks.
Scope exclusions: The sizing excludes broad protection relays, SCADA and communications infrastructure, and services that are not bundled with the recorder sale.
Segments Covered in This Report
-
By Type
- Dedicated
- Multifunctional
-
By Installation
- Generation
- Transmission
- Distribution
-
By Voltage Class
- <110 kV
- 110-220 kV
- 220-500 kV
- >500 kV
-
By Communication Protocol
- IEC 61850-compliant
- Legacy/Proprietary
-
By End-user
- Utilities
- Industrial and Manufacturing
- Railways and Metros
- Data Centers
- Oil and Gas
- Other End-users
-
By Geography
-
North America
- United States
- Canada
- Mexico
-
South America
- Brazil
- Argentina
- Chile
- Rest of South America
-
Europe
- Germany
- United Kingdom
- France
- Italy
- Spain
- Russia
- Rest of Europe
-
Asia-Pacific
- China
- India
- Japan
- South Korea
- Singapore
- Malaysia
- Australia
- Rest of Asia-Pacific
-
Middle East and Africa
-
Middle East
- United Arab Emirates
- Saudi Arabia
- Turkey
- Rest of Middle East
-
Africa
- South Africa
- Nigeria
- Rest of Africa
-
Middle East
-
North America
Data Sources, Market Sizing, and Validation
Desk Research
Desk work starts with mapping where fault recording demand comes from, which is typically tied to transmission and distribution buildouts and grid reliability programs. We reference public sources such as energy and electricity statistics from agencies like the U.S. Energy Information Administration, grid and power-equipment references from bodies like IEEE, and country-level energy balances from sources such as the International Energy Agency.
To anchor adoption signals, we also use utility reliability and outage reporting where available, transmission project disclosures, and standards language that clarifies what is treated as a disturbance recorder versus adjacent monitoring equipment. Company annual reports, investor presentations, and product documentation help translate these signals into realistic pricing bands and replacement cycles, supported by a paid subscription for company financials, patents, and trade or shipment checkpoints where useful. The sources named above are illustrative only, and many other public references and paid datasets were also used for data collection, cross-checks, and clarification.
Primary Interviews and Surveys
Primary work focuses on validating what gets purchased, how deployments are specified, and how budgets move across transmission, distribution, and generation sites. We gathered views from equipment makers, system integrators, and utility or industrial users across major regions, so gaps from desk inputs could be closed and assumptions adjusted using practical feedback.
Distribution of primary research fieldwork respondents
| Company type | Respondent position | Region |
|---|---|---|
| Top tier: 30% | CXOs: 14% | APAC: 43% |
| Mid tier: 51% | Functional/Unit leaders: 36% | EMEA: 37% |
| Smaller Players: 19% | Managers: 50% | Americas: 20% |
Market-Sizing & Forecasting
Sizing begins with a top-down build where grid investment, substation count proxies, and protection and monitoring penetration are used to reconstruct the realistic addressable pool for digital fault recorders in each region. The totals are then corroborated using selective bottom-up checks, such as sampled average selling prices multiplied by estimated unit demand, and supplier and channel conversations that flag undercounted or double-counted areas.
Key inputs that shape the model include the pace of transmission and distribution upgrades, substation automation trends, replacement timing for legacy recorders, average channel count and storage needs by site criticality, and typical installation density at transmission substations versus distribution nodes. Where primary inputs show wide variance, we handle gaps by applying conservative ranges and then narrowing them through follow-up calls and cross-checks against project disclosures. For forecasting, scenario analysis is used so base case growth reflects expected grid modernization and renewable integration timing, and it is adjusted based on expert views on procurement cycles and lead times.
Data Validation & Update Cycle
Validation is done through multiple checks so the model does not drift away from real purchase behavior. We compare outputs against independent signals, such as utility capex direction, known grid expansion programs, and price movement discussed by respondents, then investigate outliers before sign-off.
A second analyst reviews key assumptions, and we re-contact sources when a major variance appears across regions or when a new event changes demand, for example a step-up in grid hardening plans. Reports are refreshed annually, with interim updates when material shifts occur, and a final pre-delivery review is completed so the numbers reflect the latest available information.
Mordor Intelligence's Digital Fault Recorder Market Size Versus Other Published Estimates
Published market sizes for digital fault recorders can vary widely because scope boundaries are often set differently, and because pricing and replacement assumptions differ across studies. The table helps show how changes in what is counted, and when values are converted to USD, can move the reported market size.
The benchmark table shows a spread mainly driven by whether protection relays and broader grid monitoring devices are counted alongside recorders, and under Mordor Intelligence's scope only dedicated digital fault recorder revenue is included, which keeps adjacent protection and SCADA layers outside the market total.
Benchmark comparison
| Source | Market Size | Gaps in Research Methodology |
|---|---|---|
| Mordor Intelligence | USD 2.21 B (2026) | |
| Trade Journal A | USD 0.96 B (2024) | Uses an earlier base year and appears to focus on dedicated DFRs only, with a narrower installed-base view and limited visibility into transmission project refresh cycles, which lowers the implied demand pool. |
| Industry Report B | USD 1.20 B (2025) | Takes a different timing and pricing path, and likely applies a tighter average selling price range and slower replacement assumption, which can suppress the value even when unit growth is positive. |
Reading across the rows, differences can be traced back to definitional scope, the year chosen for sizing, and how ASP and replacement timing are carried into the model. By keeping the inputs tied to clear grid build and modernization signals, and then pressure-testing them with interview feedback, the final number stays explainable and repeatable for planning use.
Key Questions Answered in the Report
What is the current size of the digital fault recorder market?
The market stands at USD 2.21 billion in 2026 and is forecast to reach USD 3.11 billion by 2031 at a 7.12% CAGR over 2026-2031.
Which region leads the digital fault recorder market?
North America leads with 35.35% revenue in 2025, driven by strict NERC compliance and federal modernization funding.
Why are data centers important for future digital fault recorder demand?
Hyperscale data centers require micro-second disturbance visibility, propelling an 8.10% CAGR for recorder installations in this segment through 2031.
How does IEC 61850 influence recorder selection?
IEC 61850-compliant devices hold 60.75% market share thanks to their interoperability and process-bus capabilities, making the standard a default tender requirement.
What is the biggest restraint on digital fault recorder adoption?
High upfront costs of multifunction units, ranging from USD 50,000 to USD 200,000, limit uptake among smaller utilities.
Which segment is growing fastest within the digital fault recorder market?
The distribution-network installation segment is advancing at a 8.65% CAGR as utilities seek deeper visibility into medium-voltage grids.