
Digital Biomarkers Market Size and Share
Market Overview
| Study Period | 2020 - 2031 |
|---|---|
| Market Size (2026) | USD 5.22 Billion |
| Market Size (2031) | USD 12.77 Billion |
| Growth Rate (2026 - 2031) | 19.62 % |
| Fastest Growing Market | Asia-Pacific |
| Largest Market | North America |
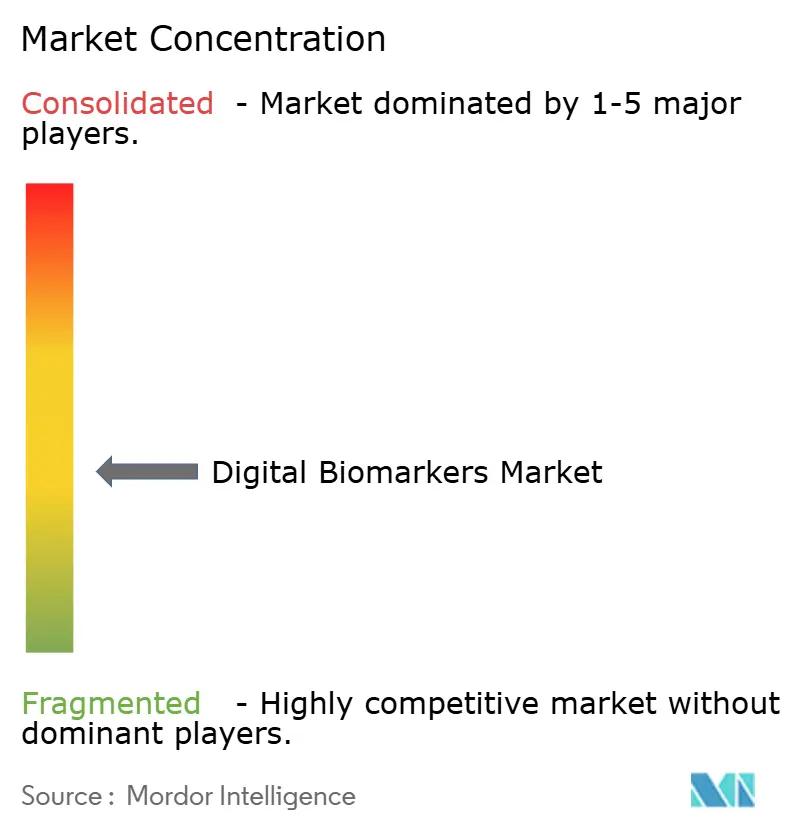
| Market Concentration | Medium |
Major Players
*Disclaimer: Major Players sorted in no particular order Image © Mordor Intelligence. Reuse requires attribution under CC BY 4.0. |
|
Digital Biomarkers Market Analysis by Mordor Intelligence
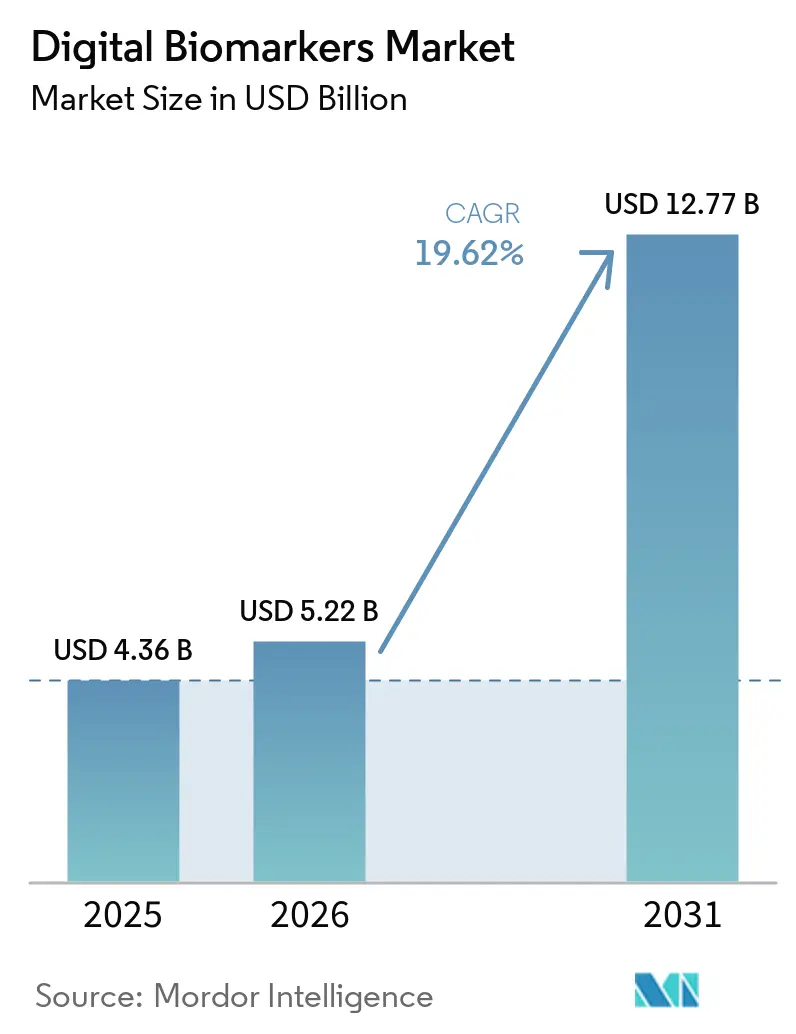
Digital Biomarkers market size in 2026 is estimated at USD 5.22 billion, growing from 2025 value of USD 4.36 billion with 2031 projections showing USD 12.77 billion, growing at 19.62% CAGR over 2026-2031.
Demand accelerates as regulators certify consumer-grade devices, payers reimburse remote monitoring, and clinicians adopt algorithmic endpoints that lower trial costs. FDA qualification of the Apple Watch AFib History feature and the creation of a Digital Health Advisory Committee confirm that mainstream wearables can meet medical-grade evidence standards. At the same time, the European Medicines Agency’s green light for stride-velocity endpoints in Duchenne studies cut sample needs by 70%, spotlighting efficiency gains. Across industry, outcome-based contracts, generative-AI analytics, and real-time phenotyping shift value from raw sensing to data fusion, setting the tone for platform consolidation.
Key Report Takeaways
- By component, Data Collection Tools accounted for 65.12% of digital biomarkers market share in 2025, while Data Integration & Analytics Platforms are forecast to grow at a 20.12% CAGR to 2031.
- By data source, Wearables led with a 39.44% revenue share in 2025; Mobile Applications are projected to expand at a 20.2% CAGR through 2031.
- By therapeutic area, Cardiovascular & Metabolic Disorders held 39.98% of the digital biomarkers market size in 2025, whereas Neurological Disorders are on track for a 20.33% CAGR between 2026-2031.
- By clinical practice, Diagnostic Digital Biomarkers represented 50.62% share in 2025, and Monitoring Digital Biomarkers are progressing at a 20.31% CAGR.
- By end user, Pharmaceutical & Biotech Companies represented 37.42% of the digital biomarker market share in 2025, and Payers & Employers are progressing at a 20.18% CAGR.
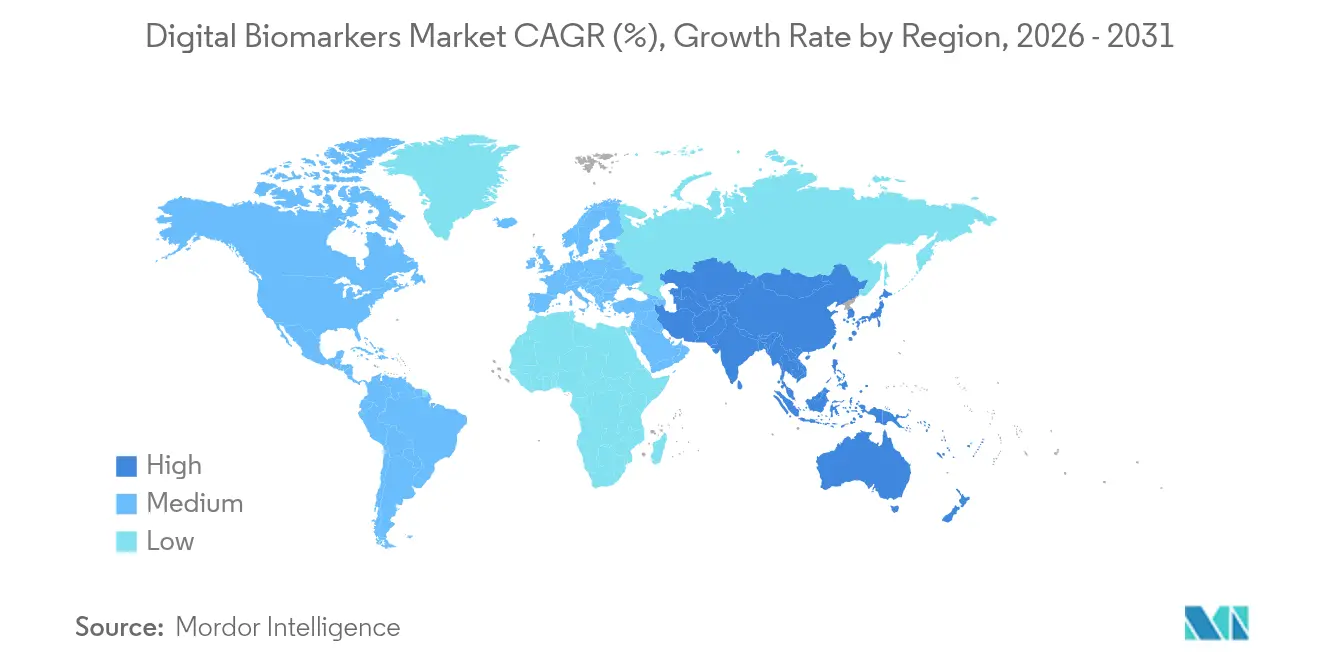
- By geography, North America captured 42.88% share in 2025; Asia-Pacific is the fastest-growing region at a 20.41% CAGR to 2031.
Note: Market size and forecast figures in this report are generated using Mordor Intelligence’s proprietary estimation framework, updated with the latest available data and insights as of 2026.
Market Trends and Insights
Drivers Impact Analysis of Digital Biomarkers Market*
| Driver | (~) % Impact on CAGR Forecast | Geographic Relevance | Impact Timeline |
|---|---|---|---|
| Increasing prevalence of chronic & metabolic diseases | +4.2% | Global, with highest impact in North America & Europe | Long term (≥ 4 years) |
| Rapid proliferation of clinical trials adopting sensor-based endpoints | +3.8% | North America & EU, expanding to APAC | Medium term (2-4 years) |
| Accelerated FDA qualification of Software-as-a-Medical-Device solutions | +3.1% | North America core, spill-over to global markets | Short term (≤ 2 years) |
| Wearable-centric disease prevention programs by payers & employers | +2.9% | North America & EU, emerging in APAC | Medium term (2-4 years) |
| Generative-AI-enabled multi-modal data fusion for real-time phenotyping | +2.7% | Global, led by North America & China | Long term (≥ 4 years) |
| Pharma shift to outcome-based contracts leveraging longitudinal DBx | +2.4% | Global, with early adoption in North America & EU | Medium term (2-4 years) |
| Source: Mordor Intelligence | |||
Increasing prevalence of chronic & metabolic diseases
Commercial health systems face rising costs from diabetes, obesity, and hypertension. Continuous monitoring fills clinical gaps by spotting deterioration between visits, lowering avoidable admissions, and enabling lifestyle coaching. Six in ten U.S. adults live with a chronic illness, creating healthcare spend above USD 4.1 trillion annually. Dexcom’s USD 75 million investment in Oura aligns glucose trends with sleep, exercise, and stress metrics, demonstrating multi-modal metabolic tracking that supports preventive care [1]Source: DexCom Inc., “Dexcom Invests in Oura Health for Integrated Metabolic Insights,” dexcom.com .
Rapid proliferation of clinical trials adopting sensor-based endpoints
Pharma sponsors now embed digital endpoints to reduce site visits and capture real-world function. EMA qualification of stride velocity in Duchenne studies trimmed recruitment needs by 70% and validated remote gait metrics for rare diseases. Regeneron’s internal digital biomarker laboratory and dedicated summit further prove that large sponsors view sensor data as pivotal for trial acceleration within the digital biomarkers market.
Accelerated FDA qualification of Software-as-a-Medical-Device solutions
Clearer pathways shorten time from proof-of-concept to reimbursement. The FDA Digital Health Advisory Committee, announced in February 2024, creates a permanent review channel, while draft guidance on AI model credibility outlines transparency rules for algorithm updates [2]US Food and Drug Administration, “Digital Health Advisory Committee Announcement,” Food and Drug Administration, fda.gov . Apple’s AFib History tool, cleared as a class II medical device development asset, shows that consumer devices can cross the regulatory threshold when rigorous evidence is provided.
Wearable-centric disease prevention programs by payers & employers
U.S. remote patient monitoring revenue is expected to double from 2024 to 2030, supported by Medicare CPT codes that reimburse data review and patient coaching. Employer health plans integrate step counts, heart-rate variability, and sleep scores to stratify risk and incentivize healthier behavior, generating savings through avoided emergency visits and lower premiums.
Restraints Impact Analysis of Digital Biomarkers Market*
| Restraint | (~) % Impact on CAGR Forecast | Geographic Relevance | Impact Timeline |
|---|---|---|---|
| Fragmented regulatory pathways across regions | -2.1% | Global, with highest impact in emerging markets | Medium term (2-4 years) |
| Cyber-security & patient-consent hurdles for continuous data capture | -1.8% | Global, with stricter requirements in EU | Long term (≥ 4 years) |
| Lack of reimbursement codes for stand-alone digital endpoints | -1.5% | Global, with progress in North America | Short term (≤ 2 years) |
| Signal drift & algorithm bias in diverse populations | -1.2% | Global, with focus on underrepresented populations | Long term (≥ 4 years) |
| Source: Mordor Intelligence | |||
Fragmented regulatory pathways across regions
Although the EU Medical Device Regulation seeks harmonization, divergent evidence demands still force sponsors to run extra studies, raising costs [3]Carolina Amaral, "Global Regulatory Challenges for Medical Devices: Impact on Innovation and Market Access," MDPI, mdpi.com. Germany’s Digital Health Care Act grants reimbursement for DiGA apps, yet similar frameworks lag in other member states, slowing multinational launches. Japan’s historical device-approval lag illustrates how inconsistent timelines limit cross-border scalability in the digital biomarker market.
Cyber-security & patient-consent hurdles for continuous data capture
Data streams entering electronic health records must comply with GDPR in Europe and HIPAA in the United States. High-resolution behavioral data heighten breach risks, driving hospitals to request formal penetration testing and end-to-end encryption audits before deployment. Public concerns over algorithmic transparency and secondary data use can dampen enrollment, especially for mental-health monitoring applications.
*Our forecasts treat driver/restraint impacts as directional, not additive. The impact forecasts reflect baseline growth, mix effects, and variable interactions.
Digital Biomarkers Market Segment Analysis
By Component:
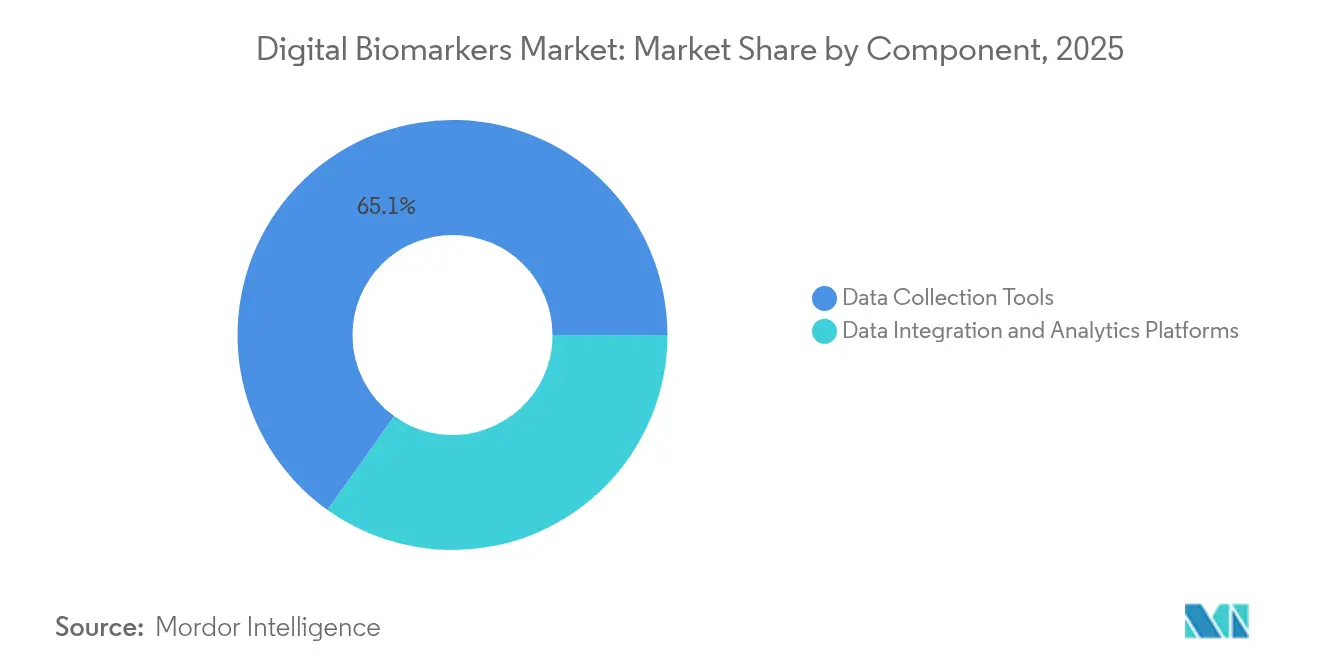
Analytics Platforms Drive Value CreationData Collection Tools commanded 65.12% of digital biomarkers market share in 2025 because sensors and gateways remain essential for capturing physiological and behavioral signals. However, Data Integration & Analytics Platforms are growing at a 20.12% CAGR, reflecting a structural shift toward advanced pipelines that clean, fuse, and interpret data for clinical decision support. Study Watch by Verily converts multi-channel raw inputs into validated gait, tremor, and sleep biomarkers, illustrating how software unlocks predictive power for trial sponsors and care teams.
Platform suppliers raise entry barriers through proprietary algorithms and regulatory dossiers. Consolidation is expected as device-centric vendors acquire analytics assets, mirroring the USD 75 million Dexcom–Oura tie-up that links sensor streams with metabolic insights. In this context, data-fusion engines that deliver real-time phenotyping at point of care are projected to capture the bulk of future revenue upside.


By Data Source:
Mobile Applications Gain Clinical ValidationWearables retained 39.44% of the digital biomarker market revenue in 2025 due to wide consumer uptake and near-continuous data capture. The segment still benefits from iterative hardware upgrades such as cuffless blood pressure and noninvasive glucose sensing. Mobile Applications, forecast to rise at 20.2% CAGR, benefit from the 6.8 billion smartphone installed base and zero incremental hardware cost. Vocal biomarkers, valued highly in 2024, show how built-in microphones classify airway obstruction and neurological decline without specialist equipment, complementing emerging EPO biomarkers in broader digital health research.
Implantables remain niche yet offer adherence-free sensing for heart failure and epilepsy. Environmental sensors round out contextual markers, and emerging smart textiles leverage conductive fibers to monitor vitals during sleep. As ecosystem builders such as Samsung prepare the Galaxy Ring with noninvasive metabolic monitoring, multi-device orchestration will turn siloed datapoints into unified risk profiles.
By Therapeutic Area:
Neurological Disorders Accelerate InnovationCardiovascular & Metabolic Disorders accounted for 39.98% of digital biomarkers market size in 2025 because glucose monitors, arrhythmia detectors, and blood-pressure patches are clinically entrenched. Neurological Disorders, advancing at a 20.33% CAGR, now lead innovation pipelines as motion-sensor gait metrics, touchscreen cognitive assessments, and speech analytics enable early Alzheimer’s and Parkinson’s detection. The FDA’s support for digital motor endpoints and the Parkinson’s DREAM Challenge, which crowdsourced 40 international teams, confirm the efficacy of algorithmic scoring in longitudinal studies.
Digital respiratory markers leverage chest-worn bands and phone microphones to assess cough frequency and nocturnal apnea. Musculoskeletal use cases harness inertial measurement units for rehab progress, while oncology explores fatigue and performance status via passive mobility tracking. Therapeutic expansion continues as AI models extract condition-specific features across comorbidities.
By Clinical Practice:
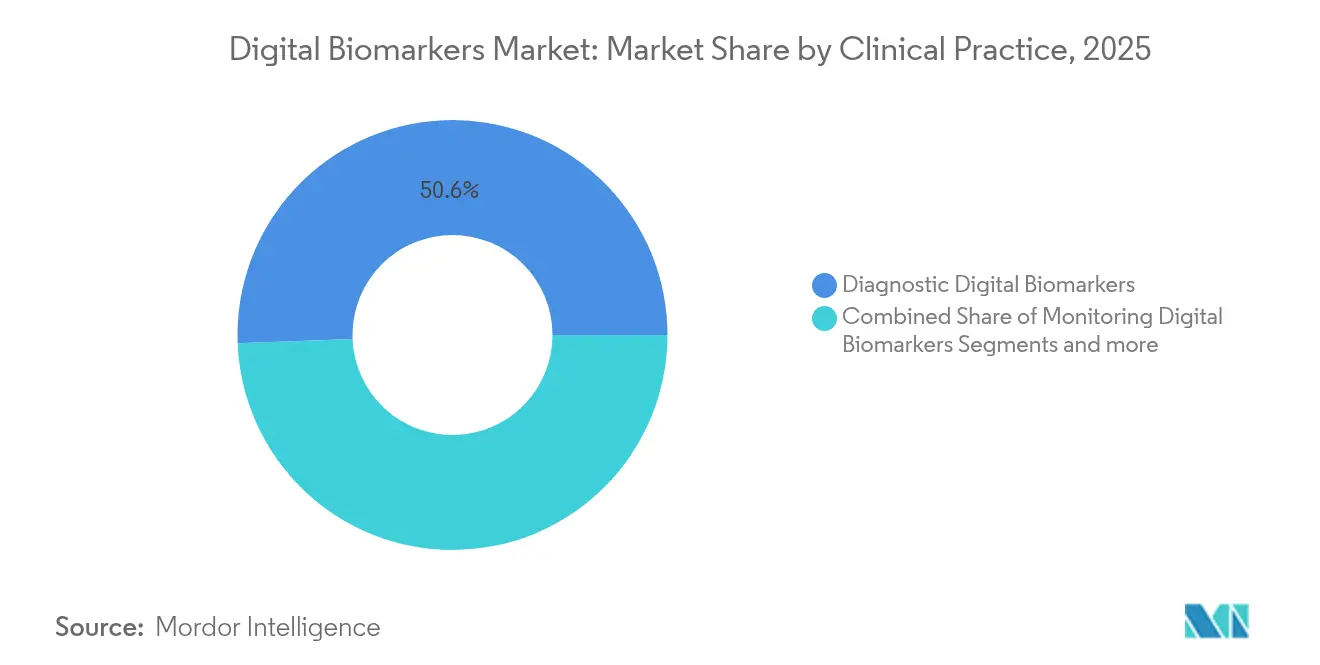
Monitoring Applications Drive AdoptionDiagnostic Digital Biomarkers held 50.62% of the digital biomarkers market revenue in 2025 through point-in-time screening for arrhythmia, diabetic retinopathy, and mild cognitive impairment. Monitoring Digital Biomarkers are projected to post a 20.31% CAGR to 2031 as payers endorse longitudinal surveillance that flags deterioration ahead of acute events. Circadian-rhythm actigraphy, validated as a biomarker of biological aging, demonstrates how continuous patterns can forecast hospitalizations and guide lifestyle prescriptions.
Predictive & Prognostic tools layer machine-learning risk scores on streaming datasets to tailor therapy intensity and trial enrichment. The FDA’s Drug Development Tool qualification program signals that validated algorithms can de-risk pivotal studies, encouraging sponsors to incorporate monitoring signals as primary outcomes. Emerging applications such as medication-adherence tracking and behavioral-health triage expand digital biomarker reach beyond traditional vital signs.
By End User:
Payers Embrace Value-Based ModelsPharmaceutical & Biotech Companies controlled 37.42% of the digital biomarkers market revenue in 2025, driven by trial efficiency and decentralized design. Biofourmis, for instance, secured platform deals with four top-20 drug makers to supply sensor-driven endpoints that compress timelines and reduce protocol deviations. Payers & Employers are on course for a 20.18% CAGR as value-based care demands evidence of preventive savings. DiMe and Elevance Health launched an independent seal that validates technical and clinical performance, giving actuaries confidence to reimburse new tools.
Healthcare Providers integrate dashboards into electronic medical records, using alerts to optimize staffing and remote titration programs. Academic centers and tech firms in the Others category pilot novel use cases such as digital stethoscopes and camera-based respiratory analysis, fertilizing the pipeline for future reimbursement.
Geography Analysis
North America Digital Biomarkers Market
North America generated 42.88% of digital biomarkers market size in 2025 thanks to FDA leadership, Medicare CPT codes, and widespread broadband. Large integrated delivery networks deploy remote programs that cut readmissions for chronic heart failure, incentivizing further investment. U.S.-based pharmaceutical sponsors dominate trial activity, meaning endpoints validated locally often propagate worldwide.
APAC Digital Biomarkers Market
Asia-Pacific is projected to grow at a 20.41% CAGR through 2031, fueled by Chinese government mandates to embed AI monitoring into primary care and Japan’s super-aged society seeking fall prevention and arrhythmia screening. Local manufacturing of sensors lowers device price points, while public-private partnerships roll out regional telehealth hubs. India and Southeast Asia adopt smartphone-based respiratory and metabolic screening to bridge specialist shortages, enabling leapfrog diffusion.
Germany and Europe Digital Biomarkers Market
Europe balances strict privacy law with supportive reimbursement. Germany reimburses prescribed apps up to EUR 700 (USD 735) per year, proving commercial pathways, while the wider European Health Data Space aims to harmonize cross-border data use. EMA qualification of digital stride metrics in neuromuscular trials underlines regulatory openness, yet differing country-level evidence standards still slow uniform coverage, keeping platform vendors focused on targeted pilot contracts.

Regulatory Landscape
Regulation for digital biomarkers continues to develop, but pathways still differ across medical devices, software-as-a-medical-device (SaMD), and drug-development tools. In the United States, the FDA uses cross-center governance for digital health technologies (CDER, CBER, and CDRH), and it has kept formal mechanisms in place for how digital health technologies are used in clinical investigations, including a public information and comment request published in the Federal Register on March 31, 2026. In Europe, the European Medicines Agency uses its Qualification of Novel Methodologies (QoNM) process to qualify digital endpoints within a defined context of use, reinforcing sponsor adoption of sensor-based measures for drug development.
Standard-setting efforts are also shaping the evidence packages sponsors prepare. The Digital Medicine Society (DiMe) and its DATAcc initiative have been publishing standardized digital measures (including sets for common mental health disorders and pediatric rare diseases in 2026), which helps align data elements, validation expectations, and reporting conventions across sponsors, technology vendors, and care delivery partners. This mix of regulator engagement and third-party measure standardization supports broader use of wearable, mobile, and EEG-derived signals, while privacy and cybersecurity compliance requirements (GDPR in the EU and HIPAA in the United States) keep deployment and scaling dependent on governance and auditability.
Competitive Landscape
The digital biomarkers market houses a mix of consumer tech giants, med-tech incumbents, and software pure-plays. Apple leverages an installed base of 200 million Watch users, combining hardware control with a regulated ECG algorithm. Samsung expands the Galaxy ecosystem with cuffless blood pressure and glucose sensing, while Google-backed Verily pivots to enterprise research services. Medical device leaders respond by partnering or acquiring analytics firms; Dexcom’s tie-up with Oura extends glucose insights into holistic wellness dashboards.
Start-ups specialize in niche markers such as vocal cord resonance for COPD and camera-based tremor scoring for Parkinson’s. Competitive advantage centers on curated datasets, algorithm explainability, and evidence packages that withstand regulator scrutiny. Vendors with multi-condition portfolios and interoperable APIs align best with provider workflows, driving a gradual tilt toward platform concentration. Intellectual-property fencing around data-transformation pipelines, rather than raw sensor patents, emerges as the chief moat.
Separately, pharmaceutical sponsors increasingly bundle digital endpoints with drug label expansion strategies. Biofourmis, ActiGraph, and Koneksa secure repeat enterprise contracts by offering audit-ready data streams, turnkey dashboards, and services that manage patient tech support. Their domain expertise positions them as preferred integrators when sponsors negotiate adaptive-trial designs with regulators.
Digital Biomarkers Industry Leaders
-
ActiGraph
-
Fitbit Health Solutions
-
Biogen
-
F. Hoffmann-La Roche Ltd.
-
Huma
- *Disclaimer: Major Players sorted in no particular order
Digital Biomarkers Market Companies Covered in this Report
- ActiGraph
- Akili Interactive Labs
- AliveCor
- Altoida AG
- Apple (Health & Sensor Platforms)
- Biogen
- Dexcom
- Empatica
- Evidation Health
- Fitbit Health Solutions
- Roche
- Garmin
- Huma Therapeutics
- IXICO PLC
- Koneksa Health
- Medtronic
- Oura Health
- Koninklijke Philips
- Samsung Electronics
- Verily Life Sciences

Market Opportunities and Future Outlook
A near-term opportunity is emerging in higher-fidelity neurologic and sleep endpoints where continuous sensing can replace or complement episodic clinic assessments. EEG-based digital biomarkers are moving from academic feasibility into structured commercialization and trial use cases, supported by partnerships such as OneMedNet and Risorius (February 2026) to advance EEG-based digital biomarkers, and by clinical-trial collaborations such as Koneksa Health partnering with Beacon Biosignals on EEG biomarkers for sleep and neurologic disorders. Together, these efforts broaden the addressable digital biomarker toolkit beyond wearables and smartphone sensors into neurophysiology, creating whitespace for platforms that can operationalize data capture, quality control, and analysis at scale.
Another opportunity centers on standardization and protocol-level control of consumer wearables to generate regulatory-grade evidence for decentralized and hybrid trial designs. Samsung and Alcedis (part of Huma) announced a research partnership in June 2026 focused on translating wearable biometrics into clinical evidence, and Neuroscape and Samsung are running remote studies using Galaxy wearables to identify predictors of cognitive decline. In parallel, DiMe DATAcc digital measure releases in 2026 provide a practical route for vendors and sponsors to converge on shared definitions and validation approaches, reducing friction in multi-site and multi-country studies and reinforcing the case for integrated data collection and analytics platforms rather than standalone sensors.
Recent Industry Developments in Digital Biomarkers Market
- May 2026: Signant Health completed its acquisition of Ametris (formerly ActiGraph) to create an integrated platform combining electronic Clinical Outcome Assessment (eCOA) solutions with wearable-derived digital outcome measures. The consolidation expands end-to-end digital trial data capabilities and accelerates the deployment of digital biomarkers in trials. The combination strengthens the end-to-end digital trial data ecosystem and scalable endpoints.
- March 2026: Ametris and Signant Health announced a partnership to deliver a combined Digital Health Technology (DHT) and eCOA solution for complex CNS clinical trials. The alliance enhances sensitivity of endpoints in CNS studies through integrated data streams. The collaboration accelerates CNS trial modernization by enabling unified data flows.
- January 2026: Ametris and Kayentis announced a strategic partnership to deliver an integrated eCOA and wearable technology solution aimed at improving patient adherence in clinical trials. The initiative improves adherence tracking via wearables in trials. The partnership expands digital biomarkers data collection and workflow interoperability.


Digital Biomarkers Market Report Scope and Research Methodology
Market Definition and Coverage
For this study, the digital biomarkers market covers solutions that capture human health and behavior signals through connected devices and software, then convert them into measurable indicators that support monitoring, screening, research, or clinical decision support.
Scope exclusions: We exclude traditional lab-based biomarkers and imaging-only biomarkers when they are not generated from digital data streams.
Segments Covered in This Report
-
By Component
- Data Collection Tools
- Data Integration & Analytics Platforms
-
By Data Source
- Wearables
- Implantables
- Mobile Applications
- Sensors
- Others
-
By Therapeutic Area
- Cardiovascular & Metabolic Disorders
- Neurological Disorders
- Respiratory Disorders
- Musculoskeletal Disorders
- Others
-
By Clinical Practice
- Monitoring Digital Biomarkers
- Diagnostic Digital Biomarkers
- Predictive & Prognostic Digital Biomarkers
- Others
-
By End User
- Pharmaceutical & Biotech Companies
- Healthcare Providers
- Payers & Employers
- Others
-
By Geography
-
North America
- United States
- Canada
- Mexico
-
Europe
- Germany
- United Kingdom
- France
- Italy
- Spain
- Rest of Europe
-
Asia-Pacific
- China
- Japan
- India
- South Korea
- Australia
- Rest of Asia-Pacific
-
Middle East and Africa
- GCC
- South Africa
- Rest of Middle East and Africa
-
South America
- Brazil
- Argentina
- Rest of South America
-
North America
Data Sources, Market Sizing, and Validation
Desk Research
Desk work is used to set the boundaries of what counts as a digital biomarker, and to anchor the model with widely accepted healthcare and technology indicators. We referenced public sources such as the US FDA digital health and medical device resources, US NIH and PubMed for clinical-trial and publication signals, and the World Health Organization for chronic disease burden and priority conditions that affect remote monitoring demand.
To connect adoption with real-world availability, we also reviewed sources such as OECD health statistics, national statistics agencies for population and age structure, and clinical trial registries that show which therapeutic areas are actively testing digital endpoints. These inputs were combined with company filings, earnings decks, and credible press coverage to understand product positioning and pricing logic. Where needed, we used paid subscriptions for company financials, patent lookups, and news tracking to cross-check timelines and revenue mix cues. The desk sources listed here are illustrative only, and we also used other public documents and datasets for validation and clarification.
Primary Interviews and Surveys
Primary work focused on confirming what buyers actually pay for, how digital biomarker programs are packaged, and when revenue is recognized across pilots versus scaled deployments. We spoke with a mix of solution providers, healthcare delivery stakeholders, and life sciences users, then stress-tested assumptions across APAC, EMEA, and the Americas, so regional adoption and reimbursement realities were not averaged away.
Distribution of primary research fieldwork respondents
| Company type | Respondent position | Region |
|---|---|---|
| Top tier: 27% | CXOs: 17% | APAC: 48% |
| Mid tier: 53% | Functional/Unit leaders: 26% | EMEA: 30% |
| Smaller Players: 20% | Managers: 57% | Americas: 22% |
Market-Sizing & Forecasting
Sizing starts with a top-down build where healthcare digitalization and connected-care demand pools are reconstructed using disease burden, care settings, and adoption intensity by region. We then corroborate those totals with selective bottom-up approximations, such as sampled vendor revenue splits, program volume checks from deployments, and typical ASP-by-use-case ranges, which helps us adjust for overcounting between devices, software, and service layers.
Key inputs used in the model include the share of patients under remote monitoring programs, the number of active clinical trials using digital endpoints, smartphone and wearable penetration by age cohort, the mix of therapeutic areas (for example, neurology and cardiometabolic monitoring), and the shift from pilot projects to recurring contracts. We also tracked regulation and evidence signals, such as the pace of digital health clearances and published validation studies, because they affect time-to-adoption and pricing confidence.
For forecasting, we mainly use scenario analysis supported by trend smoothing on the core drivers, so the outlook reflects different speeds of reimbursement progress, clinical validation uptake, and hospital budget cycles. Where bottom-up inputs were sparse, gaps were handled by applying conservative penetration ramps and then stress-testing them with primary feedback, followed by a consistency check against adjacent digital health spend patterns.
Data Validation & Update Cycle
Outputs are validated through triangulation across independent signals, then checked for variance at the region and use-case level so one strong geography does not distort the global total. When a number looks off, we revisit assumptions like ASP progression, adoption timing, and what is counted as biomarker-grade analytics, and then we re-contact experts if the gap cannot be explained from documentation.
Before sign-off, the model goes through multi-step analyst reviews where calculations, unit logic, and currency handling are checked again. Reports are refreshed annually, and interim updates are triggered by material events such as major regulatory shifts, large funding cycles that change deployment capacity, or meaningful clinical guideline updates. Right before delivery, an analyst completes a final pass so clients receive the most current view available.
Mordor Intelligence's Digital Biomarkers Market Size Compared Against Other Published Estimates
Published market sizes for digital biomarkers often do not align because each publisher draws the line differently around what is counted and how fast adoption is assumed to expand. Differences usually come from scope choices around device-only versus device plus analytics, treatment of services revenue, regional coverage, and the way currency and timing are handled.
The benchmark table shows a spread around the mid-single-digit billions for 2024 to 2026, and in Mordor Intelligence's model the value is tied to biomarker-grade digital measures where revenue is counted only when the solution produces measurable endpoints, rather than bundling the full digital health platform spend. Gaps also show up when some estimates apply aggressive growth based on wearable shipment trends alone, or when pricing is modeled using list prices without region-level ASP normalization and primary checks.
Benchmark comparison
| Source | Market Size | Gaps in Research Methodology |
|---|---|---|
| Mordor Intelligence | USD 5.22 B (2026) | |
| Industry Research Publisher A | USD 4.00 B (2024) | Uses an earlier base year and leans on broad component segmentation, which can miss analytics and services revenue captured under biomarker programs in later years. |
| Press Release Digest B | USD 4.25 B (2024) | Often reflects headline figures with limited transparency on currency timing and validation steps, and may blend adjacent digital health categories that are not strictly biomarker endpoints. |
Taken together, the differences are mostly explained by what gets included as digital biomarker revenue and how adoption and pricing are carried forward year to year. Our approach keeps the total traceable to a clear demand pool, with assumptions that can be rechecked using public signals and then confirmed through repeatable primary conversations.


Key Questions Answered in the Report
What is the current value of the digital biomarkers market?
The digital biomarkers market size stood at USD 5.22 billion in 2026 and is forecast to reach USD 12.77 billion by 2031 at a 19.62% CAGR.
Which component segment is growing fastest?
Data Integration & Analytics Platforms are the fastest-growing component, expanding at a 20.12% CAGR because advanced algorithms turn raw sensor readings into actionable insights.
Why are payers interested in digital biomarkers?
Payers support continuous monitoring programs that flag health risks early, lowering hospitalizations and enabling value-based reimbursement models that cut long-term costs.
Which region will register the highest growth through 2031?
Asia-Pacific is projected to post the highest regional CAGR at 20.41% due to government digitization initiatives, large aging populations, and cost-effective wearable manufacturing.
How are digital biomarkers used in clinical trials?
Sponsors deploy sensor-based endpoints to measure gait, heart rhythm, or cognition remotely, cutting study visits and reducing sample sizes by up to 70% while maintaining statistical power.
What are the main regulatory hurdles?
Fragmented international approval pathways and stringent data-privacy laws increase evidence requirements and cybersecurity costs, slowing global scale-up for digital biomarker platforms.
Page last updated on:


 Your data is secure and never sold or shared.


